Fibonacci Retracement: Where Pullbacks Tend to End
Imagine you’re on an adventurous hike up a steep mountain. Halfway up, you decide to take a breather at some strategic spots before continuing your climb. The market behaves similarly. After a significant move in one direction, prices often retrace or pull back to certain levels before resuming their journey. This is where Fibonacci Retracement comes into play.
Fibonacci Retracement is a technical analysis tool that uses key levels derived from the Fibonacci sequence to predict potential support and resistance areas during a price retracement. The most commonly used Fibonacci levels are 23.6%, 38.2%, 50%, 61.8% and 78.6% which can also be written as 0.236, 0.382, 0.5, 0.618, 0.786.
Fibonacci retracement zones are where traders ask the most important question: continuation or reversal?
- Anonymous
How to Use Fibonacci Retracement in Trading?
To effectively use Fibonacci retracement in trading, start by identifying the recent high and low points of a price movement. Once you have pinpointed these key levels, apply the Fibonacci retracement tool by drawing from the swing low to the swing high in an uptrend, or from the swing high to the swing low in a downtrend. The tool will then automatically plot horizontal lines at important Fibonacci levels: 23.6%, 38.2%, 50%, 61.8%, and 100%.
Fibonacci retracement levels are important because they help traders:
- Identify potential reversal points where the price might find support or resistance.
- Determine entry and exit points for trades.
- Set stop-loss levels to manage risk effectively.
- Enhance the accuracy of trading strategies by combining with other technical analysis tools.
For beginners, it’s advisable to draw Fibonacci retracement lines in a strong trend, as pullbacks are easier to spot in a trending market.
Once your Fibonacci lines are drawn, focus on the key levels, particularly 38.2%, 50%, and 61.8%, which are the most commonly watched by traders. If the price approaches one of these levels, it may signal a reversal in the original direction.
In an uptrend, these retracement levels can act as support, meaning the price might bounce off these levels and continue its upward movement. Conversely, in a downtrend, these levels may serve as resistance, where the price could reverse and continue to fall. By using these levels, traders can better anticipate potential turning points and make more informed decisions about where to buy or sell.
Key Fibonacci Retracement Levels
Key Fibonacci levels commonly used in trading are derived from the Fibonacci sequence and are used to identify potential support and resistance levels in a price chart. Here are the most important levels:
Retracement Levels
These levels are used to predict where the price might retrace to after a significant move.
| Level | Description |
|---|---|
0% | Marks the end of the initial price move where the retracement begins. |
23.6% | A shallow retracement, indicating weak price correction. |
38.2% | Moderate retracement, often used as a potential entry point in a trending market. |
50% | Not a true Fibonacci number but widely recognized as a key level, signifying a halfway point of the prior move. |
61.8% | Known as the Golden Ratio, one of the most significant levels, indicating a strong support or resistance point. |
78.6% | Deep retracement, signaling a potential reversal or continuation of the trend. |
100% | Price has fully retraced back to the origin of the initial move, effectively undoing the prior trend. |
Extension Levels
These levels predict where the price might extend to after a retracement or consolidation, particularly in strong trends.
| Level | Description |
|---|---|
127.2% | Shallow extension beyond the prior high/low; often an early take-profit zone. |
161.8% | This is one of the most important extension levels, often used as a price target in strong trends. |
261.8% | Indicates a more extended price movement, usually a target in very strong trends. |
361.8% | A further extension of the move, acting as a key level for resistance or support. |
Negative Mirror Levels
These levels are mirrored Fibonacci values, often used in opposite trend scenarios or advanced strategies.
| Level | Description |
|---|---|
-23.6% | Acts as resistance in an uptrend (take profit for long), or support in a downtrend (take profit for short). |
-38.2% | Acts as a stronger resistance/support than -23.6%. |
-50% | Key psychological level; strong take-profit point for long or short trades. |
-61.8% | Golden Ratio mirror level, major take-profit or reversal zone in counter-trend moves. |
-78.6% | Deep mirror retracement; often used in volatile markets or advanced strategies. |
-100% | Complete move in reverse direction; another major take-profit level. |
-161.8% | Extended mirror target; often final resistance for long trades or support for shorts. |
-261.8% | Very extended mirror move, rarely reached but can signal extreme market conditions. |
-361.8% | Extreme mirror extension; used in high-volatility reversal forecasting. |
These Fibonacci levels help traders make informed decisions by identifying potential areas for price reversals, continuation of trends, or areas to take profits.
- Easy to Use: Fibonacci retracement is simple to apply and works on any asset or timeframe.
- Widely Recognized: Since many traders use Fibonacci levels, they can sometimes act as a self-fulfilling prophecy.
- Effective in Trending Markets: These levels are particularly useful in identifying retracements during strong trends.
Drawing Fibonacci Retracement in Uptrend
In an uptrend, you use Fibonacci retracement to identify potential support levels where the price might retrace before continuing the upward move. Here’s how to draw the Fibonacci levels:
- Identify the low point (the start of the uptrend) and the high point (the peak before the retracement).
- Select the Fibonacci retracement tool in your charting software (e.g., TradingView).
- Draw the Fibonacci retracement from the low point to the high point (from left to right).
The tool will automatically plot Fibonacci retracement levels, usually at 23.6%, 38.2%, 50%, 61.8%, and 78.6%. These levels act as potential support zones where price might reverse or consolidate before resuming the uptrend.
Identify Key Levels: Fibonacci retracement highlights critical support and resistance levels at 23.6%, 38.2%, 50%, 61.8%, and 78.6%.
Drawing Fibonacci Retracement in Downtrend
In a downtrend, Fibonacci retracement helps you identify potential resistance levels where the price may retrace before continuing to drop. Here’s the process:
- Identify the high point (the start of the downtrend) and the low point (the bottom before the retracement).
- Use the Fibonacci retracement tool.
- Draw the Fibonacci retracement from the high point to the low point (from left to right).
The tool will then plot the Fibonacci levels, which serve as potential resistance zones where the price may face difficulty breaking through before continuing the downtrend.
- Trend Confirmation: Always confirm the trend direction before drawing Fibonacci levels.
- Confluence Zones: Look for other technical indicators (like moving averages or support/resistance zones) that align with Fibonacci levels to increase their reliability.
- Higher Timeframes: Drawing Fibonacci levels on higher timeframes (e.g., daily, weekly) often provides stronger support and resistance zones.
Applications of Fibonacci Retracement in Different Markets
Understanding market volatility is crucial for effectively applying Fibonacci retracement:
| Volatility Type | Characteristics |
|---|---|
Low Volatility (Forex) | Predictable and gradual price movements allow for precise application of Fibonacci levels. Traders can set tighter risk parameters, with retracement levels holding more consistently. |
Moderate Volatility (Stocks) | Traders must account for larger price swings. Fibonacci retracement helps identify broader support and resistance zones, requiring adjusted risk management strategies. |
High Volatility (Cryptocurrencies) | Extreme price fluctuations demand careful use of Fibonacci retracement. Wider retracement levels may be more significant, and risk management becomes paramount. |
Stock market
The stock market exhibits moderate volatility, higher than Forex but lower than the cryptocurrency market. Stock prices are influenced by a mix of company-specific news, industry trends, economic data, and market sentiment. This leads to more pronounced price movements compared to Forex but not as extreme as those in cryptocurrencies.
- Application of Fibonacci Retracement: Traders use Fibonacci retracement to identify potential support and resistance levels during price corrections within broader trends. The larger price swings require careful analysis of retracement levels to anticipate where reversals or consolidations may occur.
- Risk Management: Due to increased volatility, traders need to account for greater potential movement when setting stop-loss and take-profit orders, adjusting their risk management strategies accordingly.
Forex market
The Forex market is known for its high liquidity and is generally considered the least volatile among major financial markets. Currency pairs typically exhibit steady trends influenced by macroeconomic factors like interest rates, inflation, and geopolitical events. The lower volatility results in smaller price swings, making market movements more predictable.
- Application of Fibonacci Retracement: In this stable environment, Fibonacci retracement levels can be highly effective for pinpointing precise entry and exit points. Traders use key retracement levels - such as 23.6%, 38.2%, 50%, and 61.8% to identify areas where a currency pair may retrace before continuing its trend.
- Risk Management: The relative stability allows traders to set tighter stop-loss orders and manage risk more effectively, relying on the consistency of retracement levels holding firm.
Cryptocurrency market
The cryptocurrency market is renowned for its high volatility, with prices capable of dramatic swings in short time frames. Influenced by factors such as technological developments, regulatory news, market sentiment, and speculative trading, cryptocurrencies can experience rapid and significant price movements.
- Application of Fibonacci Retracement: In this highly volatile market, Fibonacci retracement becomes essential for navigating extreme fluctuations. Traders rely on retracement levels to identify strategic entry and exit points, as these levels can signal critical reversal points amid unpredictable price action.
- Risk Management: The extreme volatility necessitates wider stop-loss and take-profit orders. Traders must dynamically adjust their strategies to respond to rapid market changes, using Fibonacci levels as a guide for potential market behavior.
Fibonacci Retracement in Uptrend
In an uptrend, Fibonacci retracement levels are used to find areas where the price might pull back (retrace) before continuing the upward move. Fibonacci extension levels are used to find areas where the price might extend after breaking out.
How to use Fibonacci in an Uptrend:
- Retracement Levels (23.6%, 38.2%, 50%, 61.8%): These levels act as potential support levels when the price pulls back.
- Extension Levels (127.2%, 161.8%): These are used as potential target levels when the price continues in the direction of the trend.
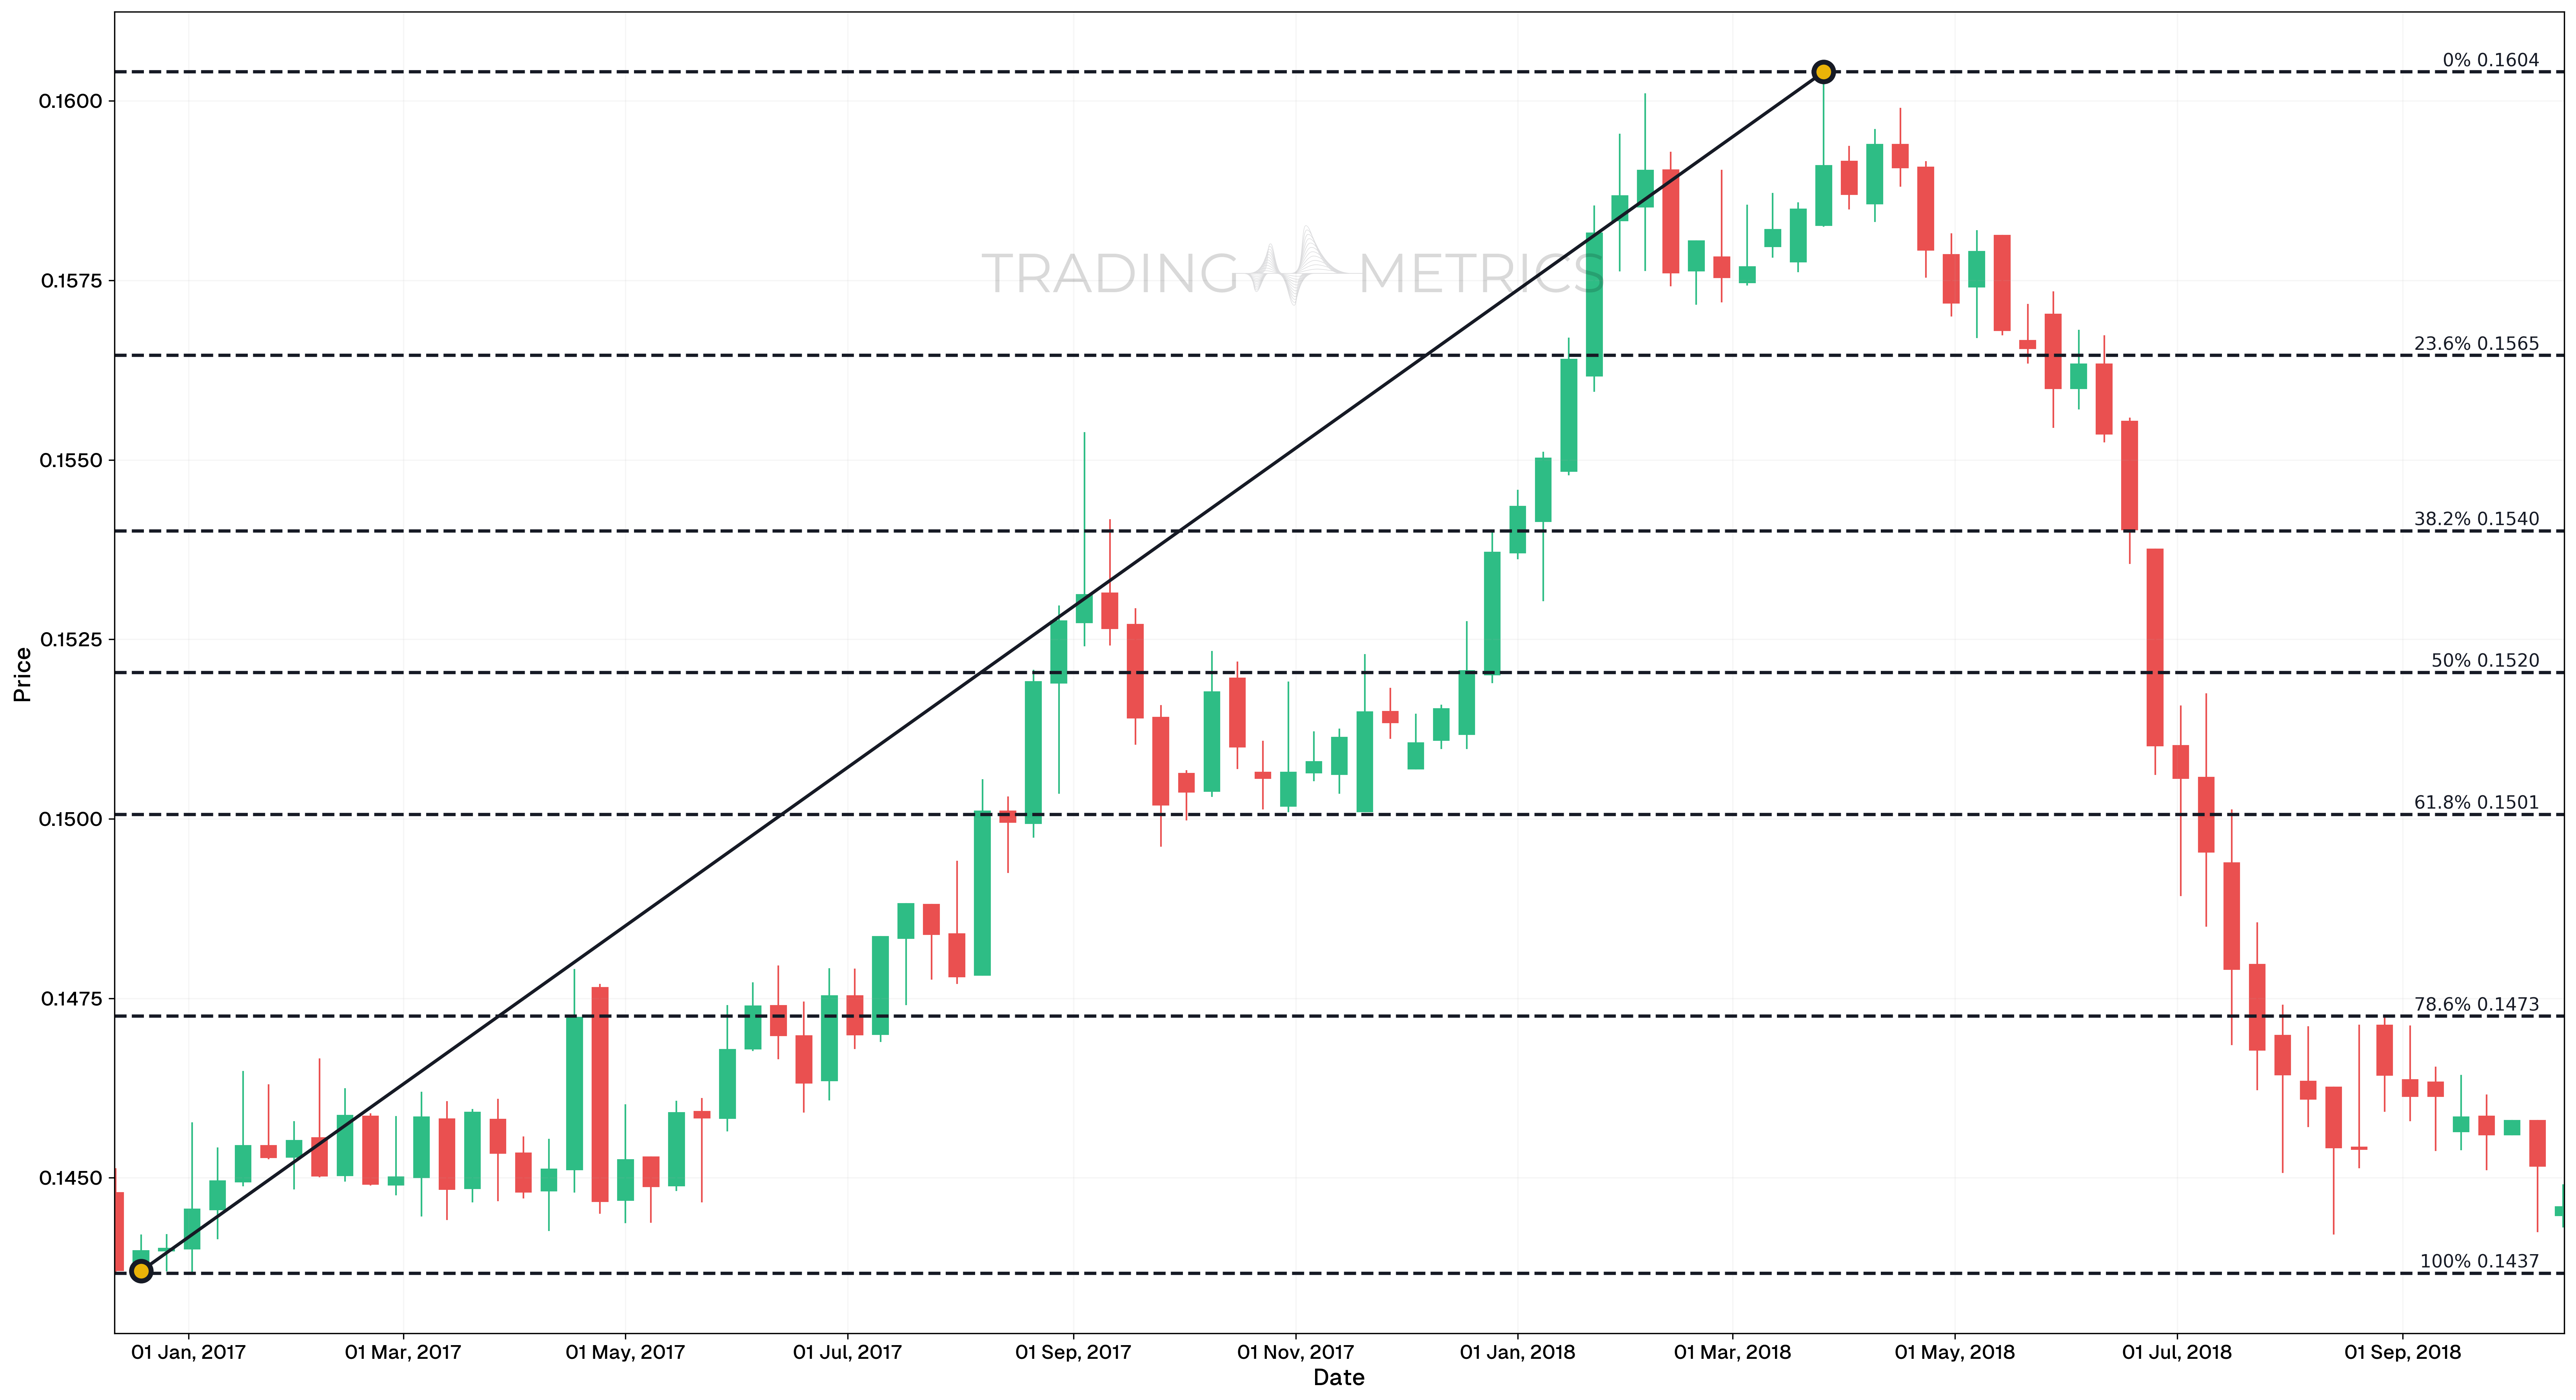
Failed long trade in an Uptrend
Analysis
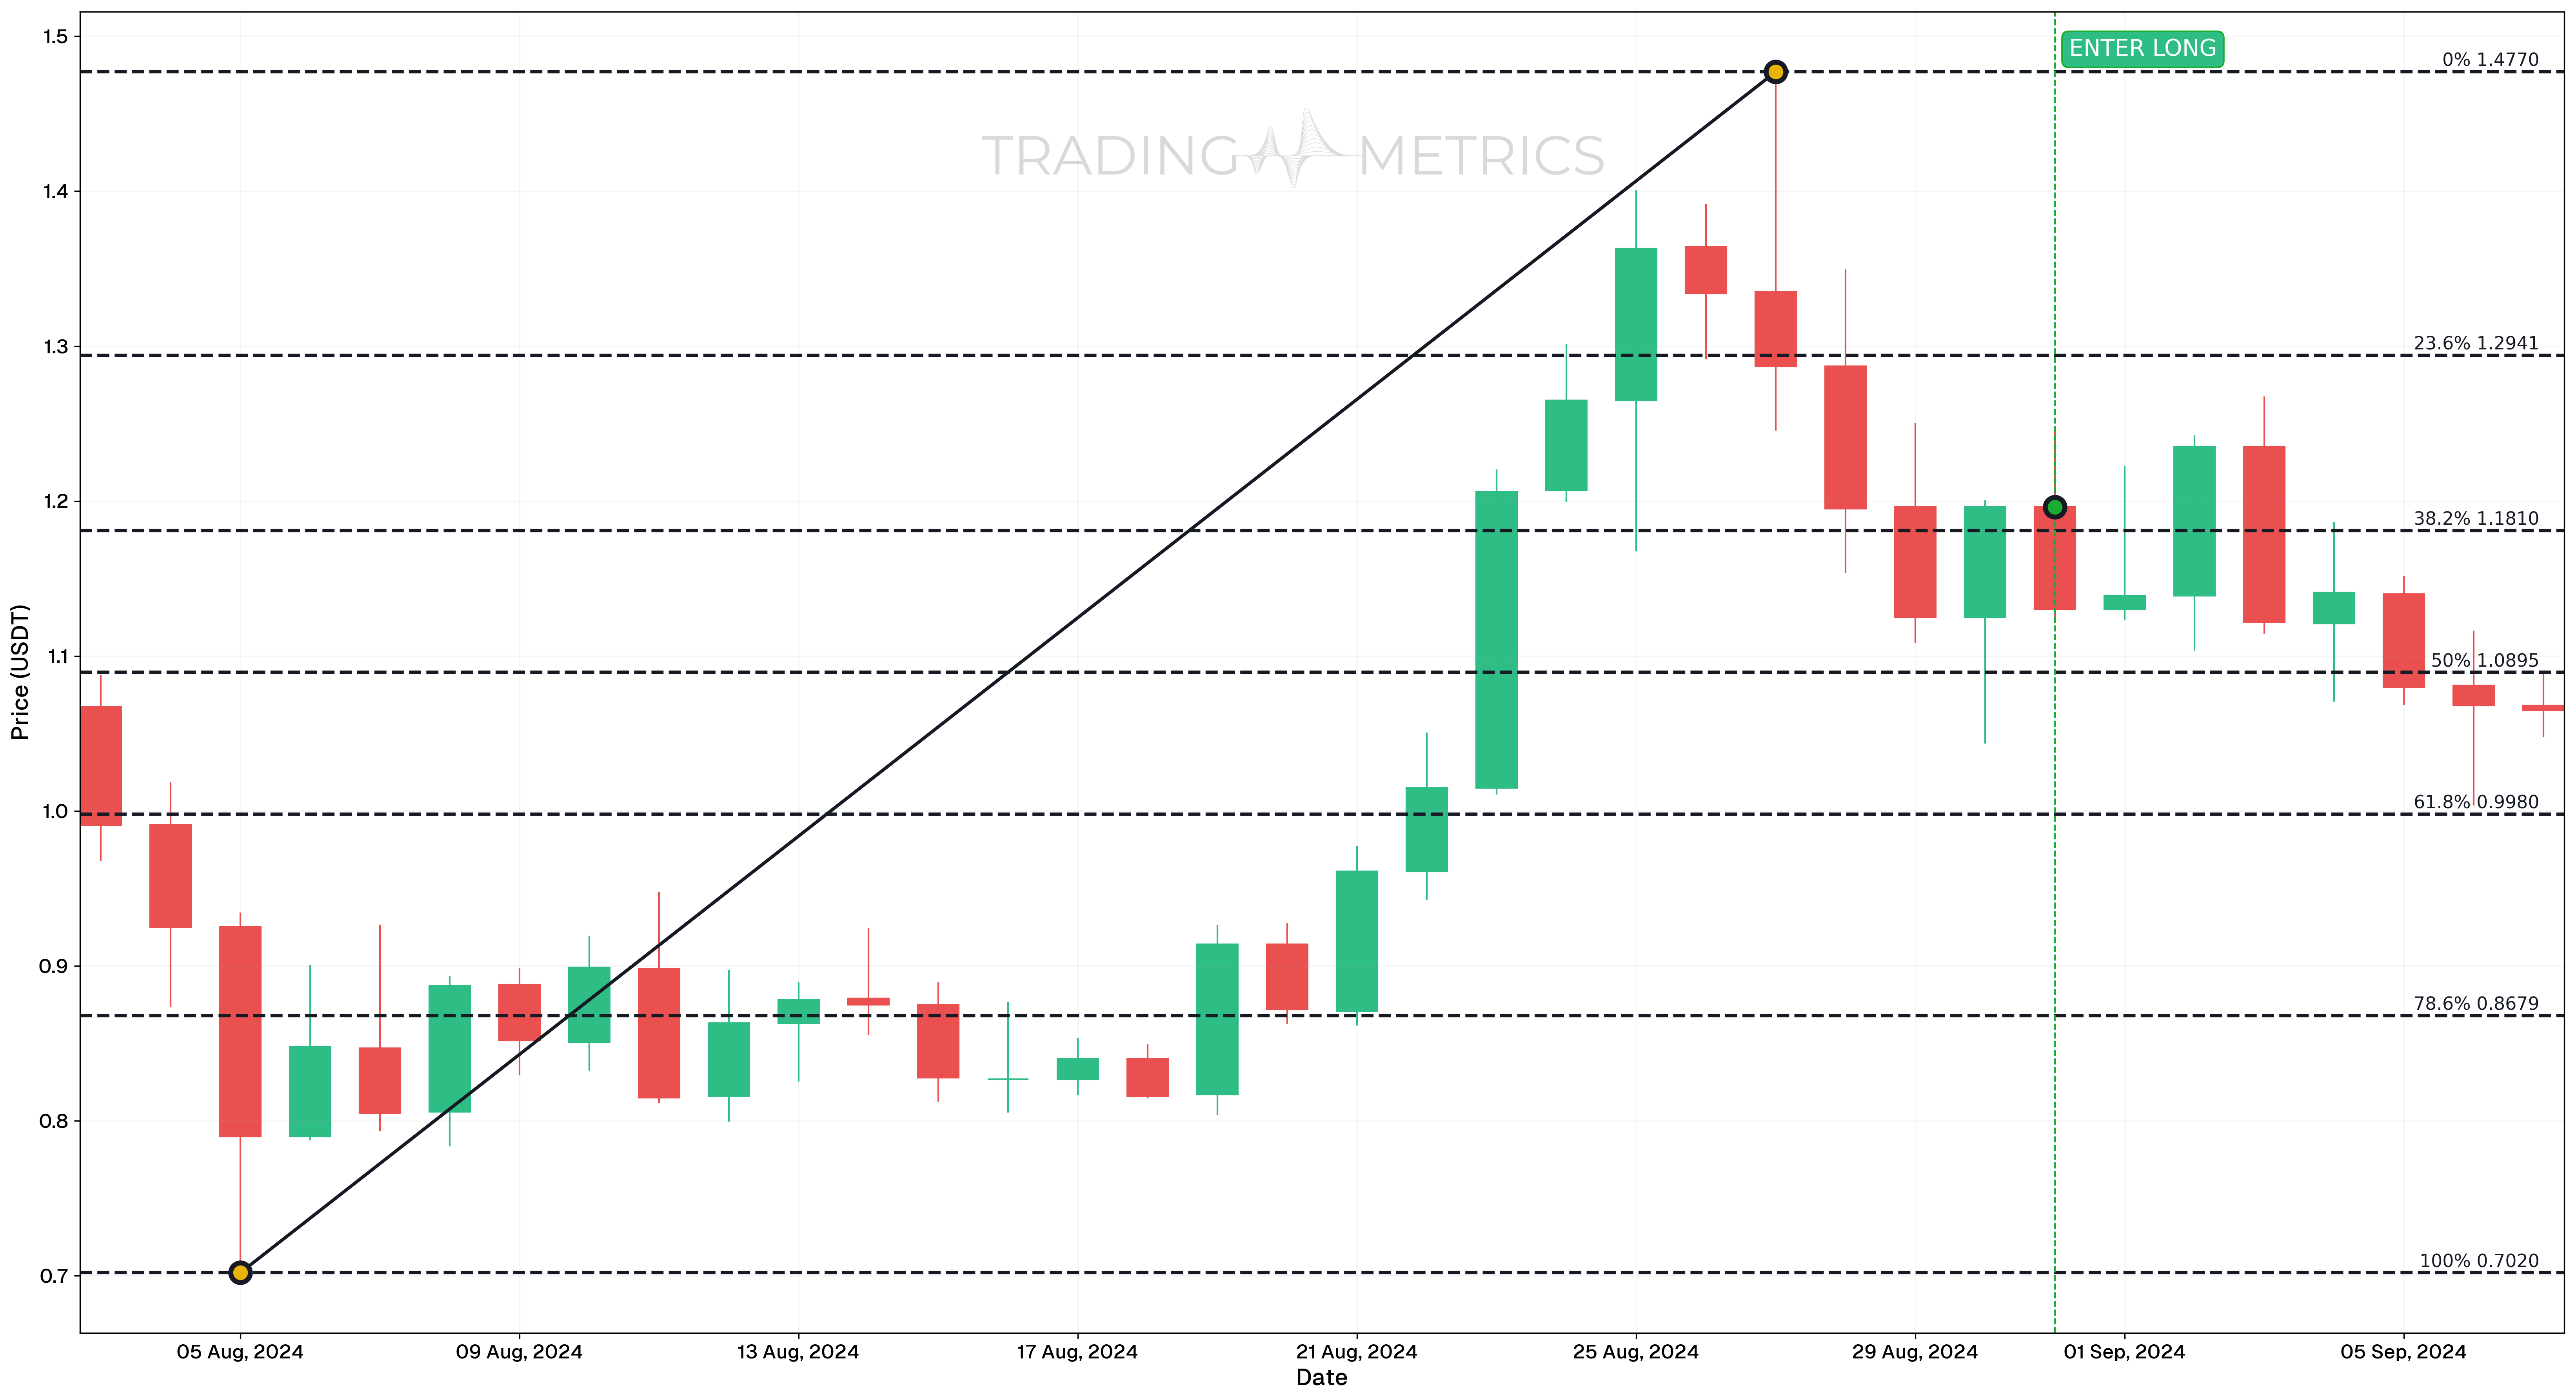
- On August 31, 2024, the price closed at the 38.2% Fibonacci retracement level, prompting a long trade setup. This level is often considered a key support zone in technical analysis.
- Despite the promising setup and alignment with Fibonacci retracement levels, the trade failed due to market conditions or unexpected price movements.
- This outcome underscores the importance of risk management and protecting capital, as even well-prepared setups can lead to losses.
Trade Setup
- Entry: A buy signal was generated on August 31, 2024, when the price reached the 38.2% Fibonacci retracement level, suggesting a potential reversal or continuation of the trend.
- Stop Loss: Traders should have implemented a stop-loss mechanism based on indicators like Average True Range (ATR), recent swing lows, or other relevant criteria to minimize risk.
- Exit: The trade would have been exited upon hitting the stop-loss or if the price failed to hold above the Fibonacci retracement level.
- Outcome: This trade highlights that even trades based on high-probability setups can fail. The failure reinforces the need for disciplined risk management, including defined stop-loss levels and position sizing to safeguard capital.
Conclusion
No trading strategy is foolproof. Incorporate multiple confirmations and ensure alignment with individual risk tolerance before entering trades.
Long Trade in an Uptrend
Analysis
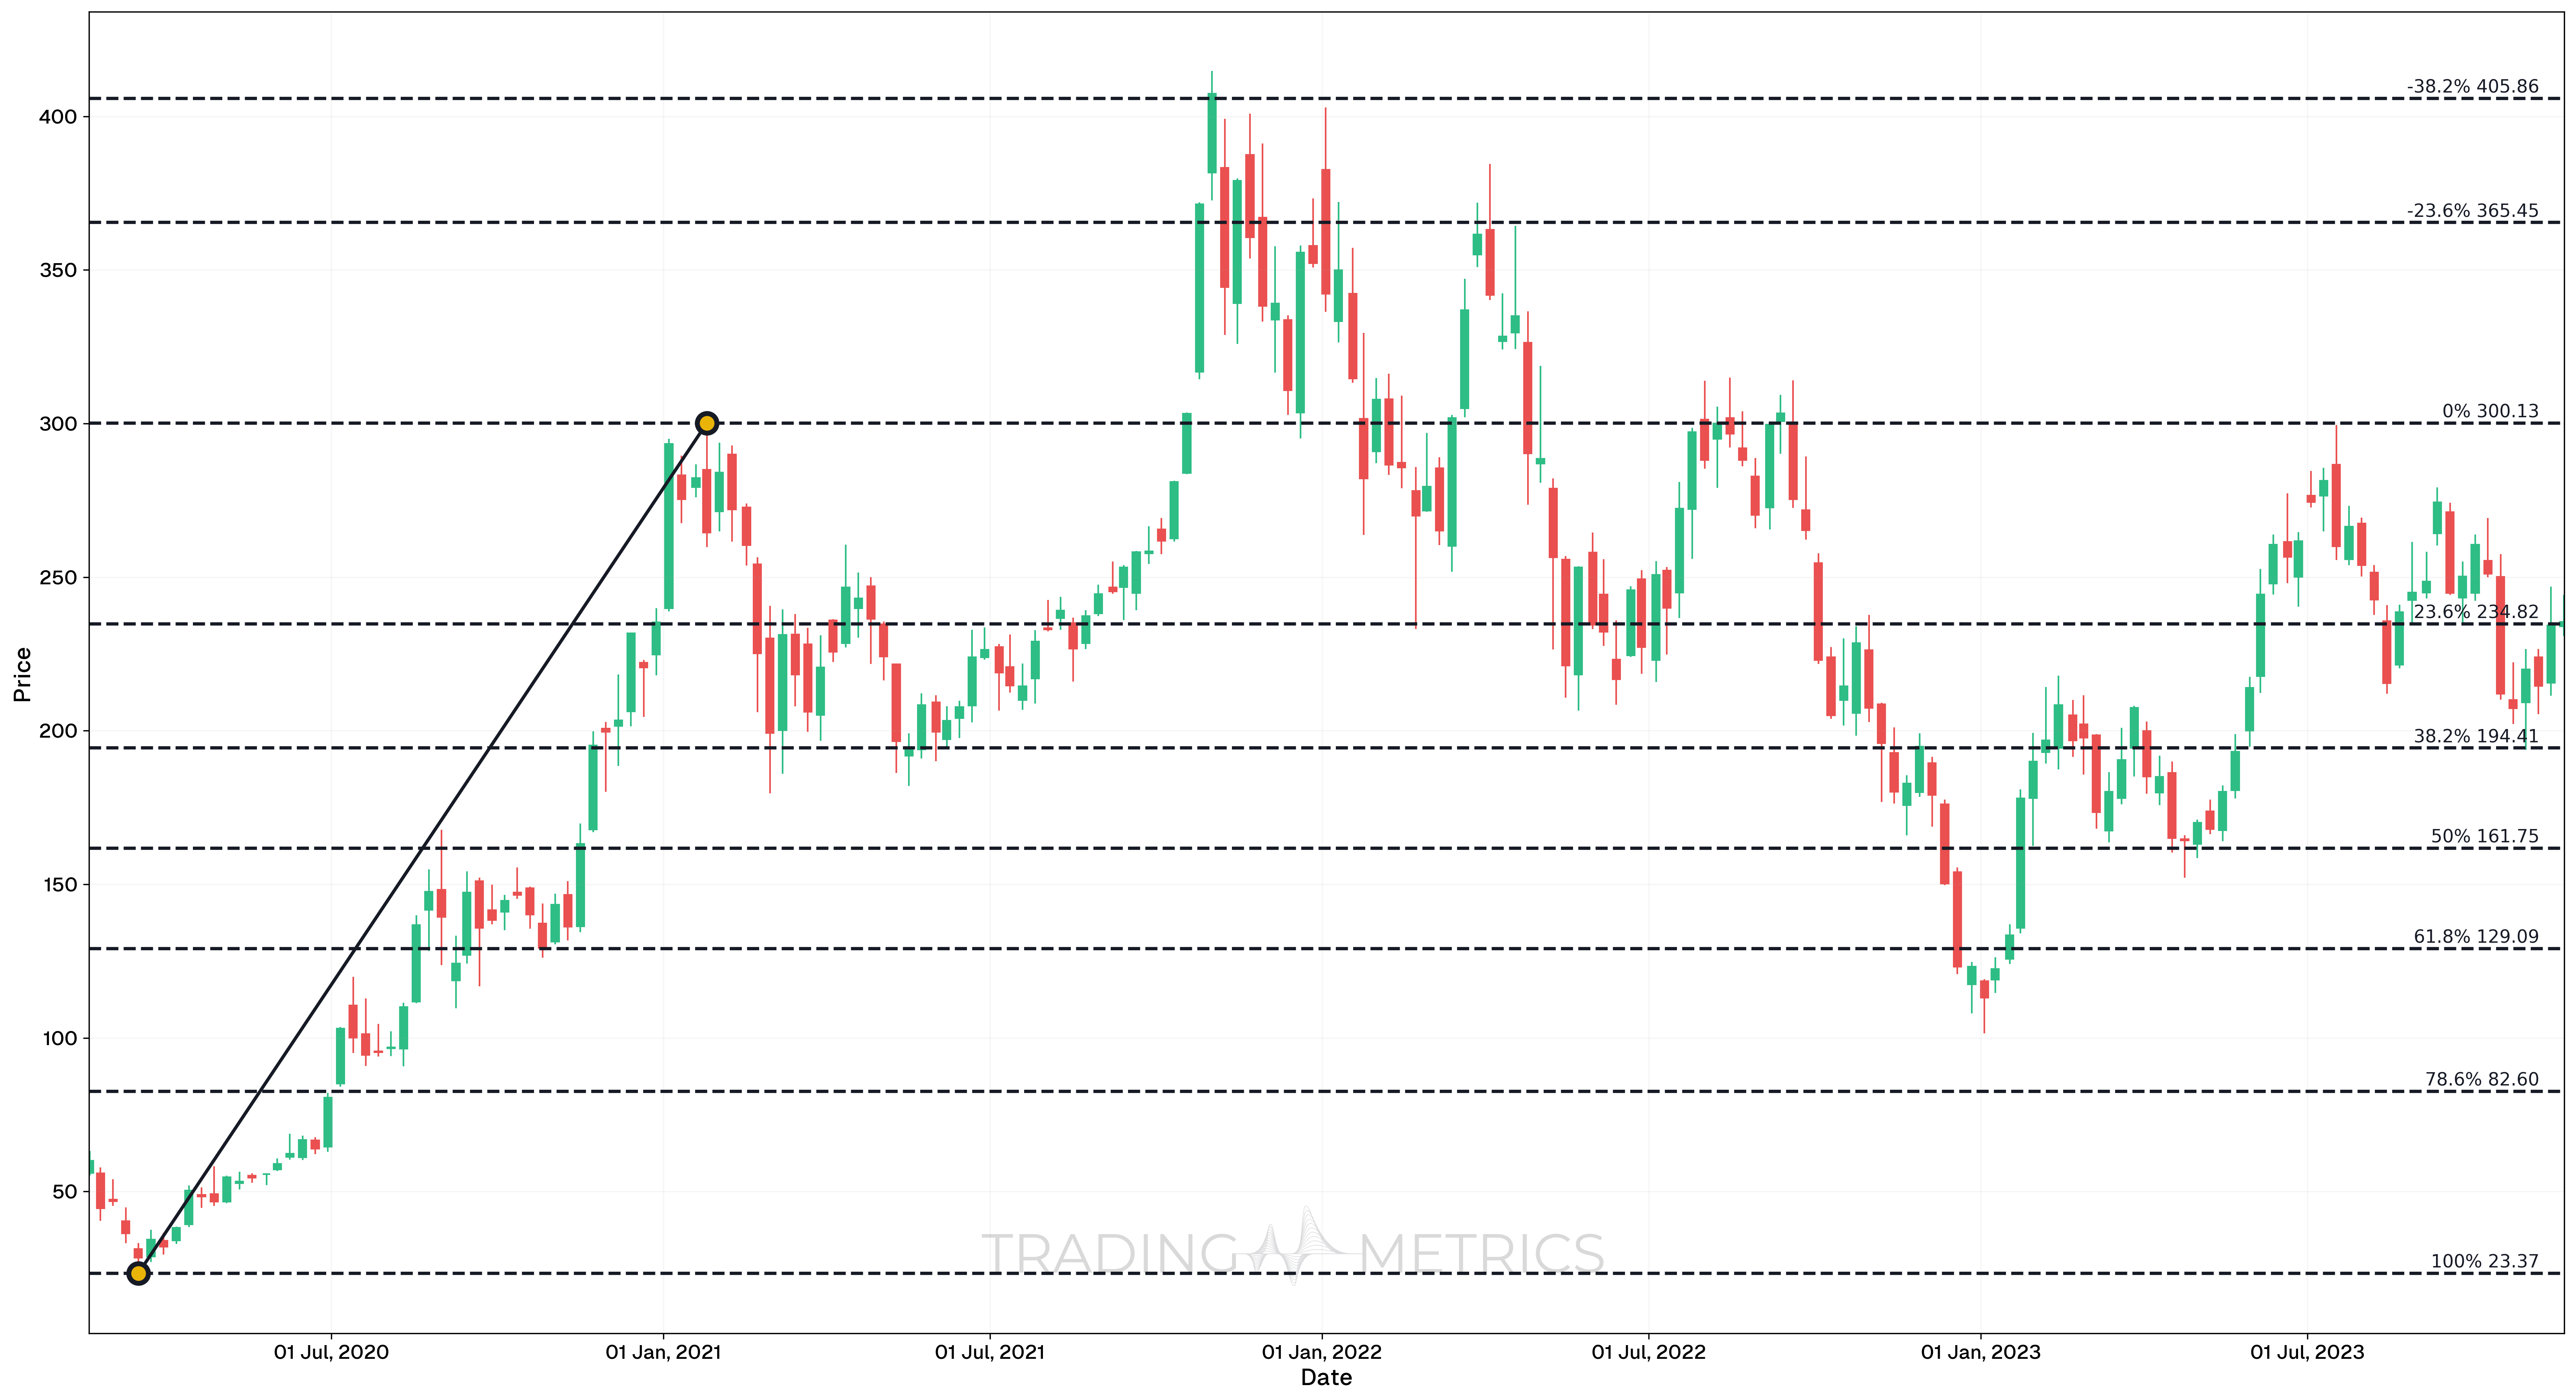
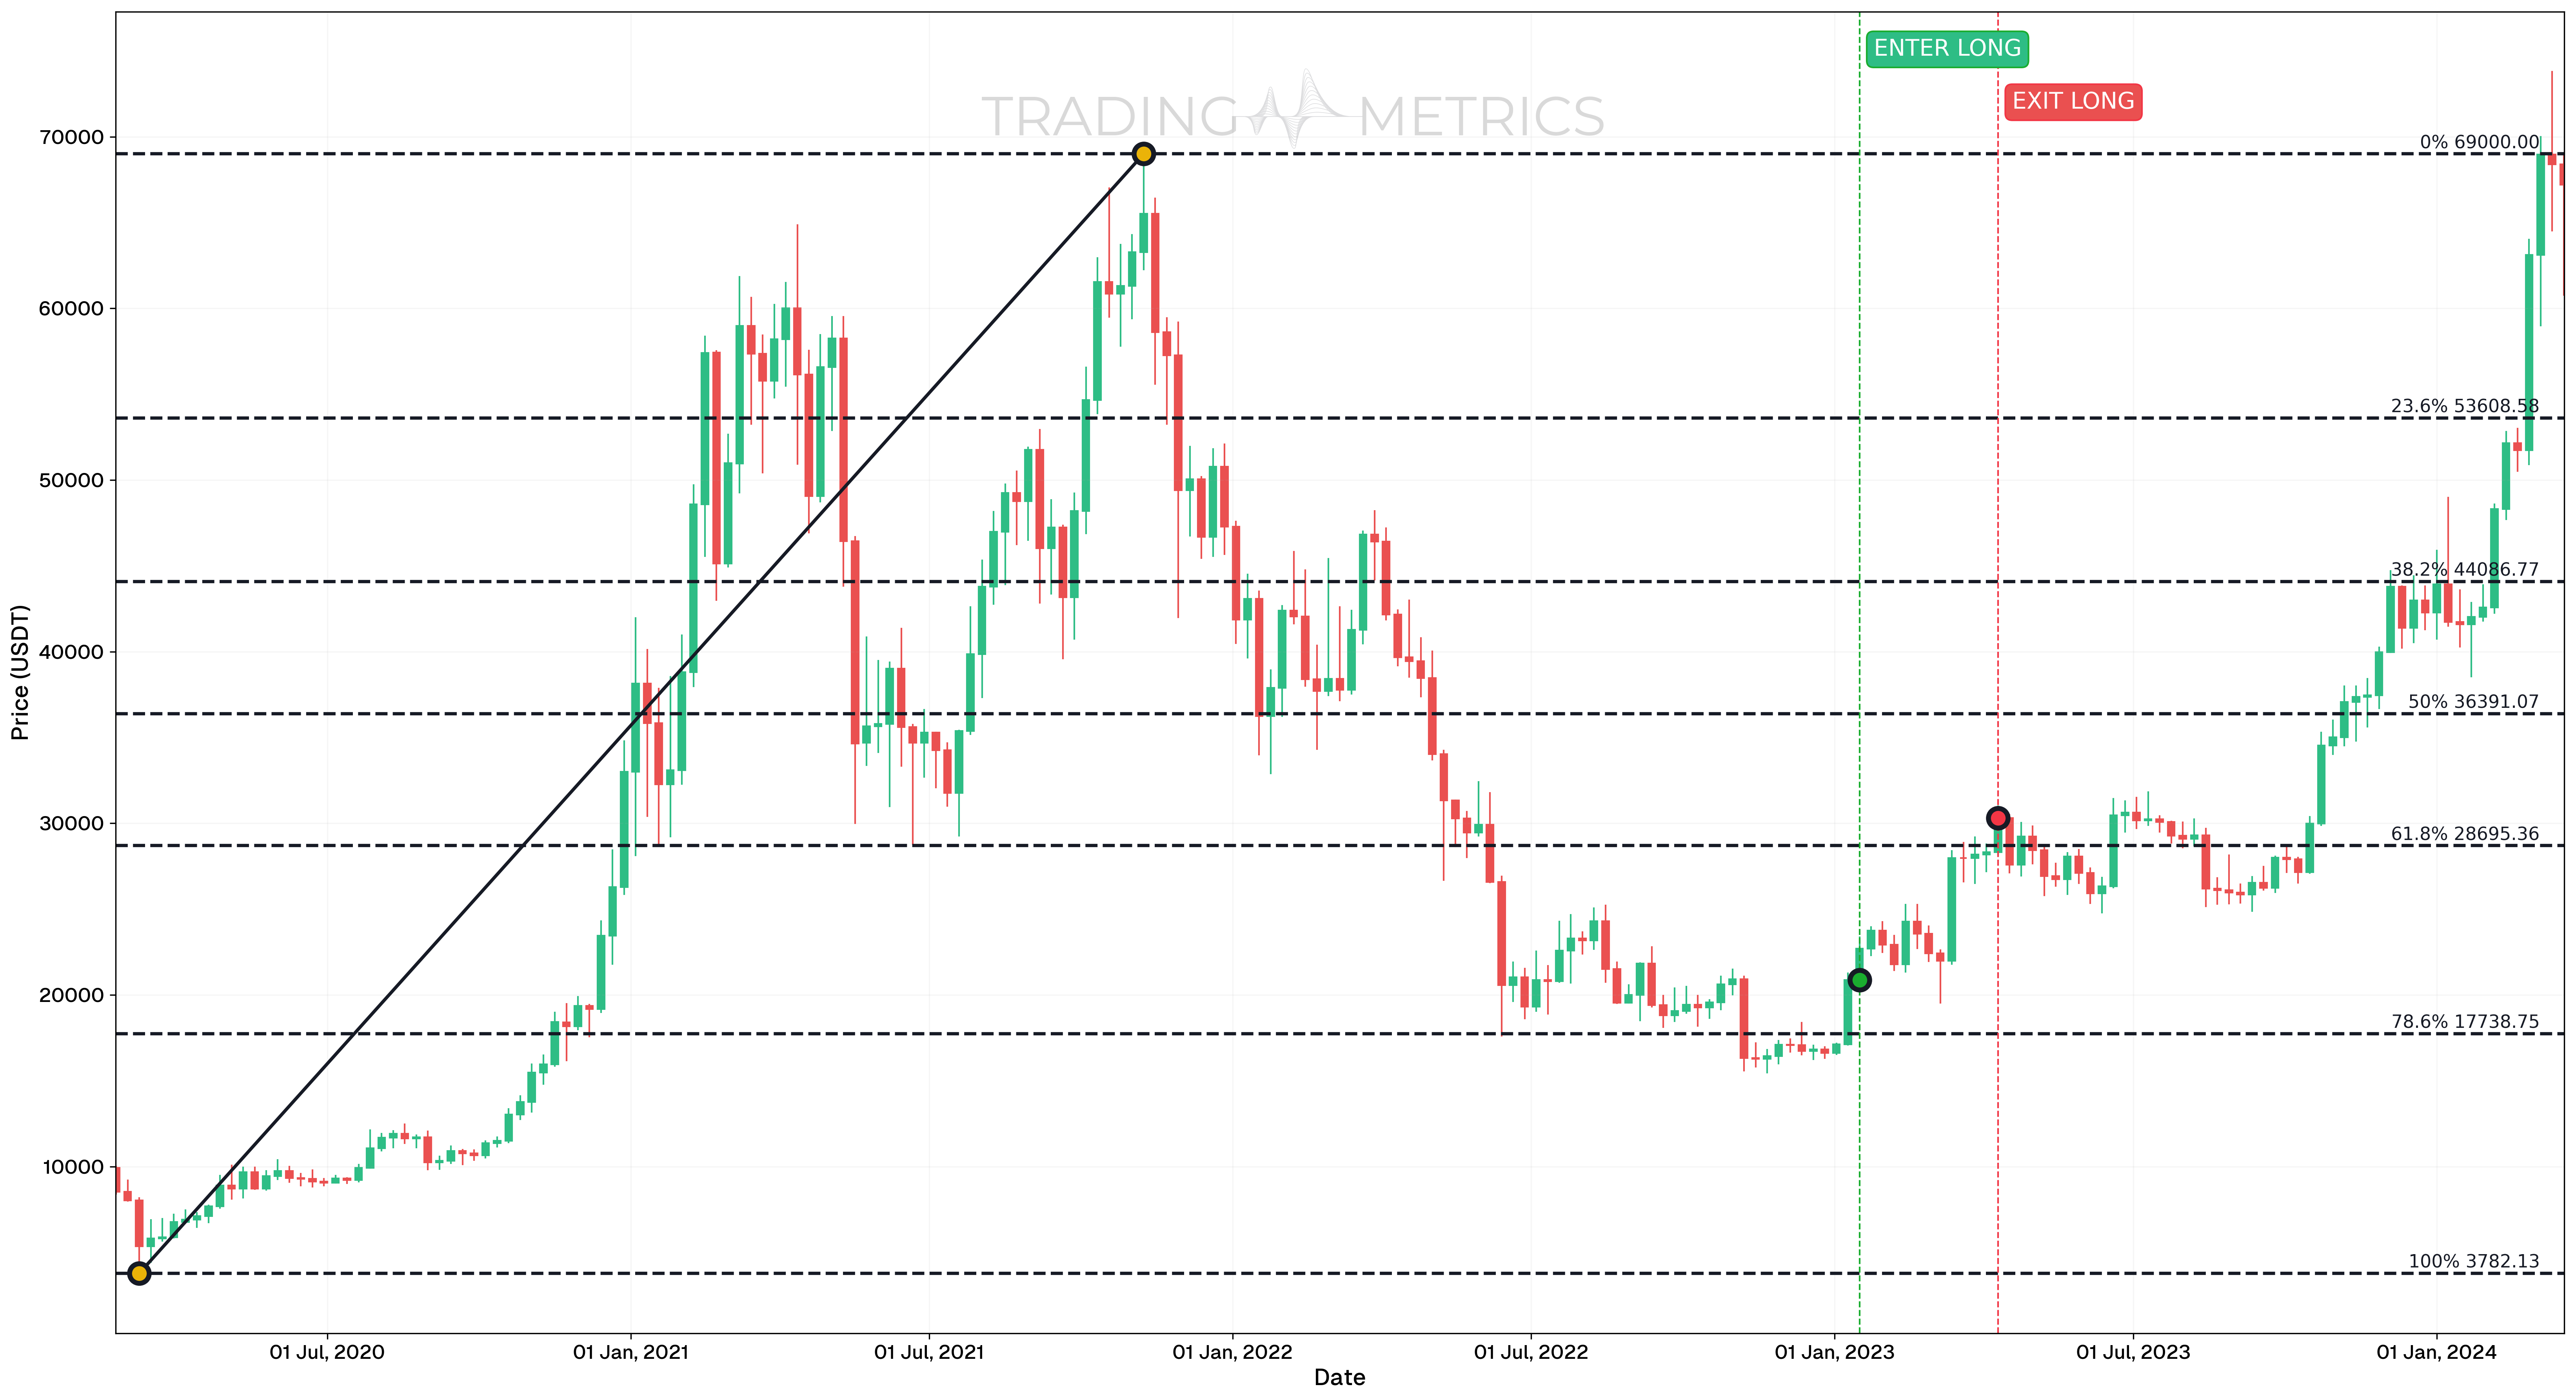
- On March 16, 2020, a long trade setup was identified at the 78.6% Fibonacci retracement level, drawn between the low on March 9, 2020 and the high on November 8, 2021.
- For a more cautious approach, traders could wait for a candle close above the 78.6% Fibonacci level before entering the trade.
- Analyzing larger timeframes for trend context and zooming into smaller timeframes for precise entries was key to optimizing this trade setup.
Trade Setup
-
Entry: Enter at the 78.6% Fibonacci retracement level or upon confirmation of a candle close above it.
-
Exit: Target successive Fibonacci retracement levels moving upward, depending on your strategy and risk tolerance. Exit Points:
- April 10, 2023: 38.2% Fibonacci level.
- November 6, 2023: 50% Fibonacci level.
- February 5, 2024: 38.2% Fibonacci level.
- February 26, 2024: 23.6% Fibonacci level.
- March 25, 2024: 0% Fibonacci level.
-
Outcome:
- The price moved beyond the 38.2% Fibonacci level, offering significant profit opportunities.
- Exiting partially at each Fibonacci level allowed traders to lock in gains incrementally, while more aggressive traders could target higher levels for greater returns.
Risk Management
- Stop-Loss Placement: The stop-loss was set at 17,738.75, corresponding to the 78.6% Fibonacci retracement level. This level was chosen based on its alignment with the established retracement structure, providing a logical protective point against unexpected market reversals.
- Position sizing: Maintain a consistent risk exposure, typically set at 1-2% of trading capital, calculated based on the distance between the entry point and the stop-loss level.
- Risk-Reward Analysis: Aim for a minimum 1:3.01 Risk-Reward Ratio, aligning with the Fibonacci retracement strategy’s potential to capture significant uptrend movements while maintaining controlled risk.
- Monitoring Market Conditions: Monitor price action around Fibonacci levels to identify potential reversals or continuation patterns. Adjust the stop-loss if necessary, especially if new support/resistance zones develop.
- Adjusting stop-loss: If the price action continues to respect Fibonacci levels and the uptrend structure remains intact, consider trailing the stop-loss to lock in gains while allowing the trade room to develop further.
Conclusion
This trade highlights the importance of using Fibonacci levels to identify entry and exit points while adapting strategies to individual risk tolerance and profit goals. Employing larger timeframes for context and smaller timeframes for precision increases the likelihood of success.
Short Trade in an Uptrend
Analysis
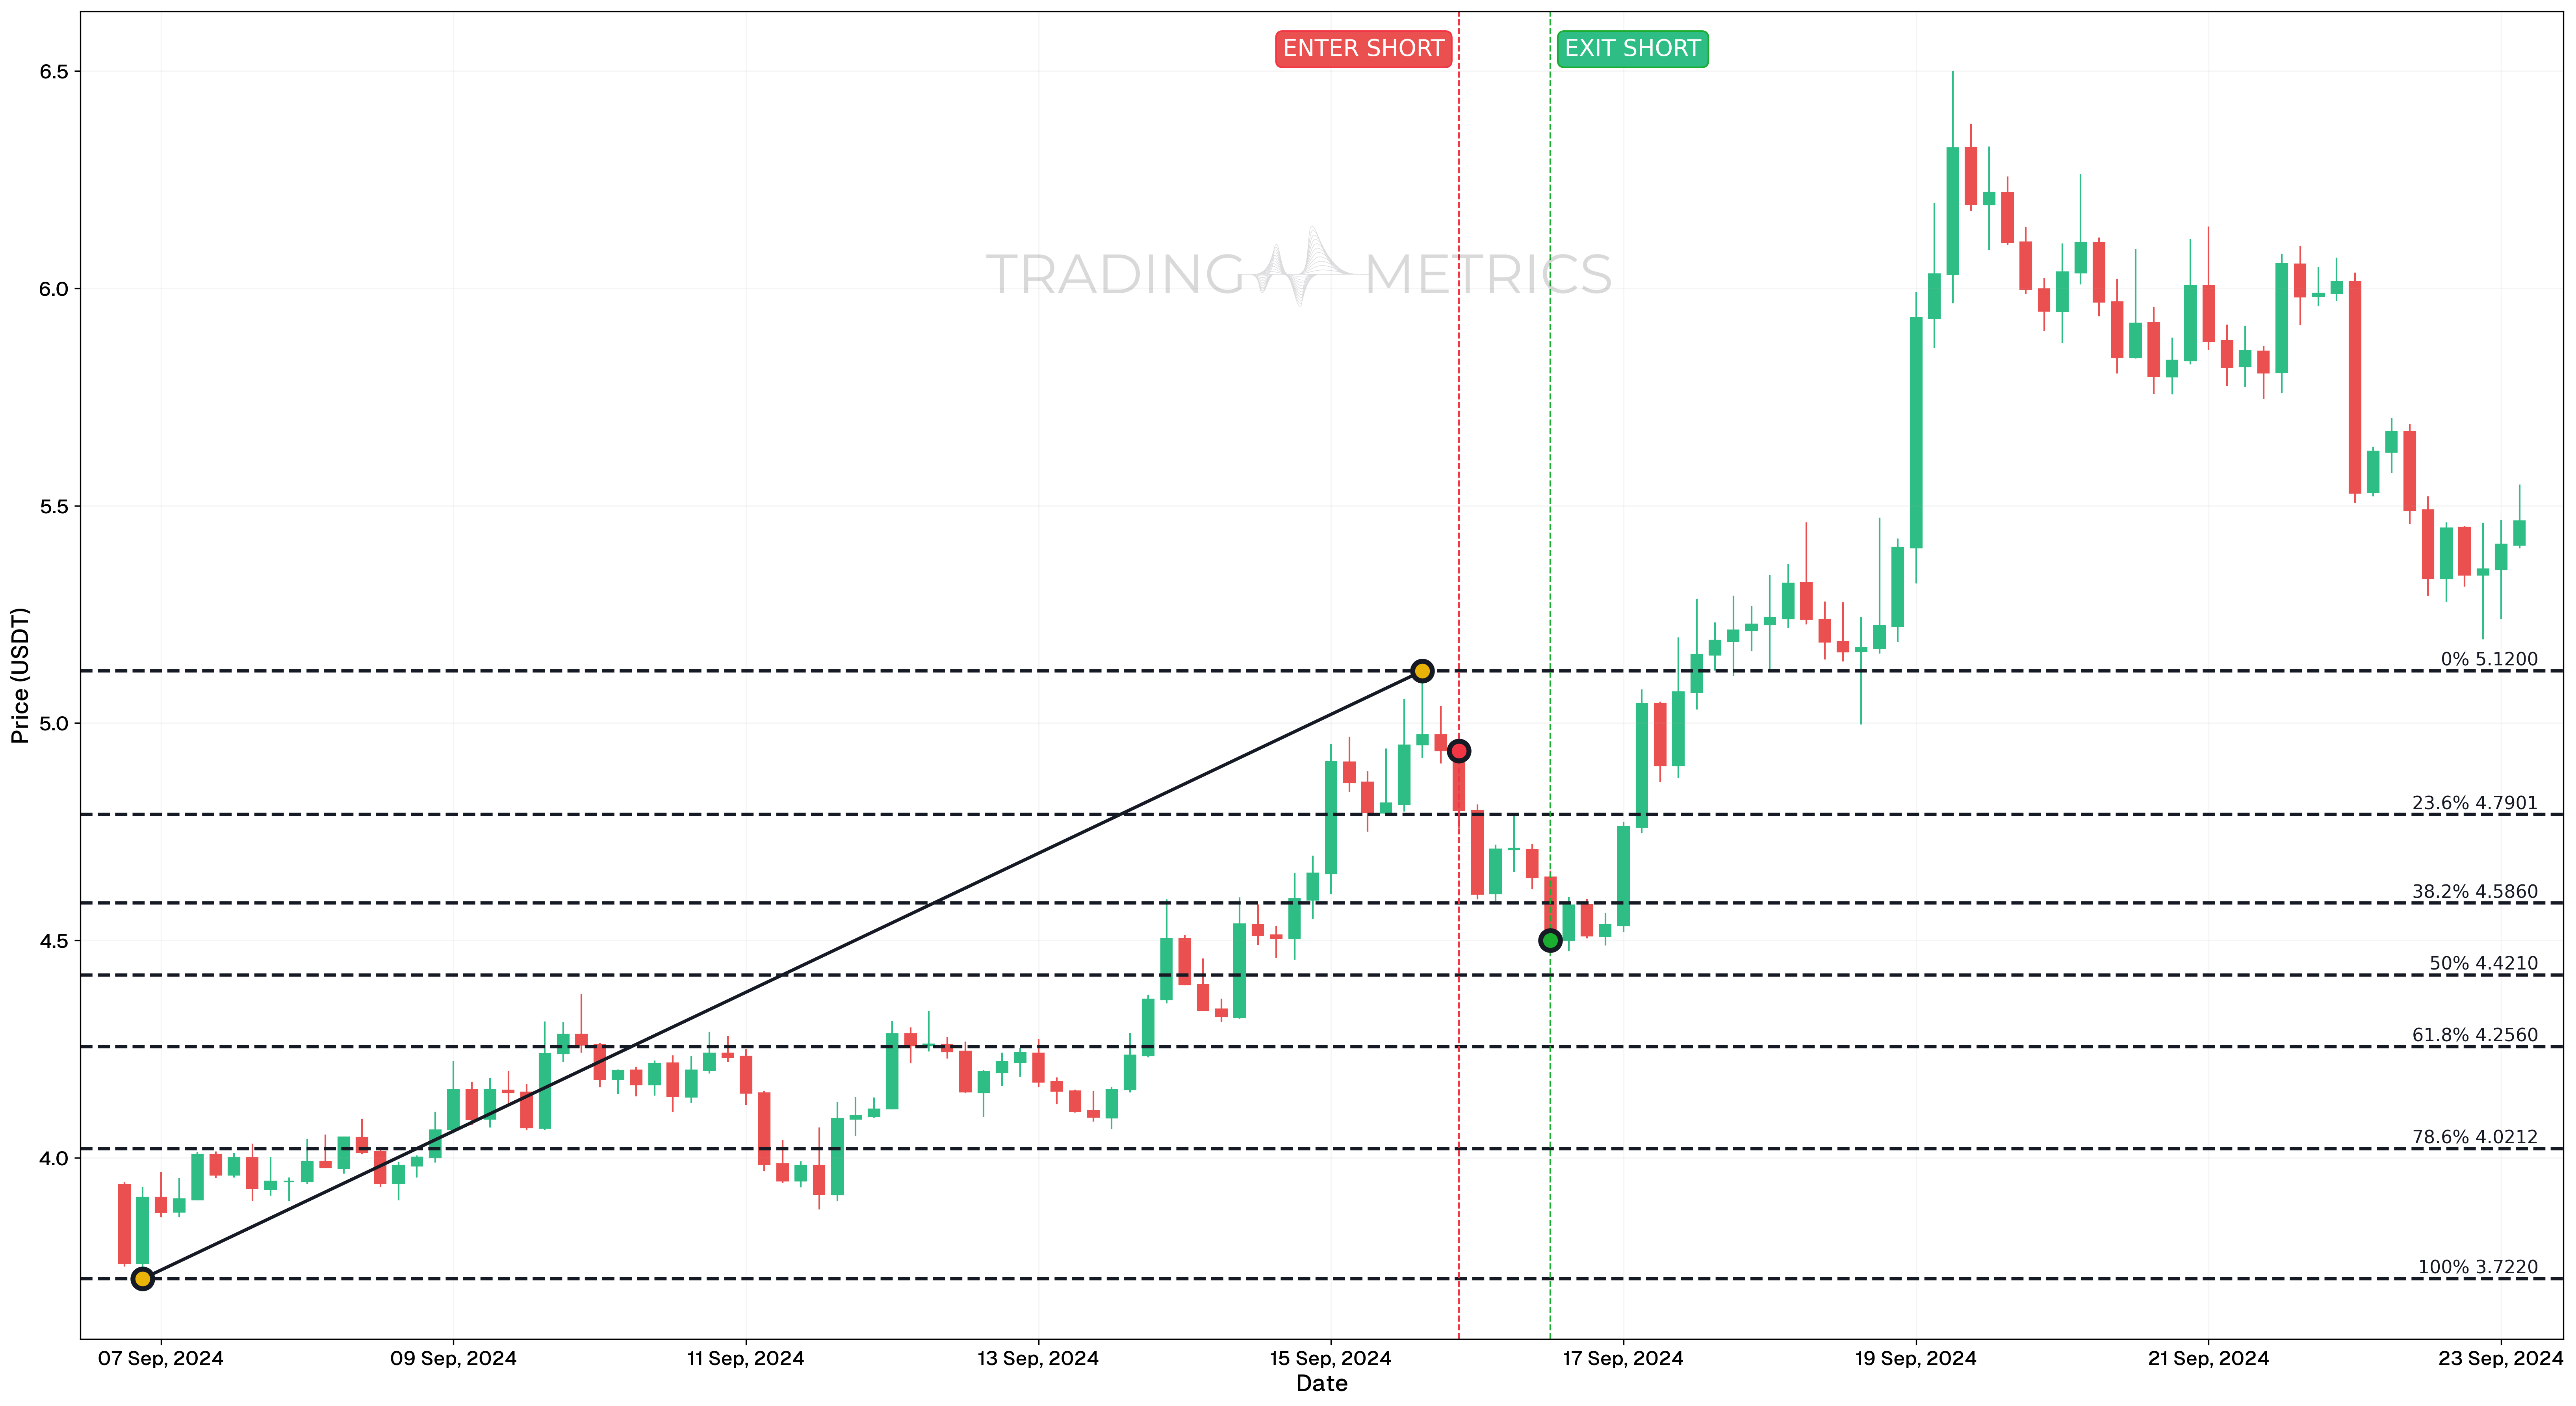
- On September 15, 2024, at 21:00, a short trade entry was identified based on the formation of a shooting star candle. This pattern suggests a potential reversal in market sentiment, indicating downward price movement.
- The Fibonacci retracement tool was applied after the shooting star formation to project potential price targets during the anticipated downtrend.
- The range for this analysis spans from the low on September 6, 2024, at 21:00 to the high on September 15, 2024, at 15:00.
Trade Setup
- Entry: Enter a short trade upon the confirmation of the shooting star candle on September 15, 2024, at 18:00.
- Exit: The target is set at the 38.2% Fibonacci retracement level, a commonly used profit target during pullbacks in a downtrend.
- Outcome: This setup reflects the importance of using candlestick patterns like the shooting star in conjunction with tools like Fibonacci retracement to identify precise entry and exit levels. Aligning these tools ensures a structured approach to targeting profits in a downtrend.
Risk Management
- Stop-Loss Placement: The stop-loss was set at 5.4376. This level was selected to limit potential losses in case the anticipated downward move fails to materialize.
- Position sizing: Maintain a risk exposure of 2% of total trading capital for this trade. Calculate the position size based on the distance from the entry point to the stop-loss level to ensure risk remains controlled.
- Risk-Reward Analysis: 1.15:1 Risk-Reward Ratio, targeting the 38.2% Fibonacci level as the profit-taking point while maintaining a defined stop-loss.
- Monitoring Market Conditions: Given the context of a shooting star pattern and a retracement setup, monitor for any potential reversals or bullish signals that could indicate a trend shift against the short position.
- Exiting the Trade: If the stop-loss is hit, reevaluate the setup for potential re-entry or confirmation of the trend shift. Stay vigilant for any conflicting signals that could invalidate the short setup.
Focus on the Golden Ratio: The 61.8% level, also known as the golden ratio is a significant zone for potential price reversals or trend continuation.
Fibonacci Retracement in Downtrend
In a downtrend, Fibonacci retracement levels are used to find areas where the price might retrace upward before continuing to drop, and Fibonacci extension levels help predict where the price might extend downward.
How to use Fibonacci in a Downtrend:
- Retracement Levels (23.6%, 38.2%, 50%, 61.8%): These act as potential resistance levels when the price retraces upward.
- Extension Levels (127.2%, 161.8%): These can be used as target levels for where the price might fall after continuing its downtrend.
Long Trade in a Downtrend
Analysis
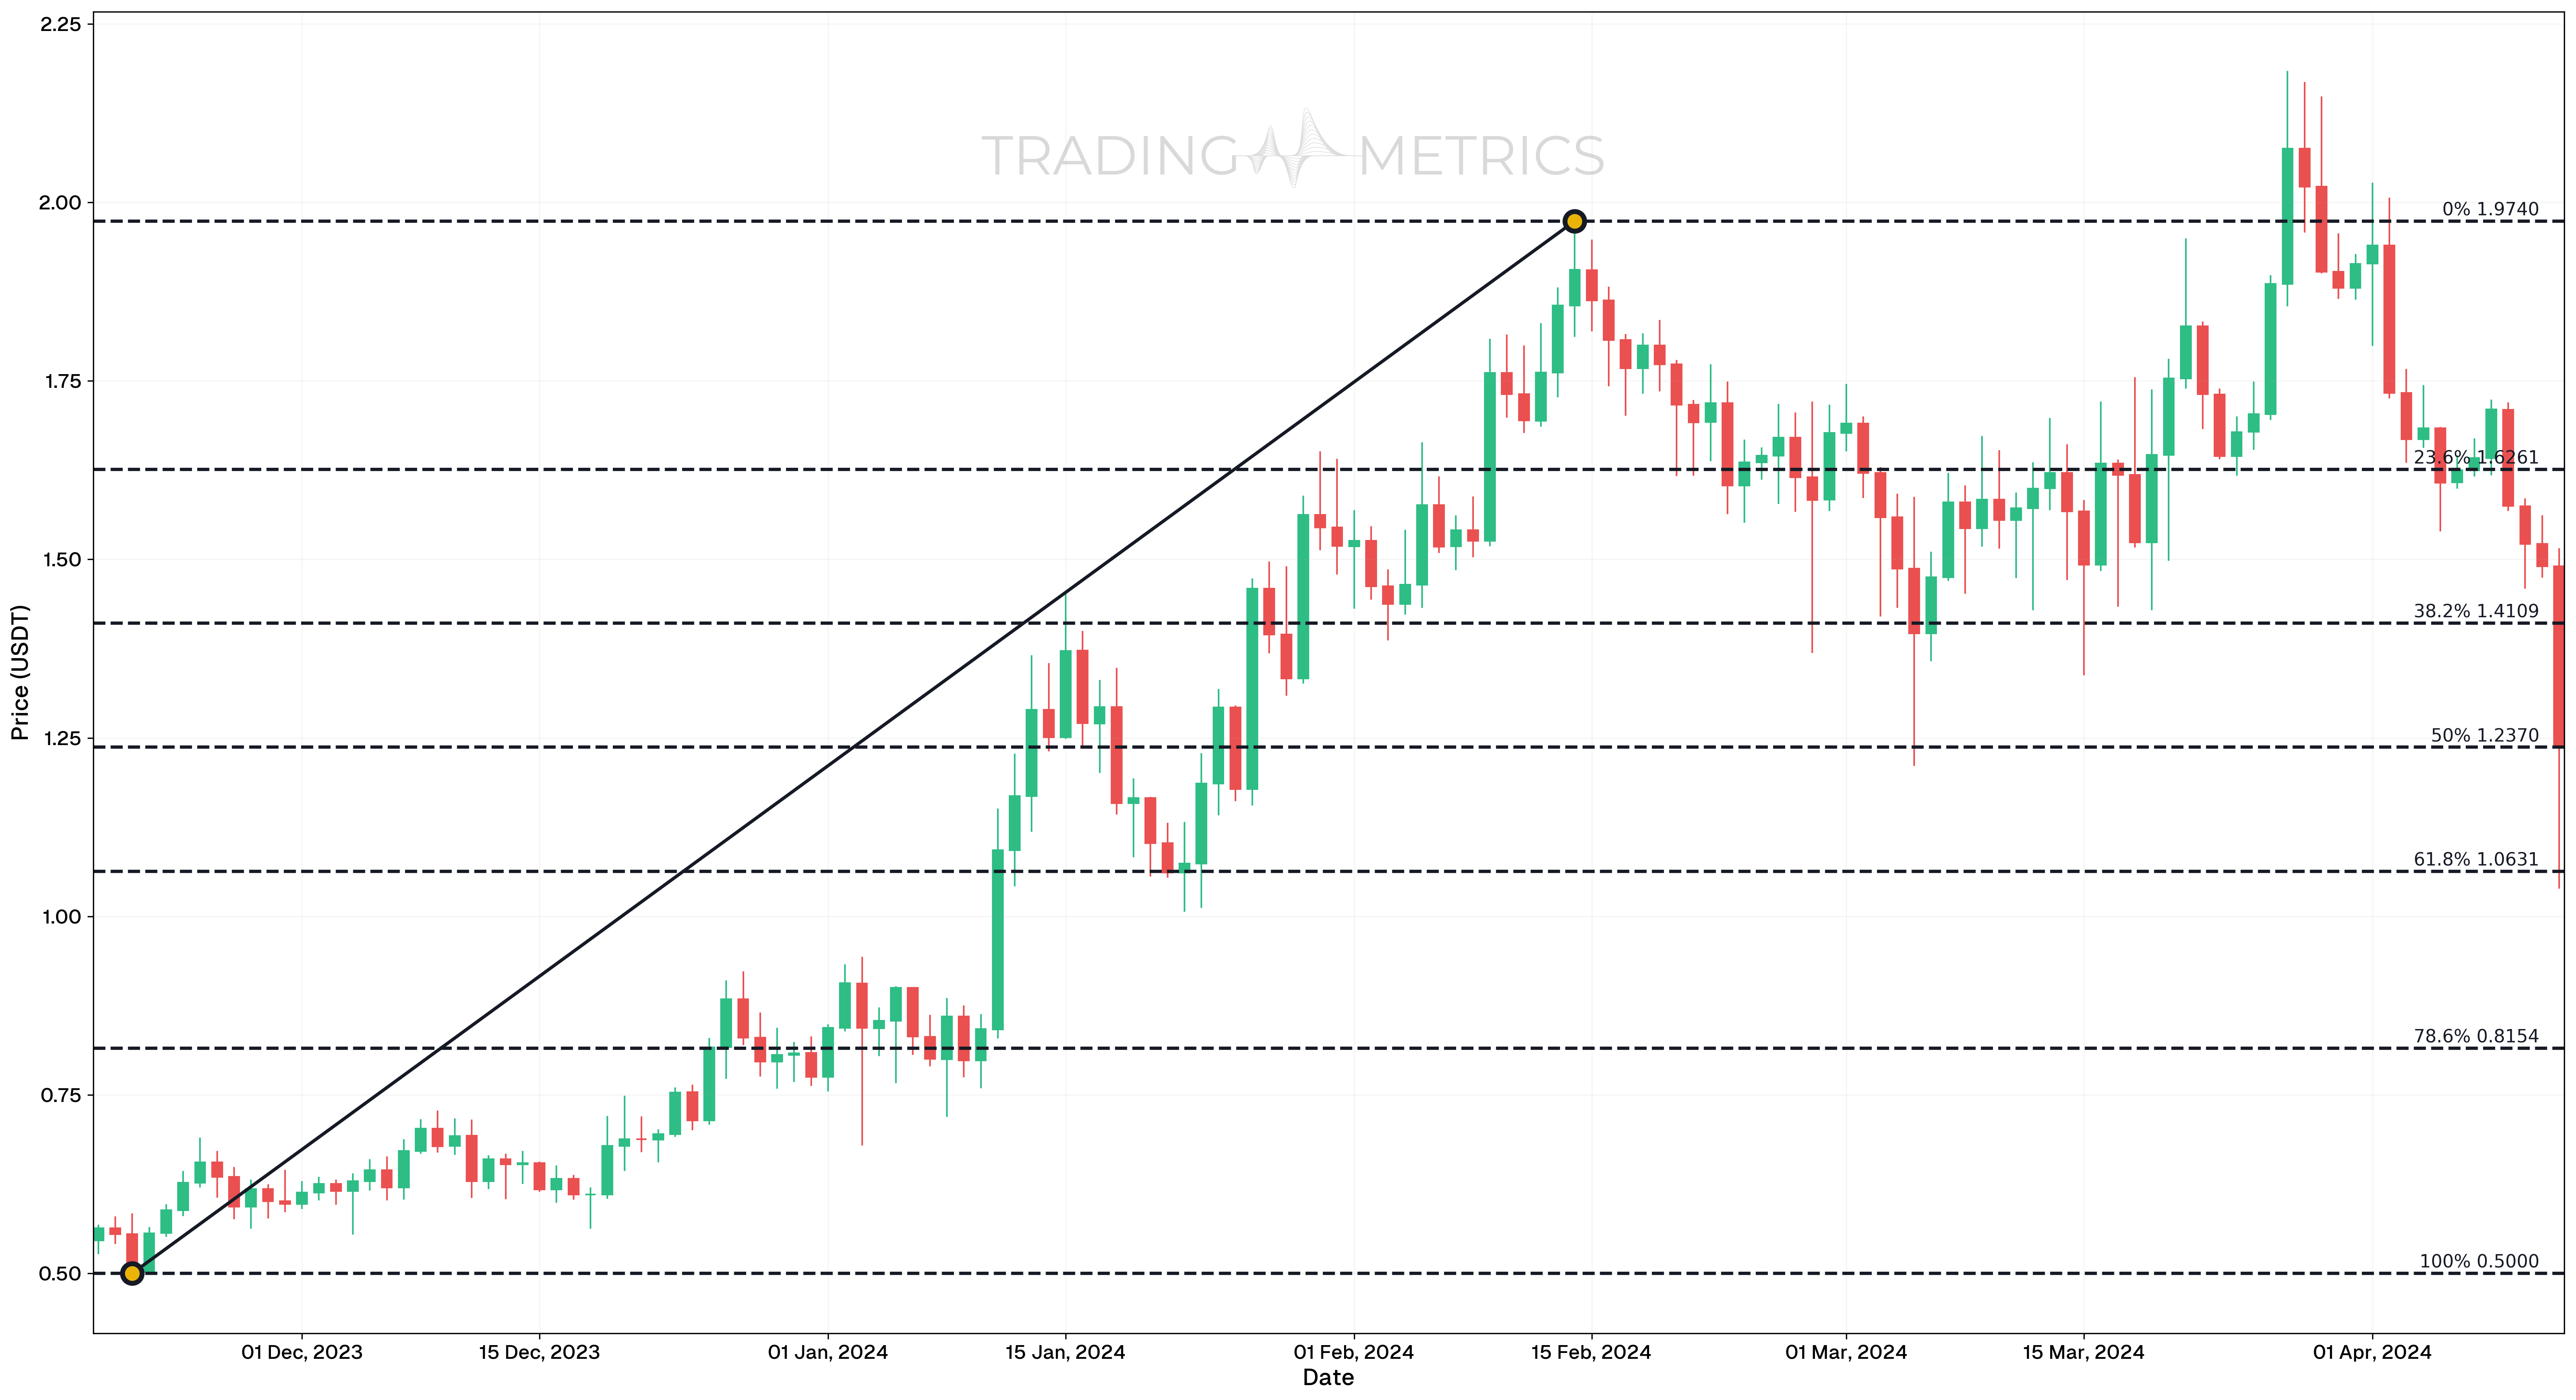
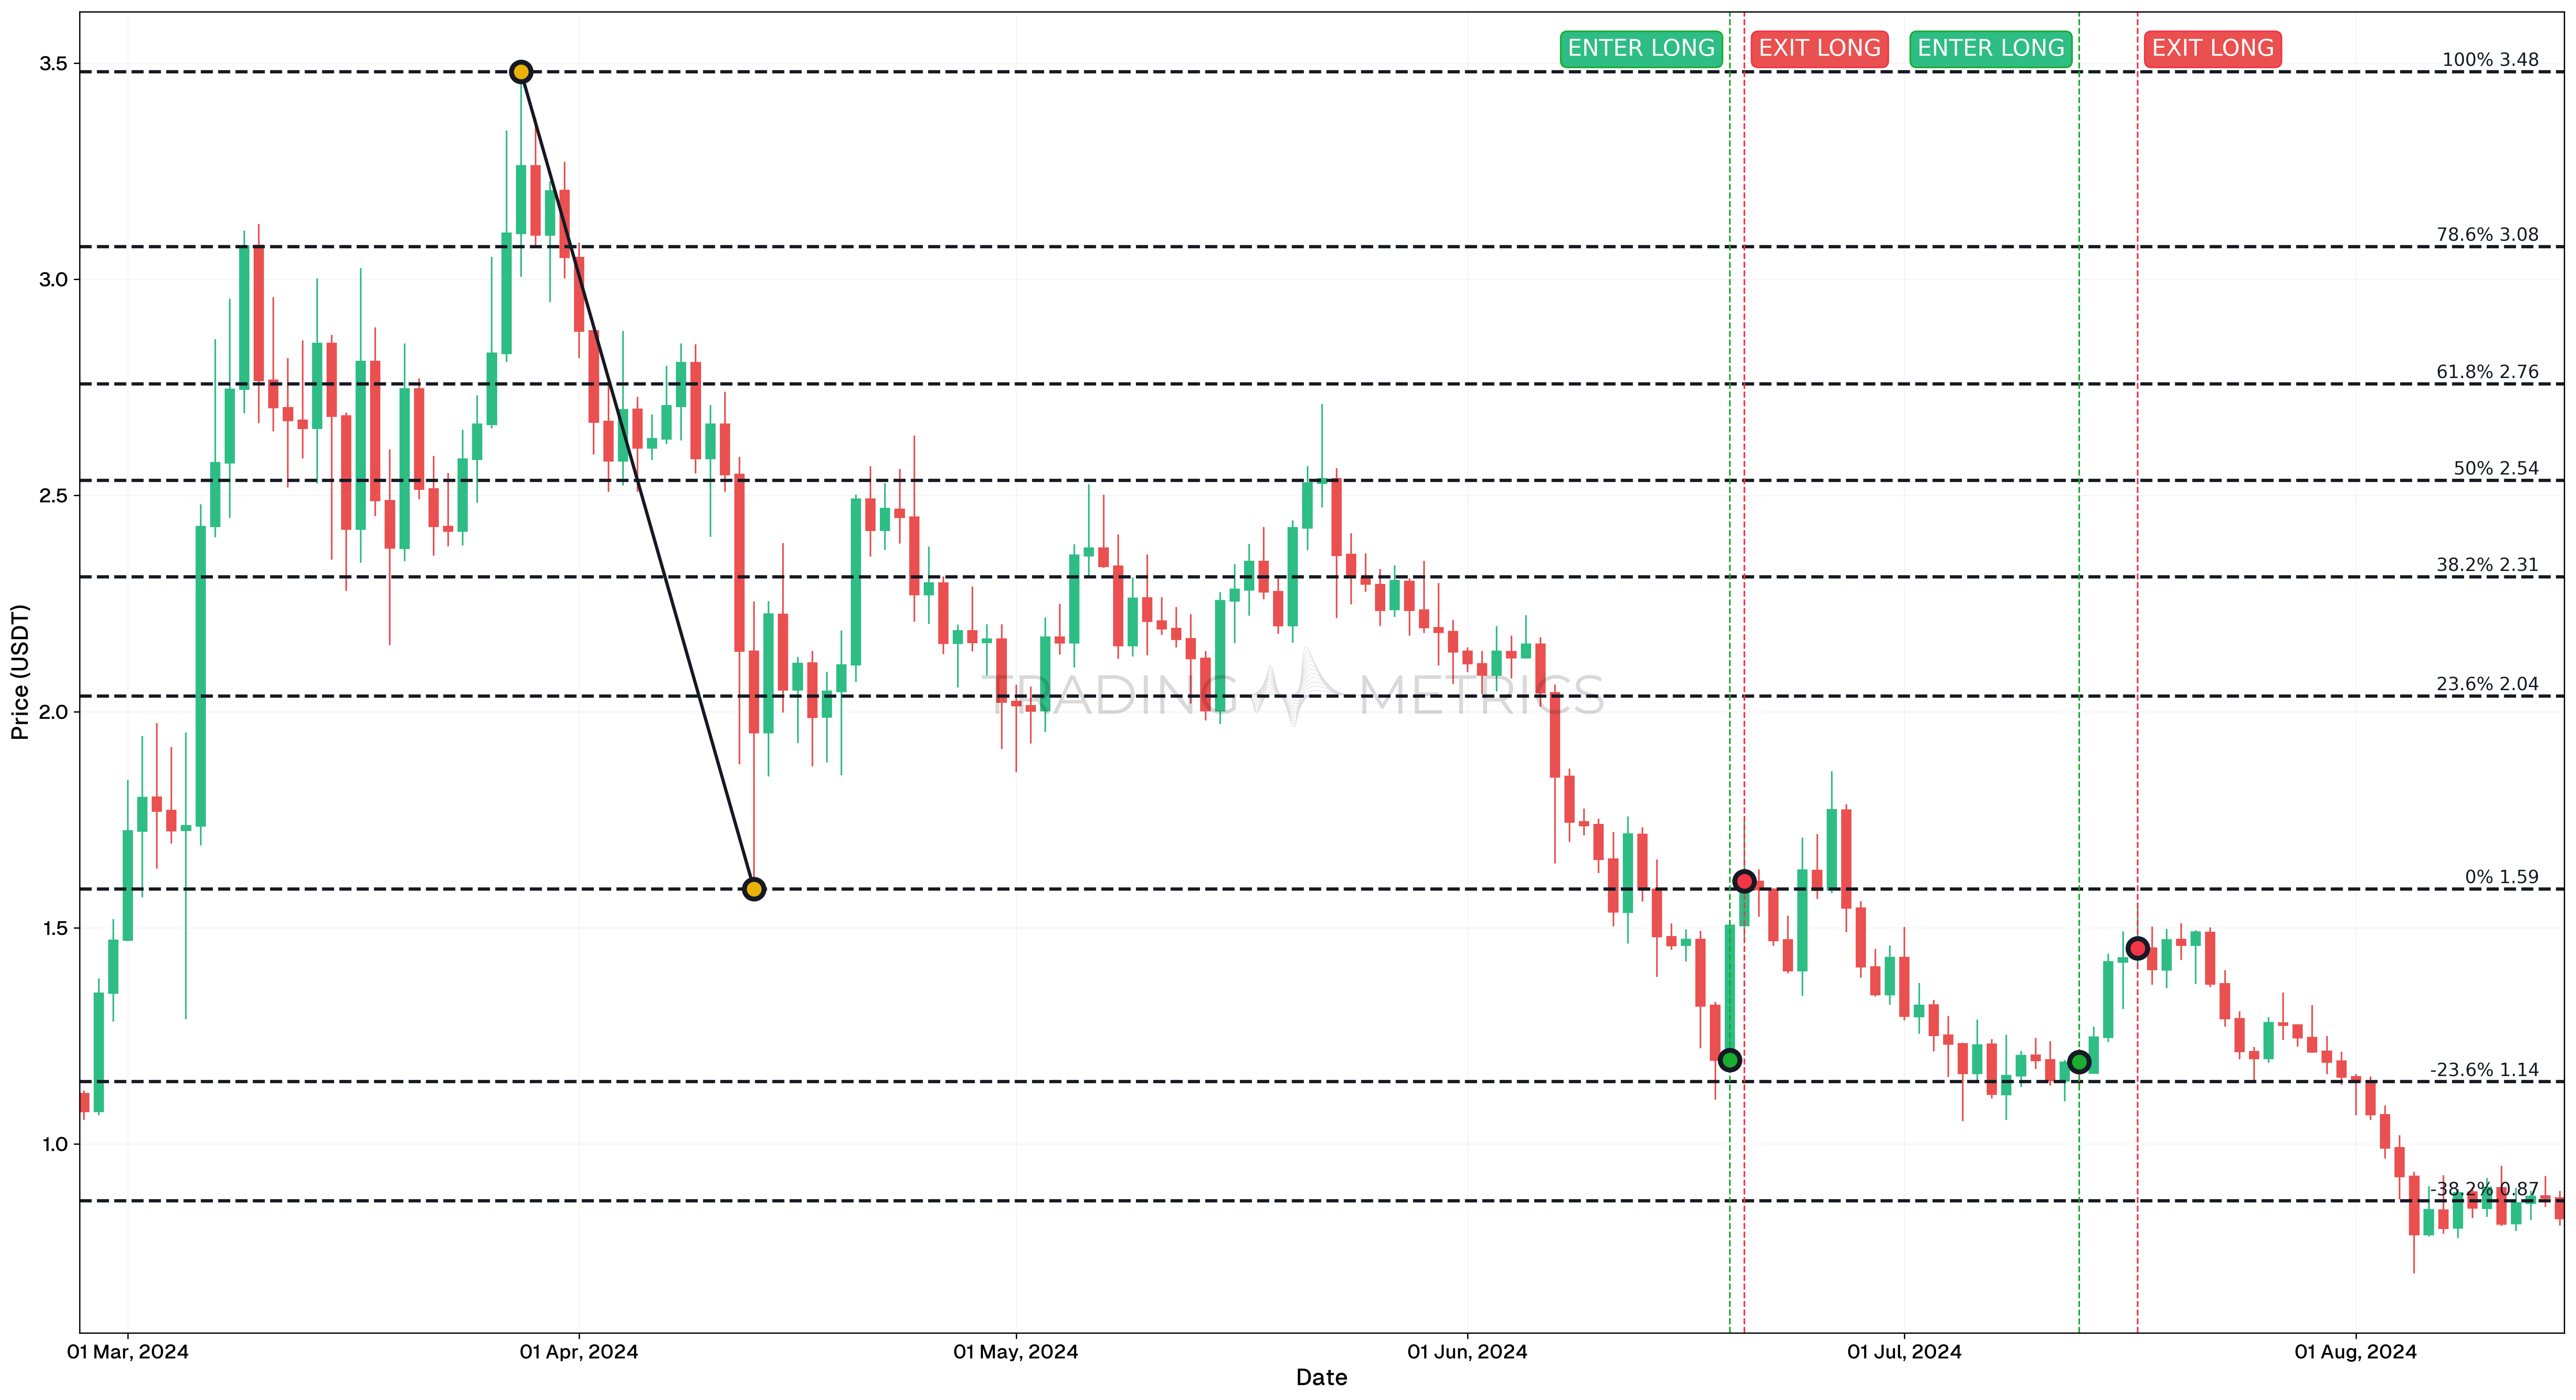
- The FET/USDT Perpetual Contract chart from February 17, 2024 to August 15, 2024 highlights two high-risk, high-reward long trade opportunities during a broader downtrend.
- Both trades utilized Fibonacci retracement levels as entry and exit points, demonstrating their effectiveness even in bearish market conditions.
Trade Setup
-
Trade
- Entry: On June 19, 2024, a long position was initiated at the -23.6% Fibonacci level, a previously tested support area from February 2024.
- Exit: The position was closed on June 20, 2024 at the 0% Fibonacci retracement level, where significant resistance was evident from May 2024 price action.
- Outcome: The trade captured a strong bounce from support to resistance, aligning with the Fibonacci strategy. This approach showcased the importance of identifying key levels in volatile markets.
-
Trade
- Entry: On July 13, 2024, a long position was initiated at the -23.6% Fibonacci level, confirmed by a bullish candle.
- Exit: The position was closed on July 17, 2024, as the price failed to reach the 0 Fibonacci level, prompting a more conservative exit strategy at a smaller bounce.
- Outcome: While less profitable than the first trade, this setup reinforced the need to adapt exit strategies based on evolving price action. The -23.6% Fibonacci level remained a reliable entry zone.
Risk Management
- Stop-Loss Placement: The stop-loss for both trades was strategically placed at -23.6% (1.14), aligning with a previous support level. This level was selected to provide a protective barrier against potential downside moves while allowing the trade room to develop.
- Position sizing: Maintain risk exposure to 2% of the trading capital, ensuring consistent risk management across both trades. Calculate position size based on the distance between the entry point and the predefined stop-loss.
- Adjusting stop-loss: If price action approaches the 0% Fibonacci level without showing signs of reversal, consider adjusting the stop-loss to breakeven to mitigate potential losses.
- Monitoring Market Conditions: Pay attention to volume and Candlestick Patterns near key Fibonacci levels. A high-volume breakout against the position may warrant an early exit to protect capital.
Short Trade in a Downtrend
Analysis
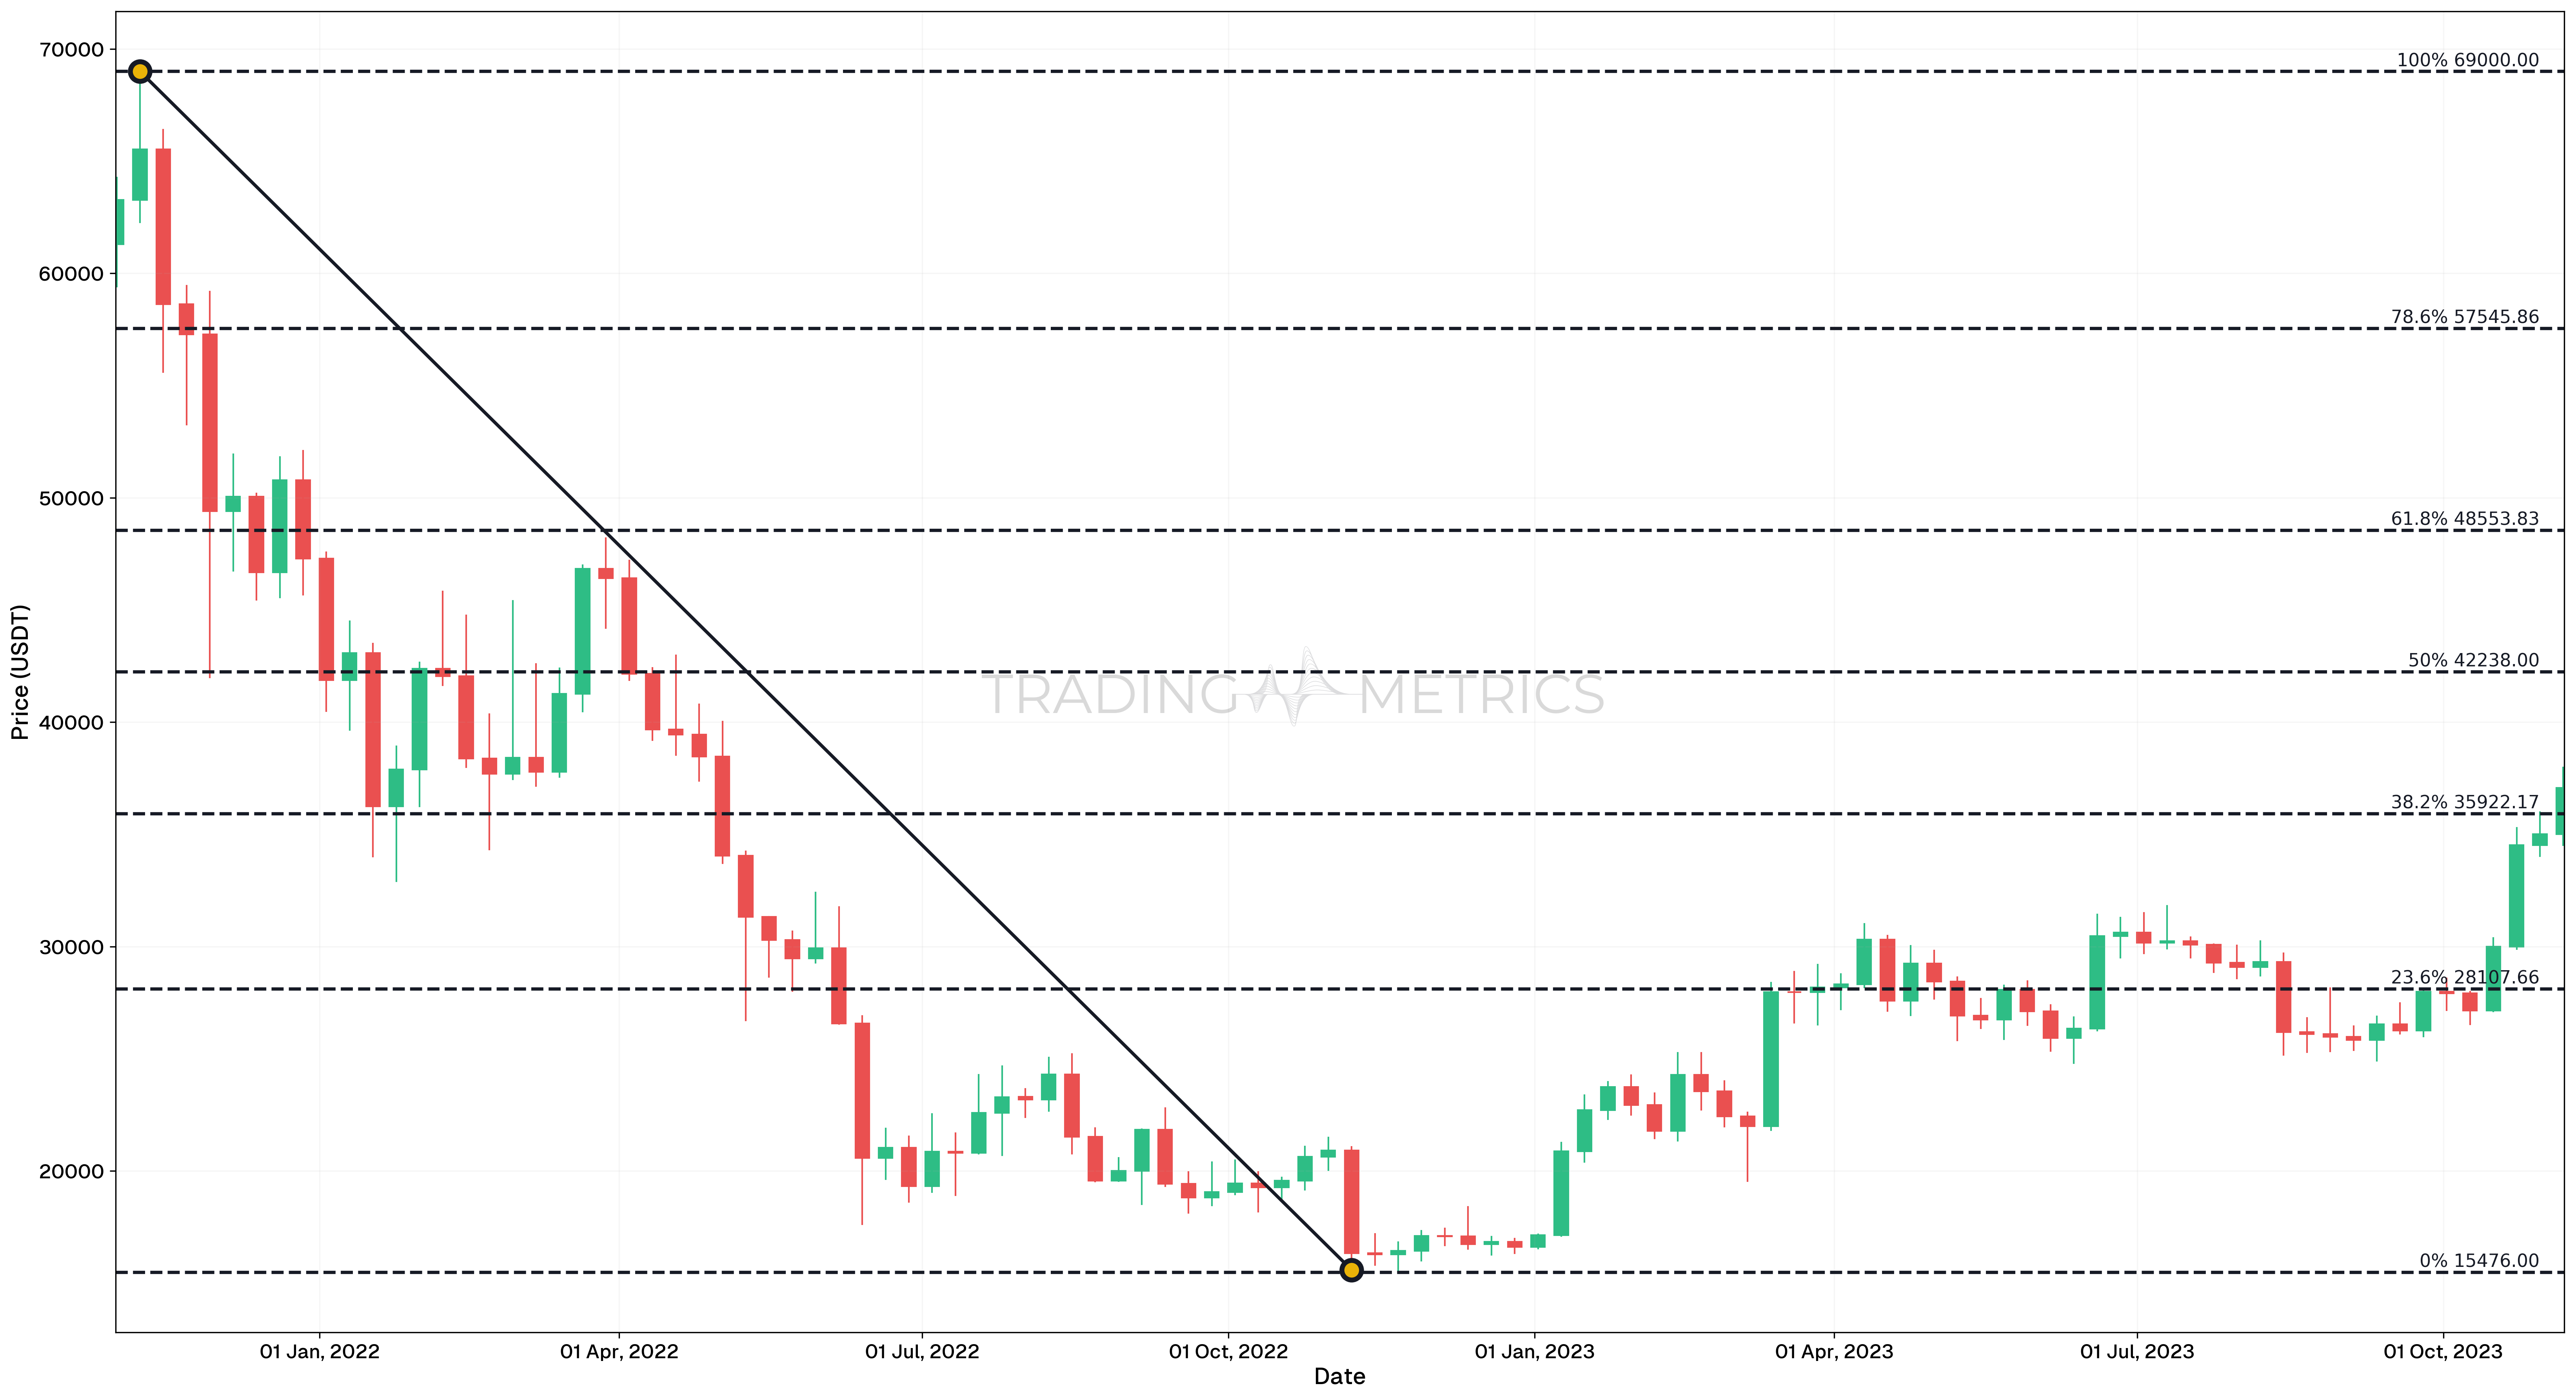
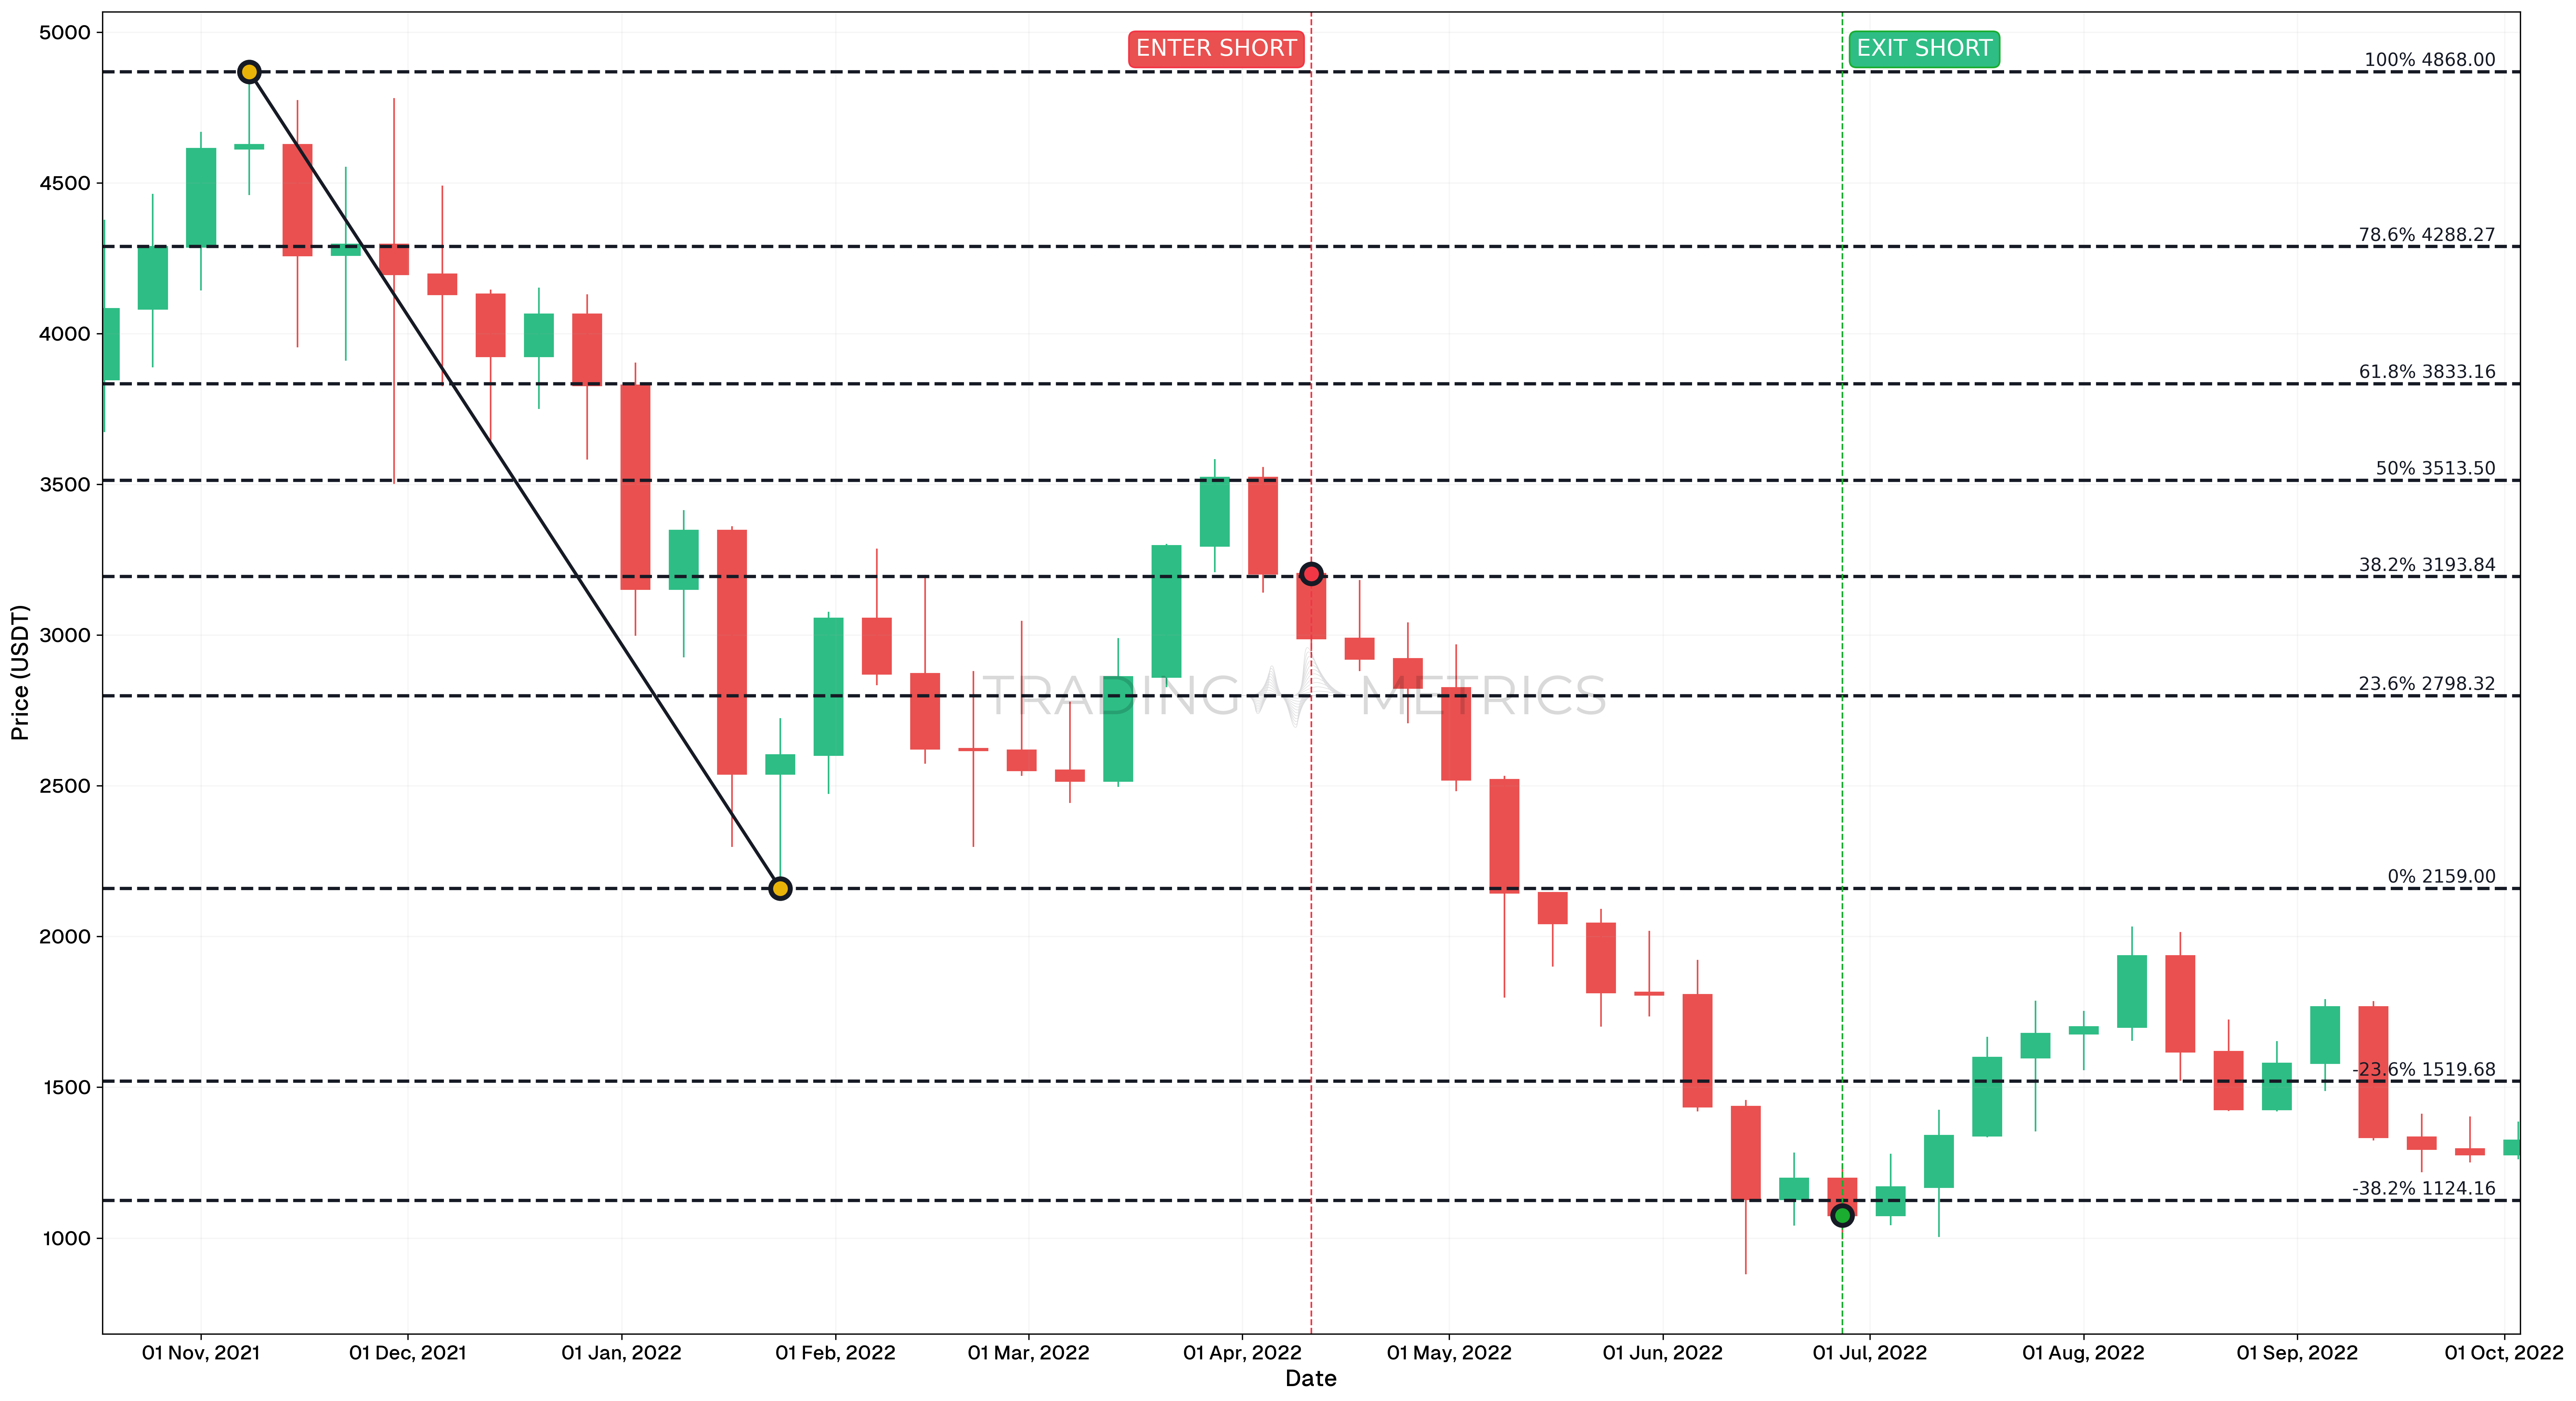
- The ETH/USDT chart from October 18, 2021 to october 3, 2022 highlights a well-executed short trade during a sustained downtrend.
- This trade leveraged Fibonacci retracement levels and the 55-week moving average to identify entry and exit points, demonstrating the effectiveness of combining technical indicators with price action.
Trade Setup
-
Entry: On April 11, 2022, a short position was initiated as the price hit the 38.2% Fibonacci retracement level and decisively broke below the 55-week moving average. This confirmed a strong bearish momentum and provided a high-probability short entry.
-
Exit: The position was closed on June 27, 2022 at the -38.2% Fibonacci level after observing the first green candle following a series of red ones. This indicated a potential shift in market momentum. Additional exit points were considered along the way:
- Fibonacci level: 0% on May 9, 2022.
- Fibonacci level: -23.6% on June 13, 2022.
- Fibonacci level: -38.2% on June 27, 2022.
-
Outcome: This short trade capitalized on bearish momentum while allowing flexibility in exit strategy based on risk tolerance. Gradual profit-taking at Fibonacci levels or holding for larger gains were both viable approaches.
Risk Management
- Stop-Loss Placement: The stop-loss level is set at 61.8% (3345.18), aligning with the Fibonacci retracement level. This level serves as a protective barrier against unexpected market reversals, allowing the trade to remain active while maintaining risk control.
- Position sizing: Maintain a risk exposure of 1-2% of trading capital, calculated based on the distance between the entry point and the 61.8% Fibonacci retracement level. Adjust position size accordingly to ensure adequate risk management.
- Risk-Reward Analysis: Target a minimum 1:14.97 Risk-Reward Ratio, utilizing the Fibonacci extension levels as potential exit points to align profit-taking with risk tolerance.
- Monitoring Market Conditions: Pay attention to volume and Candlestick Patterns around the 61.8% retracement level. A breakout or sustained close above this level may invalidate the trade, warranting an exit to protect capital.
- Trailing stop-loss: As the price progresses towards the targeted Fibonacci extension levels, consider adjusting the stop-loss to lock in profits while still allowing the trade to capture further downside momentum.
- Trade Review and Adjustment: Regularly assess the trade structure and market conditions, especially if the price action consolidates near the stop-loss level. Be prepared to exit early if momentum shifts against the position, limiting potential losses.
Conclusion
- In a downtrend, use retracements (e.g., 38.2% Fibonacci level) as entry points for short trades and extensions (e.g., -38.2% Fibonacci level) as exit points.
- Exit strategies can vary:
- Incremental selling at key Fibonacci levels secures profits progressively.
- Holding positions to higher Fibonacci extensions maximizes potential returns but carries additional risk.
- Combining Fibonacci levels with other indicators, such as the 55-week moving average, strengthens trade signals and improves decision-making.
Monitor Volume: Increased trading volume at Fibonacci levels adds credibility to the potential reversal or continuation move.
Combining Fibonacci Retracement with Other Indicators
Fibonacci retracement becomes even more effective when combined with other technical indicators. Here are some common combinations used by traders:
- Moving Averages: When a Fibonacci level aligns with a key moving average, such as the 50-day or 200-day, it strengthens the case for a price reversal at that point. This confluence of signals adds confidence to your trade.
- Relative Strength Index (RSI): If the price reaches a Fibonacci level and the RSI indicates that the asset is overbought or oversold, this alignment can suggest a stronger likelihood of a reversal.
- Candlestick Patterns: Patterns like a Hammer (for support) or a Shooting Star (for resistance) near Fibonacci levels can provide clues about potential reversals, helping traders confirm whether the price will respect the level.
Key Points
- Key Support and Resistance Levels: Fibonacci retracement identifies potential reversal levels based on the Fibonacci sequence, commonly used levels include 23.6%, 38.2%, 50%, 61.8%, and 78.6%.
- Trend Identification: Used within trending markets to find pullback levels where price might reverse or consolidate before continuing in the trend direction.
- Dynamic Levels: Fibonacci retracement levels act as dynamic support or resistance, aiding traders in identifying entry and exit points.
- Works Across Markets: Effective for all asset classes, including stocks, forex, commodities, and cryptocurrencies.
- Combination with Other Tools: Use Fibonacci retracement with indicators like RSI, MACD, or moving averages for confirmation and improved accuracy.
- Customizable Time Frames: Apply Fibonacci retracement to any time frame, making it suitable for day traders, swing traders, and long-term investors.
- Anchor Points: Accurate retracement requires proper placement of the anchor points - connect the high and low of the trend for reliable levels.
- Confluence Zones: Align Fibonacci levels with other support and resistance zones or trendlines to strengthen trade setups.
- Psychological Levels: The 50% and 61.8% levels are particularly popular due to their alignment with natural market behavior and psychological significance.
- Backtesting and Refinement: Include Fibonacci retracement in backtesting to validate its effectiveness in different market conditions and optimize its application.
Conclusion
Fibonacci retracement is a powerful tool to help traders identify potential reversal points in a market. By combining it with other indicators and using it in the context of a broader trend, you can make more informed trading decisions. Always remember that Fibonacci levels are not magic. They work best when used with other technical tools, and you should never rely solely on them to make trading decisions. Practice drawing Fibonacci retracement lines on historical charts to get a better understanding of how price behaves around these levels.
Frequently Asked Questions
Quick answers based on this page's topic.
Fibonacci levels identify potential support or resistance areas where a trending market might pull back before continuing. By drawing the tool from a swing low to a swing high, traders look for 'buying the dip' opportunities at common ratios like 50% or 61.8%.
The Golden Pocket refers to the narrow zone between the 0.618 and 0.65 Fibonacci levels. This area is widely regarded as the highest-probability reversal zone in technical analysis, where corrective moves often end and the primary trend resumes with strength.
Fibonacci levels work largely due to a self-fulfilling prophecy. Because so many traders and automated trading bots monitor these specific ratios, buy and sell orders tend to cluster at these levels, creating the actual support or resistance observed on the chart.
Fibonacci levels gain the most power through confluence. When a 61.8% retracement aligns with a horizontal support level, a moving average, or a trendline, the probability of a reversal increases significantly because multiple independent analysis methods agree on the same price zone.
The 61.8% level, known as the Golden Ratio, is statistically the most watched and traded Fibonacci level. In strong trends, the 38.2% level often holds, while in weaker trends the 78.6% level may be tested before a reversal. The 50% level, while not a true Fibonacci ratio, is also widely respected.