Trading the Bullish Shark: Fading Failed Breakdowns at Support
The Bullish Shark Pattern is a sharp bullish reversal formation in technical analysis, often appearing at the tail end of a downtrend. Built on the unique O–X–A–B–C structure, it relies on precise Fibonacci ratios to identify exhaustion points. The key feature is point C, which typically extends beyond the starting point O, signaling that bearish momentum has overextended. When this pattern emerges, it marks a high-probability inflection zone where buyers regain control, offering traders an opportunity to enter long as an uptrend begins to unfold.
How to Identify the Bullish Shark Pattern in Trading
The Bullish Shark Pattern is a unique harmonic setup that signals exhaustion after an aggressive decline. Picture the market plunging, rebounding, then diving into a deeper stretch before losing momentum. At that exhaustion point, buyers step in to reverse the trend. Here’s how to spot it:
Start with the Big Picture
This pattern forms after a clear downtrend. Sellers appear dominant, but the Bullish Shark’s Fibonacci extensions reveal where the decline overreaches and a bullish reversal is likely to emerge.
Trace the 0XABC Legs
The Bullish Shark is structured around five points with exact Fibonacci ratios. Recognizing these levels is essential to confirm the setup.
- 0X: The initial decline that begins the structure.
- XA: A sharp move lower, forming the base of the pattern.
- AB: A rebound upward into 113%–161.8% of XA.
- BC: A final selloff downward into the 161.8%–224% projection of AB.
Zero in on C (the Reversal Zone)
C is the Potential Reversal Zone (PRZ), where exhaustion occurs, typically aligning with the 88.6%–113% retracement of XC and the BC projection range.
Watch the Breakout
Confirmation comes when price rebounds at C and breaks higher.
- A strong bullish candle or
- A close above B
Both confirm that sellers have lost control and buyers are stepping in. That’s your entry trigger.
Check Volume for Additional Confirmation
Volume flow provides the final confirmation.
- Strong volume on XA (initial selling pressure).
- Decline on AB (retracement).
- Another burst on BC (sellers overextending).
When that spike appears, the Bullish Shark’s bullish reversal gains strength.
Rise Bite: Measure the XA leg height and project it upward from C, or target the 38.2% or 61.8% retracement of XC for a realistic price target.
How to Trade the Bullish Shark Pattern (Trading Example)
To illustrate how the Bullish Shark harmonic pattern can be traded, we’ll analyze the BTCUSDT chart on the daily timeframe. This setup emerged in the middle of the 2021 bull market and offered a potential reversal opportunity from a significant weekly support zone.
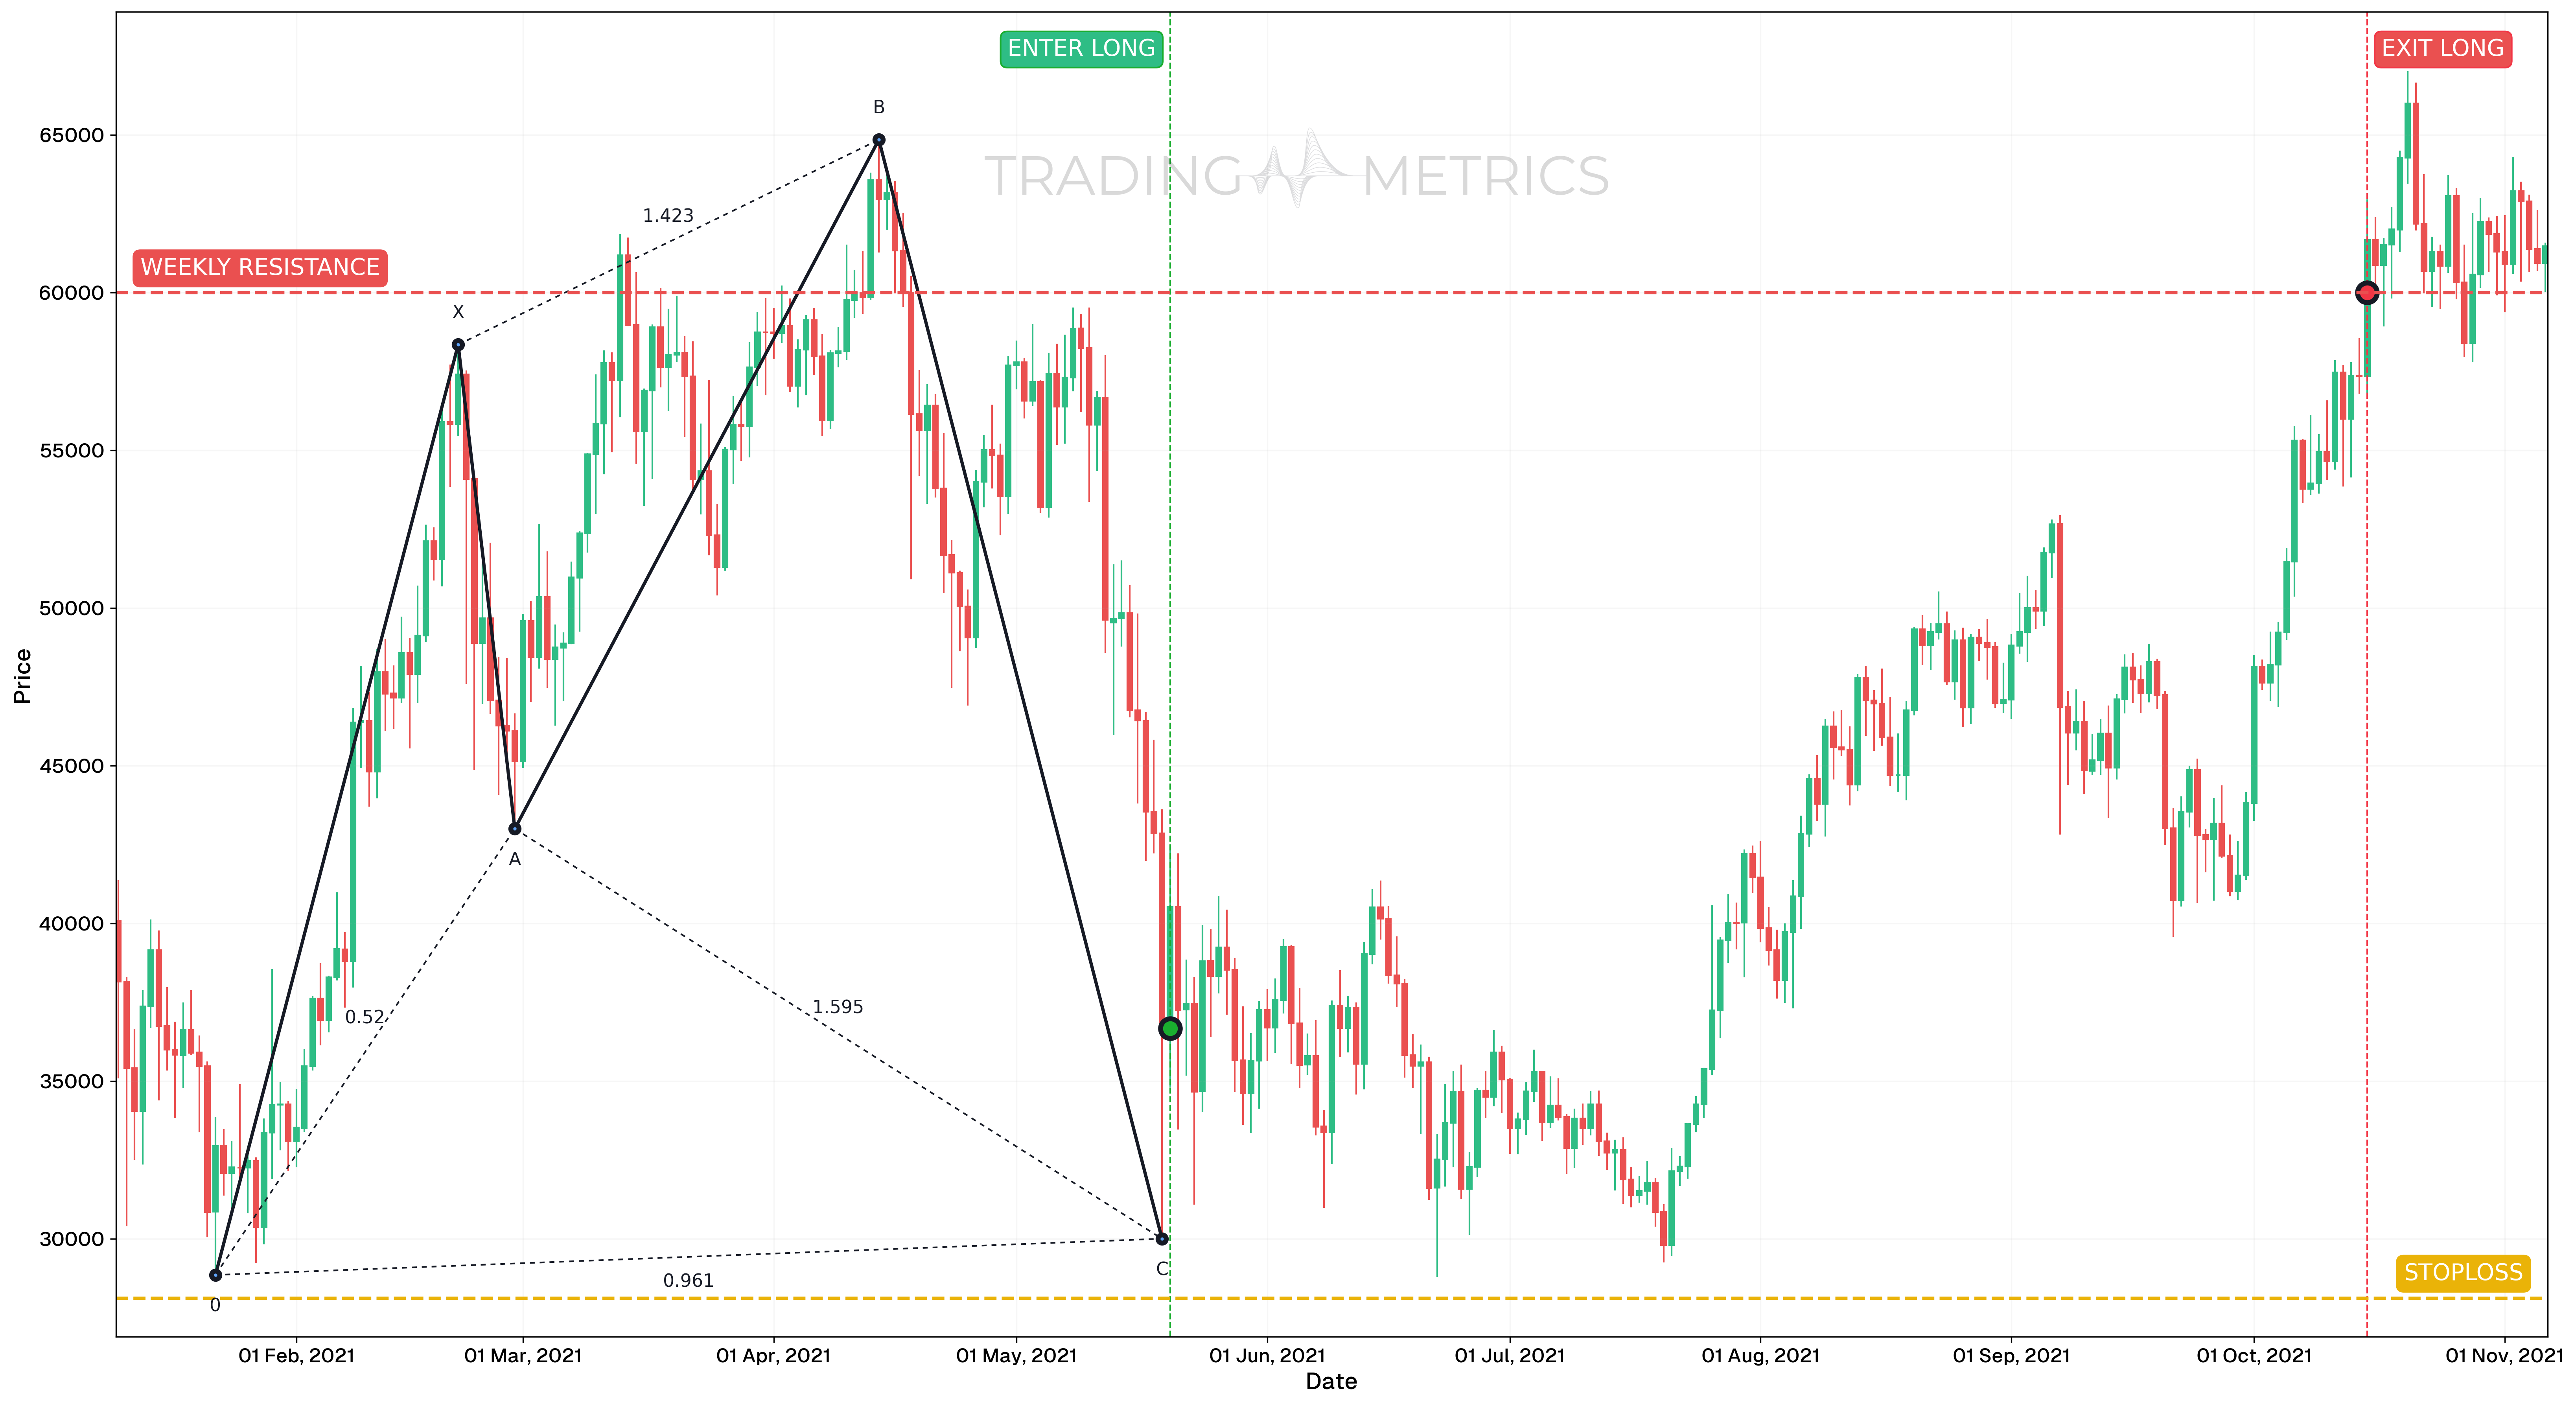
Analysis
Between January 10, 2021, and November 6, 2021, BTCUSDT formed a clean Bullish Shark pattern. The structure completed near a long-term weekly support, where the 0.886 retracement of the XA leg aligned with Fibonacci confluence zones.
While the Bullish Shark is often considered a reversal structure, traders must carefully manage risk, as not all patterns lead to an immediate reversal. In this case, although the pattern reached the Potential Reversal Zone (PRZ) around $36,671.23, entering immediately could have been risky without further confirmation.
Trade Setup
-
Entry: The long position was considered at $36,671.23 on May 20, 2021, after the completion of the Bullish Shark pattern. However, due to overall market conditions, additional confirmation was encouraged before entering:
- A support test or a bullish candlestick formation (e.g., hammer or Bullish Engulfing) would strengthen confidence.
- Alternatively, traders could have waited for momentum indicators like StochRSI or RSI to turn upward.
- Some aggressive traders may choose to enter with lower size or high leverage, while more cautious traders might scale in as price retests support.
-
Exit: The trade was closed at $60,002.43 on October 15, 2021, as price reached a key weekly resistance zone, aligning with the top of the harmonic wave structure.
-
Outcome: After proper confirmation, the Bullish Shark setup played out effectively, resulting in a major trend continuation from support toward new highs.
Risk Management
- Stop-Loss placement: stop-loss was placed below the D point, at $28,118.13, just under the PRZ (Potential Reversal Zone) and structure low.
- Risk-Reward Ratio: 1:2.73 is favorable ratio and reflects a balanced approach with a wide enough stop to allow for pattern volatility, yet clear structural resistance to define the target.
- Position sizing: A 2% capital risk model was applied, with size adjusted based on the entry-to-stop distance.
- Volatility Consideration: BTCUSDT tends to show increased volatility near harmonic pattern completions. It’s crucial to either wait for confirmation or use smaller size/leverage on early entries.
- Entry Caution: This trade is a reminder that even in valid harmonic setups, blindly entering at the PRZ (Potential Reversal Zone) is risky. Traders should combine pattern recognition with confirmation tools and market context for higher probability setups.
Volume Bite: A volume spike at D with confirmation snaps the pattern into a bullish surge.
Pre-Trade Checklist
Bite the Proof: Pair the pattern with volume spikes and indicators like RSI to dodge fakes and boost your odds.
Key Points
- Fibonacci Precision: Exact ratios (113%-161.8% AB, 161.8%-224% BC, 88.6%-113% CD) boost reliability - loose fits dilute it.
- Time Frame: Bites hardest on daily or weekly charts after downtrends.
- Combine with Indicators: Use moving averages or RSI to confirm the reversal.
- Breakout Confirmation: A close above B sets the turn - don’t jump at D alone.
- Price Target: Measure the XA leg or use Fibonacci Retracements of XC for targets above the close.
- Risk Management: Set a stop-loss below C or D to limit losses if it fails.
Wait for the Bite: Acting before confirmation risks a Bullish Shark trap - let the reversal snap.
Conclusion
The Bullish Shark Pattern is a trader’s fierce tool for catching bullish reversals. Its 0XABC snap, paired with volume, RSI, and moving averages, can bite into big gains. Whether in crypto, stocks, or forex, this pattern sharpens your edge. Stay precise, manage your risk, and let the Bullish Shark strike - that Fibonacci snap could surge into a winning trade.
Frequently Asked Questions
Quick answers based on this page's topic.
The Shark is distinguished by its 0-X-A-B-C structure, unlike the standard X-A-B-C-D format. It identifies a specific type of 'Bear Trap' where the C-point must exceed the A-point, signaling extreme volatility and a final shakeout of sellers before an aggressive reversal higher.
The PRZ for a Bullish Shark is the area where the 88.6% to 113% Fibonacci retracement of the original 0-X move converges. This zone represents the mathematical floor where selling pressure typically reaches absolute exhaustion and institutional buying begins.
Traders look for a 'reclaim' of previous structure. A high-probability signal occurs when price touches the PRZ at point C and then closes back above the previous swing low (point A), confirming that the downside move was a false breakout and the trend is turning.