Bollinger Bands: Reading Squeezes Before the Breakout
Bollinger Bands are a versatile and popular technical analysis tool used by traders to identify potential overbought or oversold conditions in the market. They consist of three lines:
- Middle Band: This is a Simple Moving Average (SMA), usually set to 20 periods.
- Upper Band: This is the middle band plus two standard deviations.
- Lower Band: This is the middle band minus two standard deviations.
The concept was developed by John Bollinger in the 1980s and provides a visual representation of volatility in the market. When the bands widen, volatility is high, and when they contract, volatility is low.
When price walks the band, trend persists but when it diverges, change may be near.
- Anonymous
How to Use Bollinger Bands?
Using Bollinger Bands involves interpreting the relationship between price and the three bands:
- Upper Band: When price reaches or moves above the Upper Band, it may indicate the asset is overbought or in a strong uptrend. Watch for potential reversals or trend continuations.
- Lower Band: When price touches or moves below the Lower Band, it suggests the asset may be oversold or in a strong downtrend. Look for possible bounces or further declines.
- Middle Band (SMA): The Middle Band acts as a mean price level. Price often gravitates back to this band after touching the Upper or Lower Band, making it a key target for reversal trades.
Complementary Indicators: Don’t rely on Bollinger Bands alone - they work best when paired with other indicators like MACD or Stochastic Oscillator.
How to Calculate Bollinger Bands?
To calculate Bollinger Bands, you need three key components: the middle band (a Simple Moving Average (SMA)), the upper band, and the lower band. Here’s a step-by-step guide with an example.
Calculate the Middle Band (SMA)
The Middle Band is calculated using the Simple Moving Average (SMA) formula, which provides the average of a series of prices over a defined period.
Formula:
Where:
- = closing prices for the defined period
- = number of periods
Calculate the Standard Deviation (SD)
The Standard Deviation (SD) measures the dispersion of price data from the SMA to determine volatility.
Formula:
Where:
- = each closing price
- = Simple Moving Average
- = number of periods
Calculate the Upper and Lower Bands
The Upper and Lower Bands are derived by adding and subtracting twice the Standard Deviation (SD) from the volatility, respectively.
Formulas:
-
Upper Band:
-
Lower Band:
Where:
- = Simple Moving Average
- = Standard Deviation
These formulas provide the foundation for constructing Bollinger Bands, which are essential for analyzing volatility and identifying potential trading signals.
Importance of Bollinger Bands in Trading
Bollinger Bands are a important tool in trading, providing insights into price volatility and potential reversal points. They help traders identify overbought or oversold conditions when prices approach the upper or lower bands, respectively. Additionally, band contraction signals market consolidation, while band expansion highlights potential breakout opportunities. By combining Bollinger Bands with other indicators, traders can make more informed decisions and manage risk effectively.
Volume Confirmation: Combine Bollinger Bands with volume analysis - breakouts with high volume carry more conviction.
Unveiling the Mystery of Bollinger Bands Periods
Bollinger Bands are like the Swiss Army knife of technical analysis tools, offering traders a comprehensive way to gauge market volatility and potential price movements. The key to harnessing their power lies in understanding the “periods” that define the bands. Let’s dive into this intriguing aspect of Bollinger Bands, exploring each band and how different period values can impact your trading.
The Middle Band: The Backbone
The middle band is a Simple Moving Average (SMA), typically set to 20 periods. The 20-period SMA is popular because it balances responsiveness with stability. It smooths out short-term price fluctuations while remaining relevant to current trends. Experimenting with Periods:
Shorter Periods (e.g., 10)
Makes the middle band more responsive to recent price changes, great for short-term trading but can be choppier.
Longer Periods (e.g., 50)
Provides a smoother line that’s less reactive to short-term volatility, ideal for longer-term trend analysis but slower to react.
The Upper Band: The Ceiling
The upper band is set two standard deviations above the middle band. Two Standard Deviations choice captures about 95% of price action, assuming a normal distribution of prices. Experimenting with Standard Deviations:
Smaller Deviations (e.g., 1.5)
Makes the bands narrower, which can highlight more frequent overbought signals but might generate false alarms.
Larger Deviations (e.g., 2.5)
Widens the bands, filtering out noise and focusing on more significant overbought conditions, though it might miss some trading opportunities.
The Lower Band: The Floor
The lower band is set two standard deviations below the middle band. Two Standard Deviations mirrors the logic of the upper band, aiming to capture most price movements. Experimenting with Standard Deviations:
Smaller Deviations (e.g., 1.5)
Narrows the bands, signaling oversold conditions more frequently but increasing the risk of false signals.
Larger Deviations (e.g., 2.5)
Widens the bands, filtering out less significant price dips, thus focusing on major oversold signals.
Overbought Condition
Overbought Signal occurs When the price touches or exceeds the upper band, it might indicate the asset is overbought, and a reversal could follow. Traders may consider selling or shorting at this point.
Caution: These signals are more reliable in range-bound markets but can give false signals during strong trends
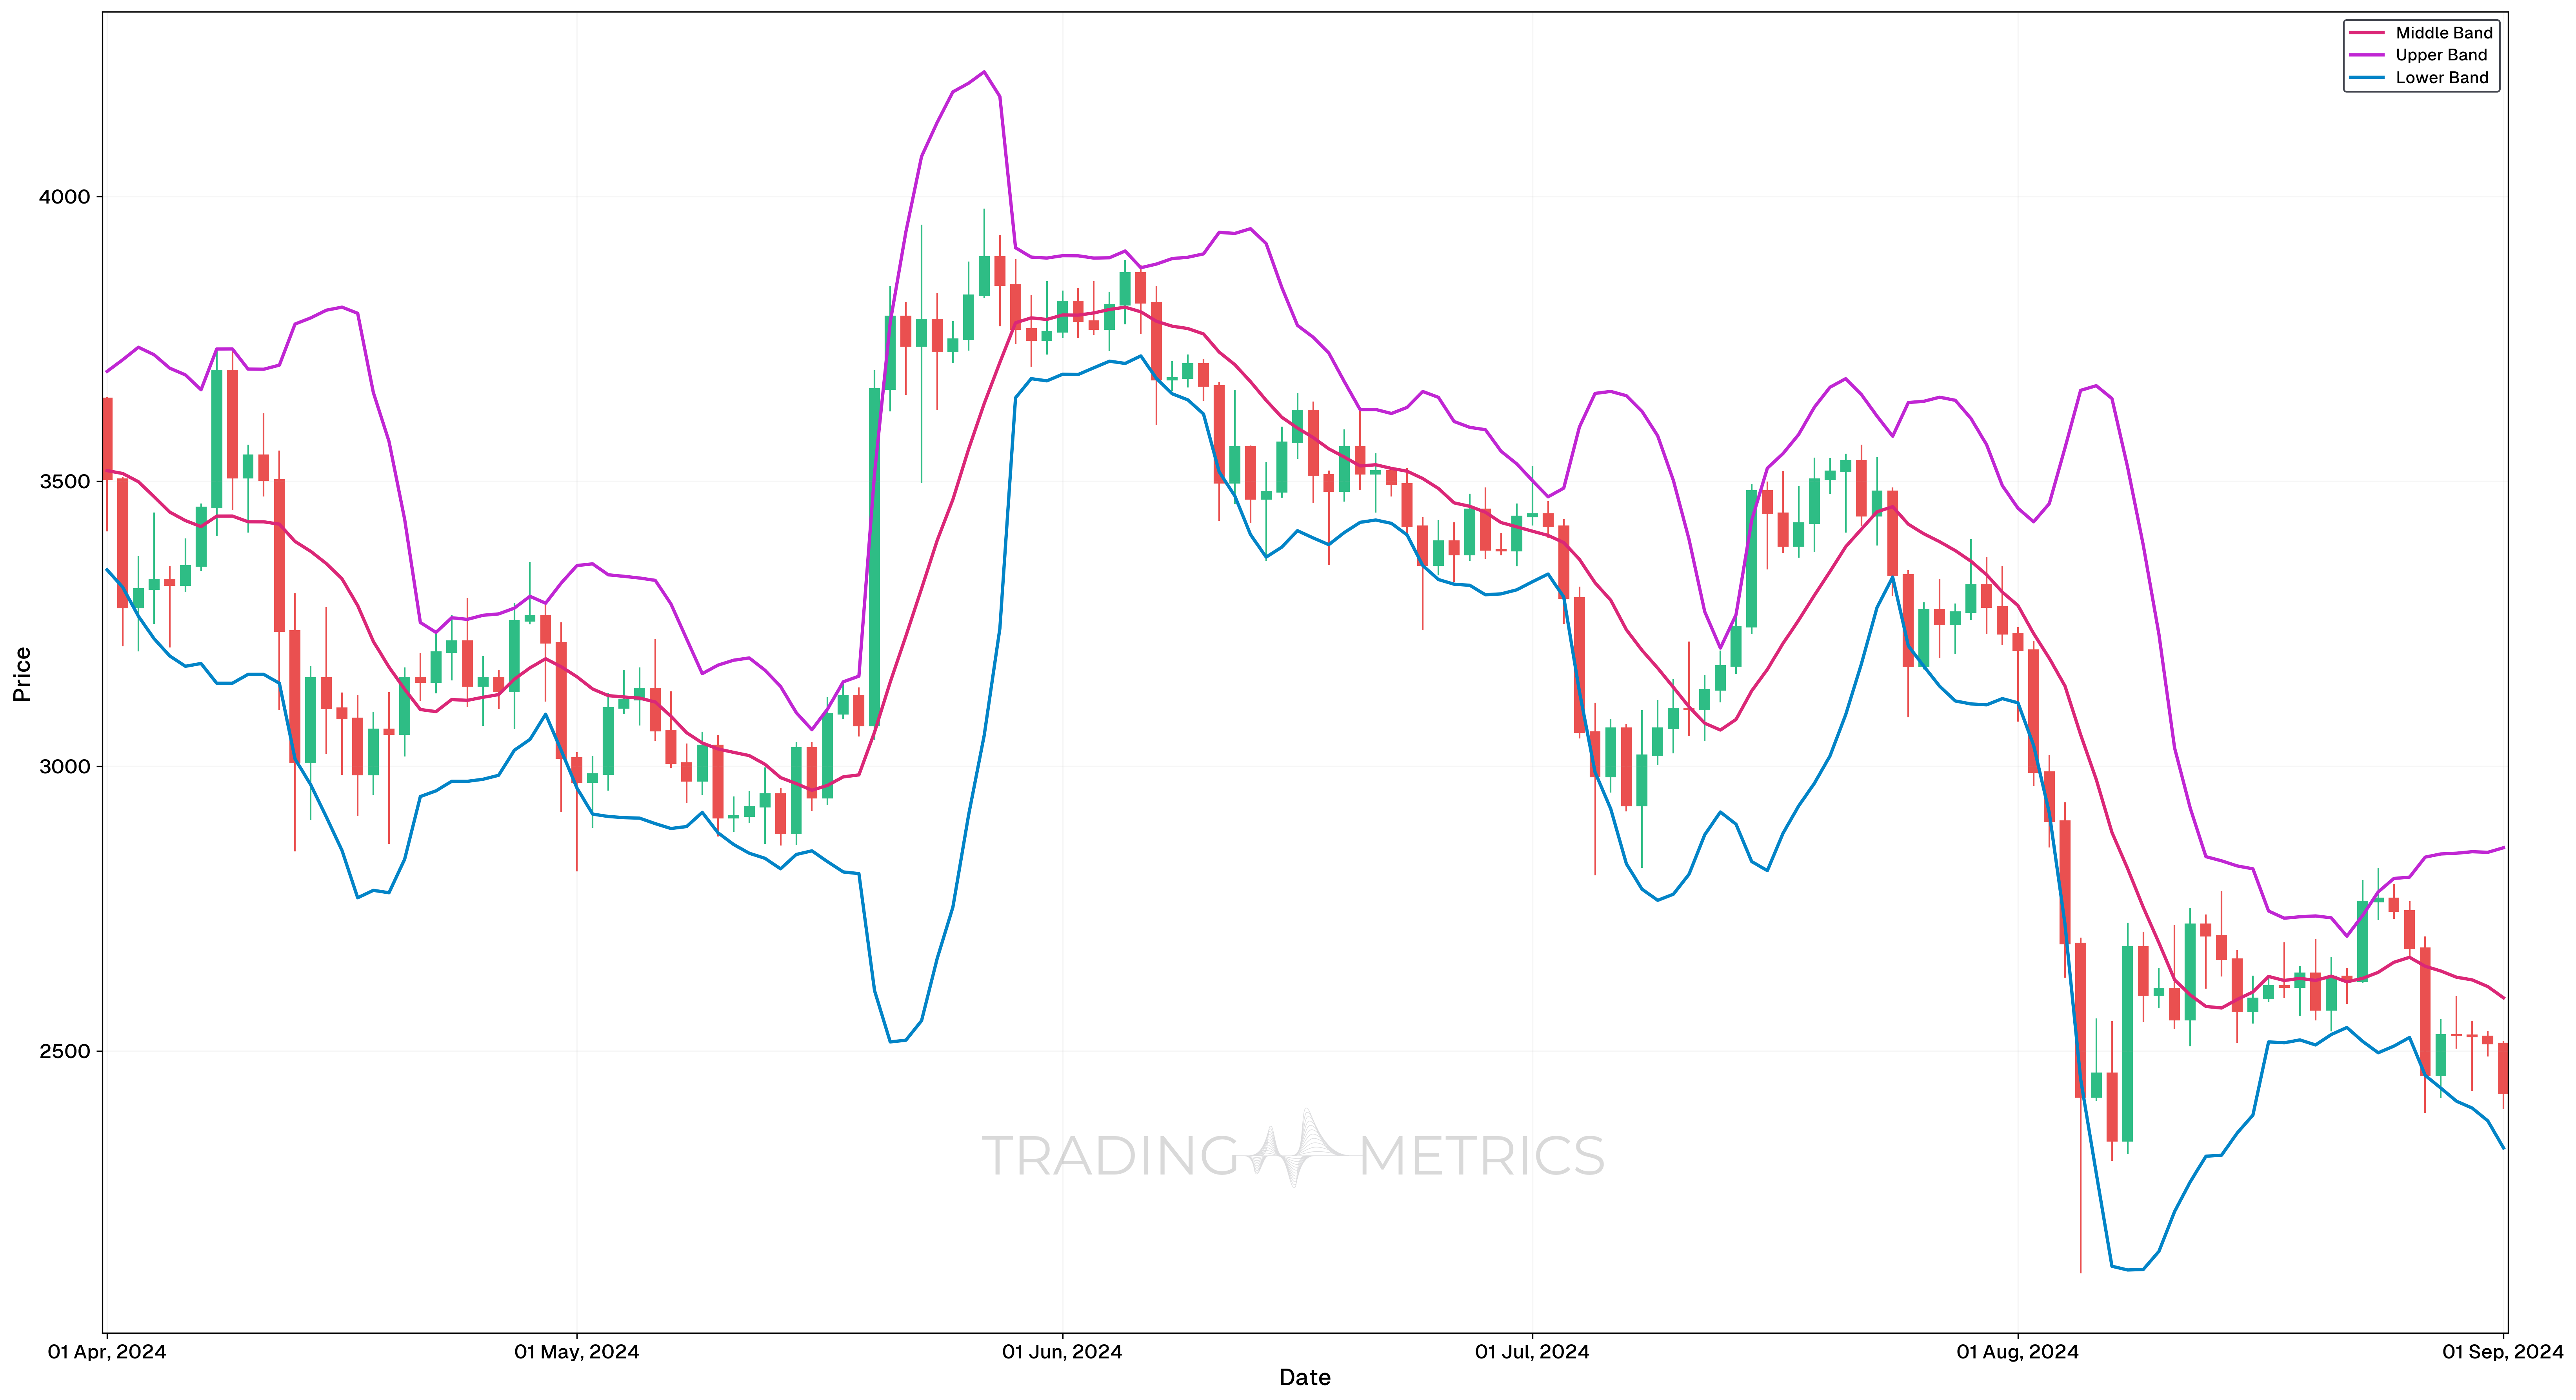
Analysis
-
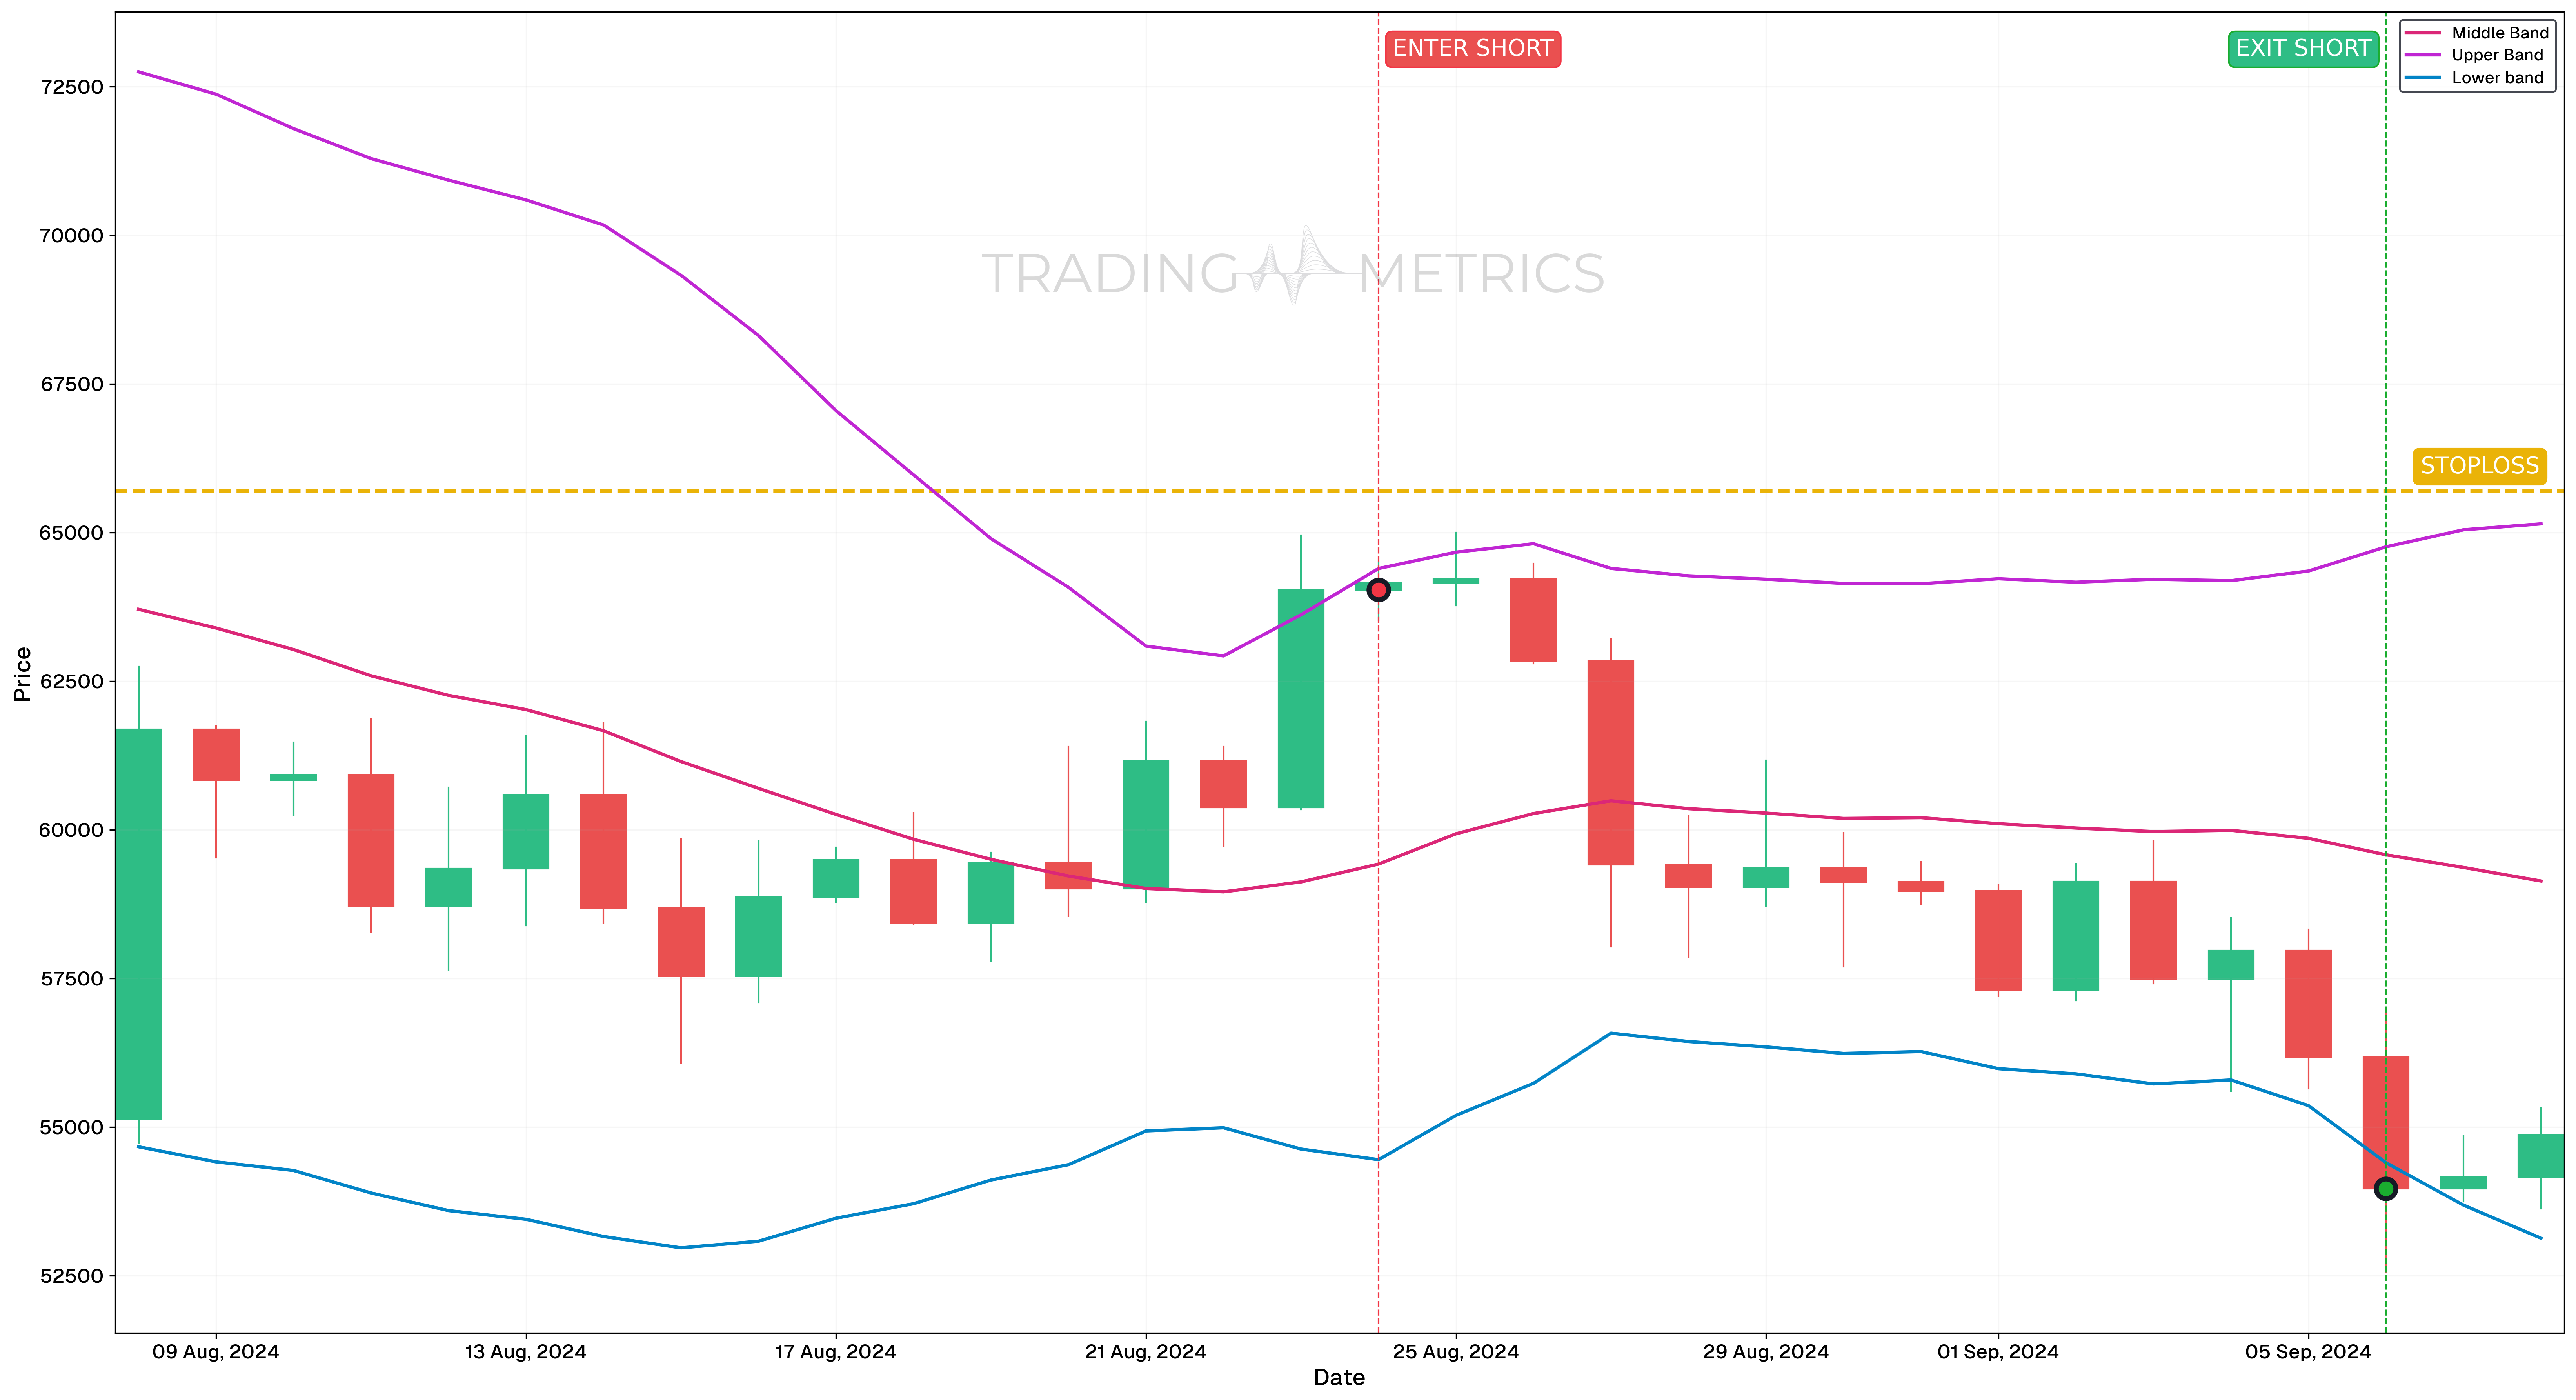
On August 24, 2024, a Short Position Entry Signal was triggered as the candlestick crossed below the Upper Bollinger Band, indicating the market was likely overbought and presenting a potential short entry opportunity. After this signal, the price began to decline, confirming the overbought condition.
-
On September 06, 2024, a Short Position Exit Signal was observed as the candlestick crossed the Lower Bollinger Band, signaling that the market was likely oversold and offering an ideal exit point for the short position.
Trade Setup
- Entry: On August 24, 2024, a short position was initiated based on the signal provided by the Bollinger Bands, marking the market’s overbought condition.
- Exit: The position was closed on September 06, 2024, as the Lower Bollinger Band crossover indicated the market was likely oversold.
- Outcome: This setup highlights how Bollinger Bands can effectively identify overbought and oversold conditions, enabling traders to time their entries and exits with precision.
Risk Management
- Stop-Loss Placement: The stop-loss was strategically set at $65,700, positioned slightly above the upper Bollinger Band, allowing for a controlled risk profile while maintaining alignment with the overbought entry signal.
- Position sizing: Position size was calculated to ensure a maximum risk exposure of 2% of trading capital, adhering to disciplined risk management practices.
- Risk-Reward Analysis: The trade setup maintained a 1:6.06 Risk-Reward Ratio, optimizing potential returns relative to the predefined risk level, especially given the Bollinger Band setup.
- Managing Volatility: Given the potential for sharp price reversals when the asset exits the upper Bollinger Band, adjusting the stop-loss as price approaches the middle band can help secure profits while protecting against unexpected reversals.
- Exit Strategy: Implementing a partial exit strategy as the price nears the lower Bollinger Band can lock in gains while maintaining exposure for further downside potential, aligning with the overbought-to-oversold cycle.
Oversold Condition
Oversold Signal occurs when the price touches or dips below the lower band, it may suggest the asset is oversold, hinting at a potential buying opportunity.
Caution: These signals are more reliable in range-bound markets but can give false signals during strong trends
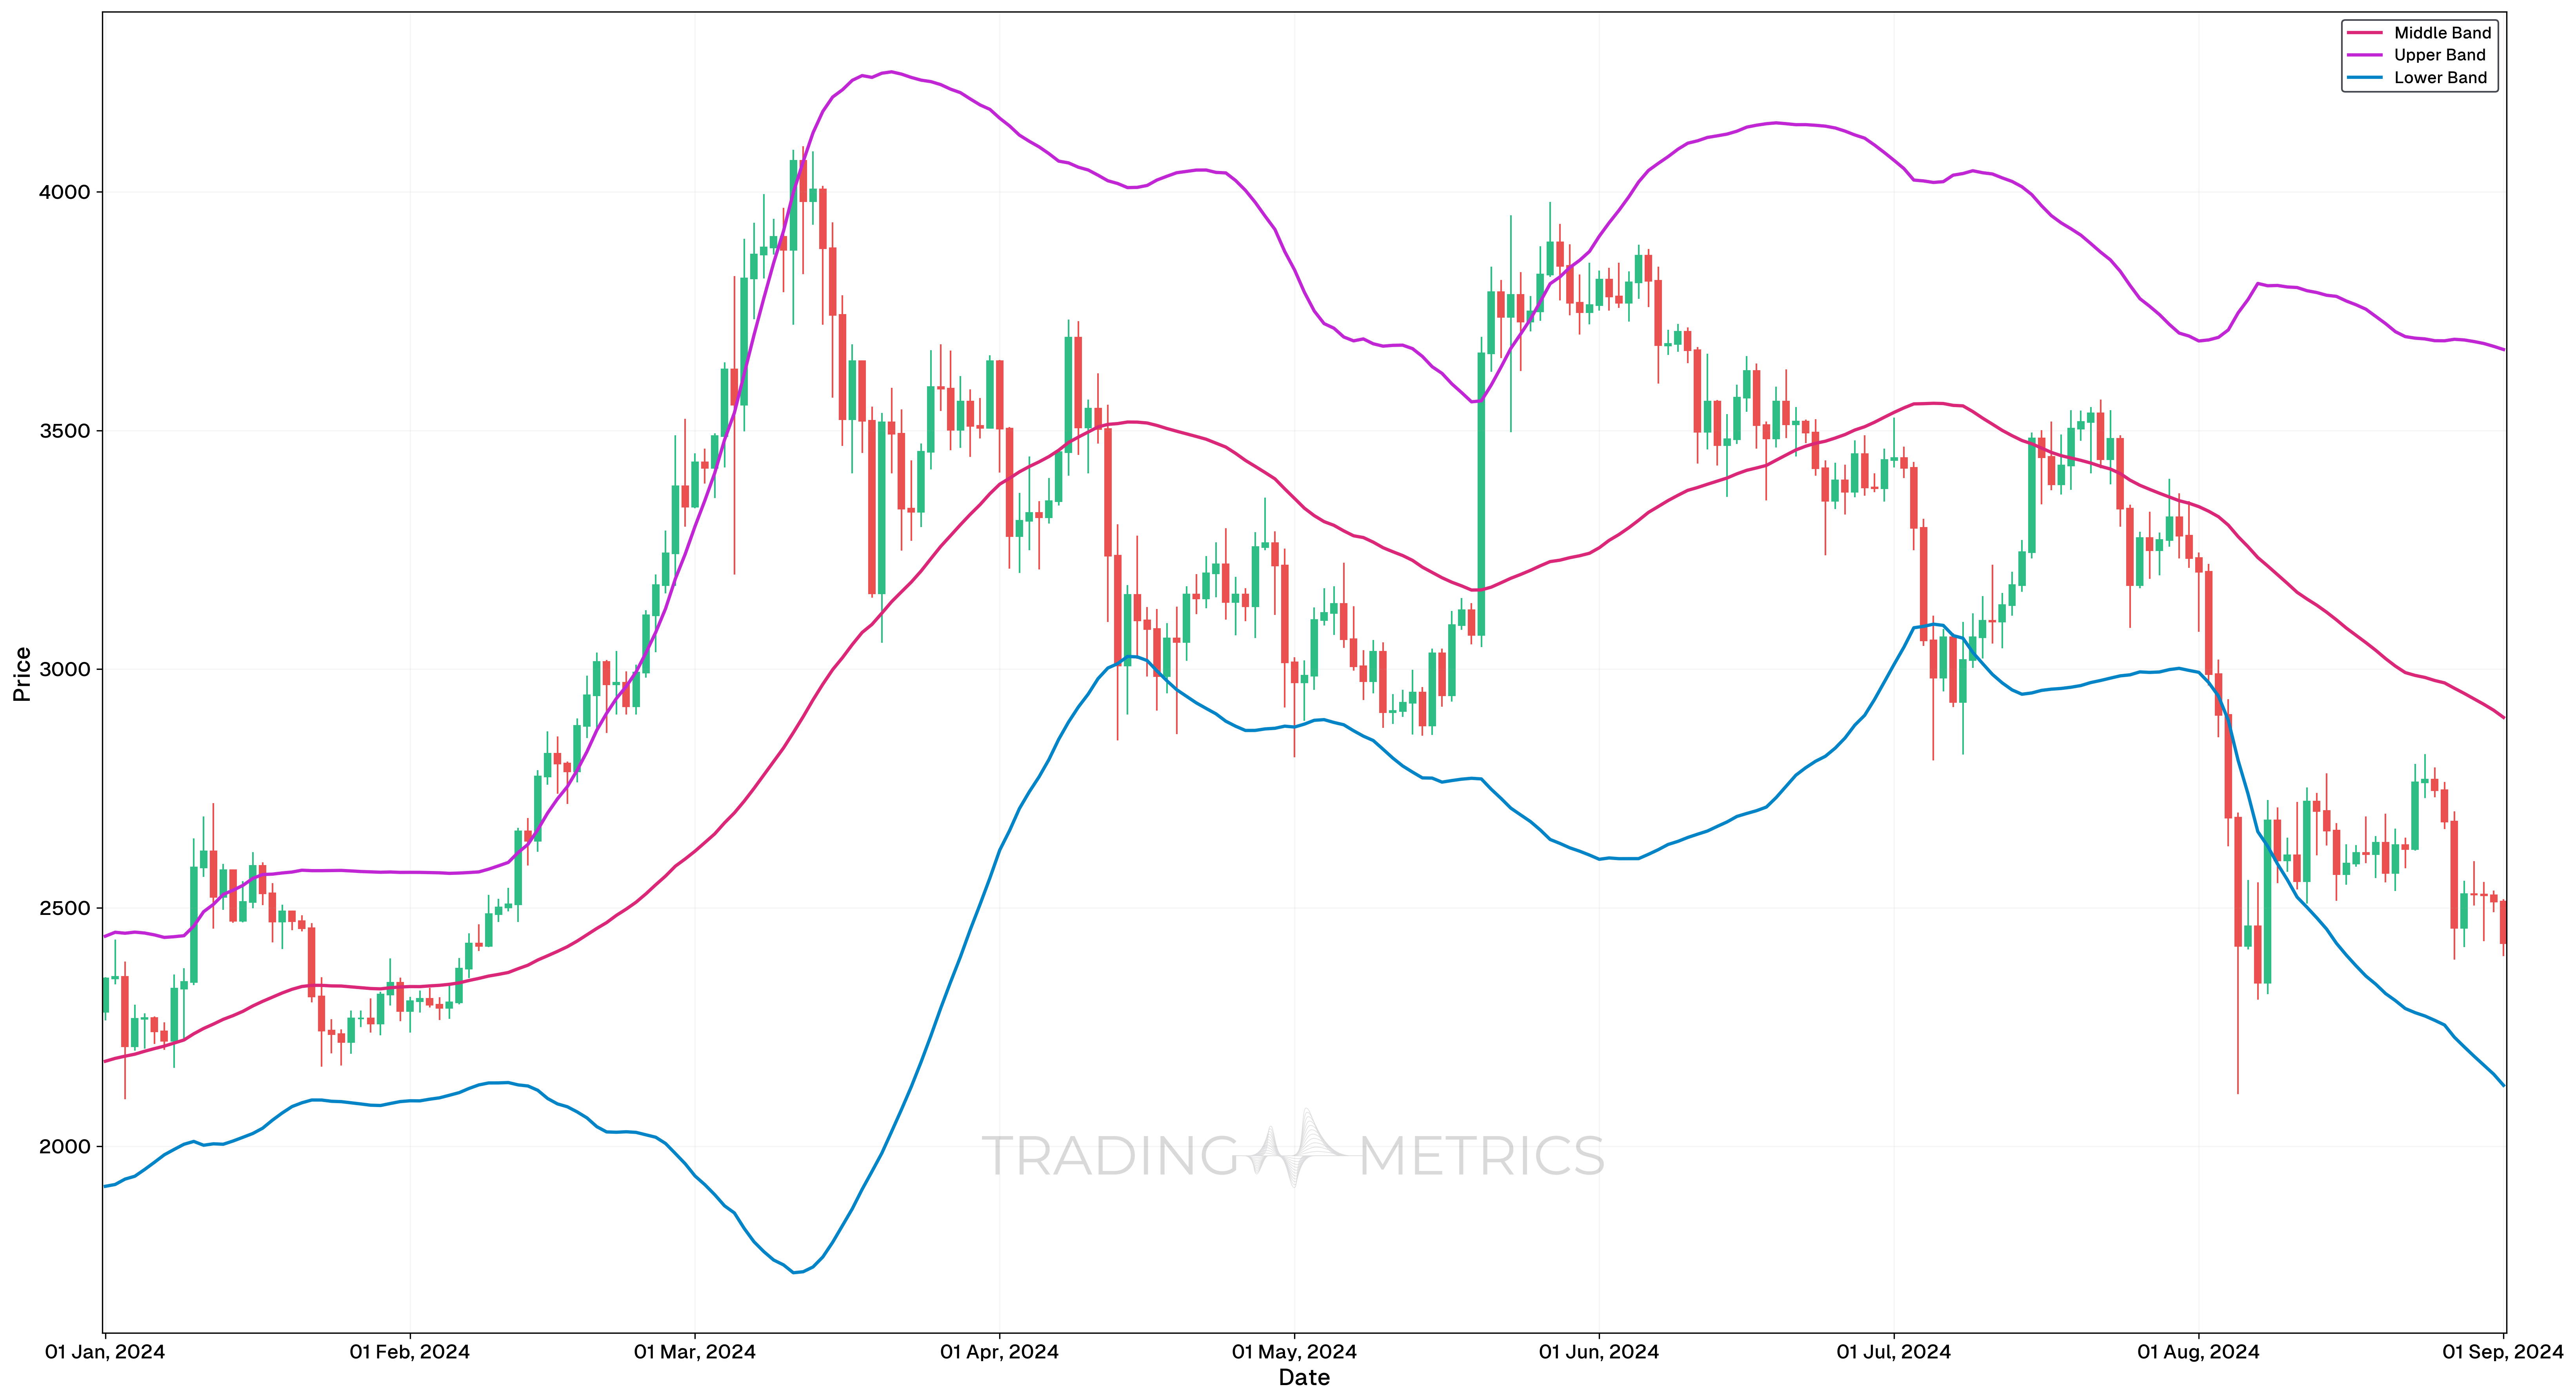
Analysis
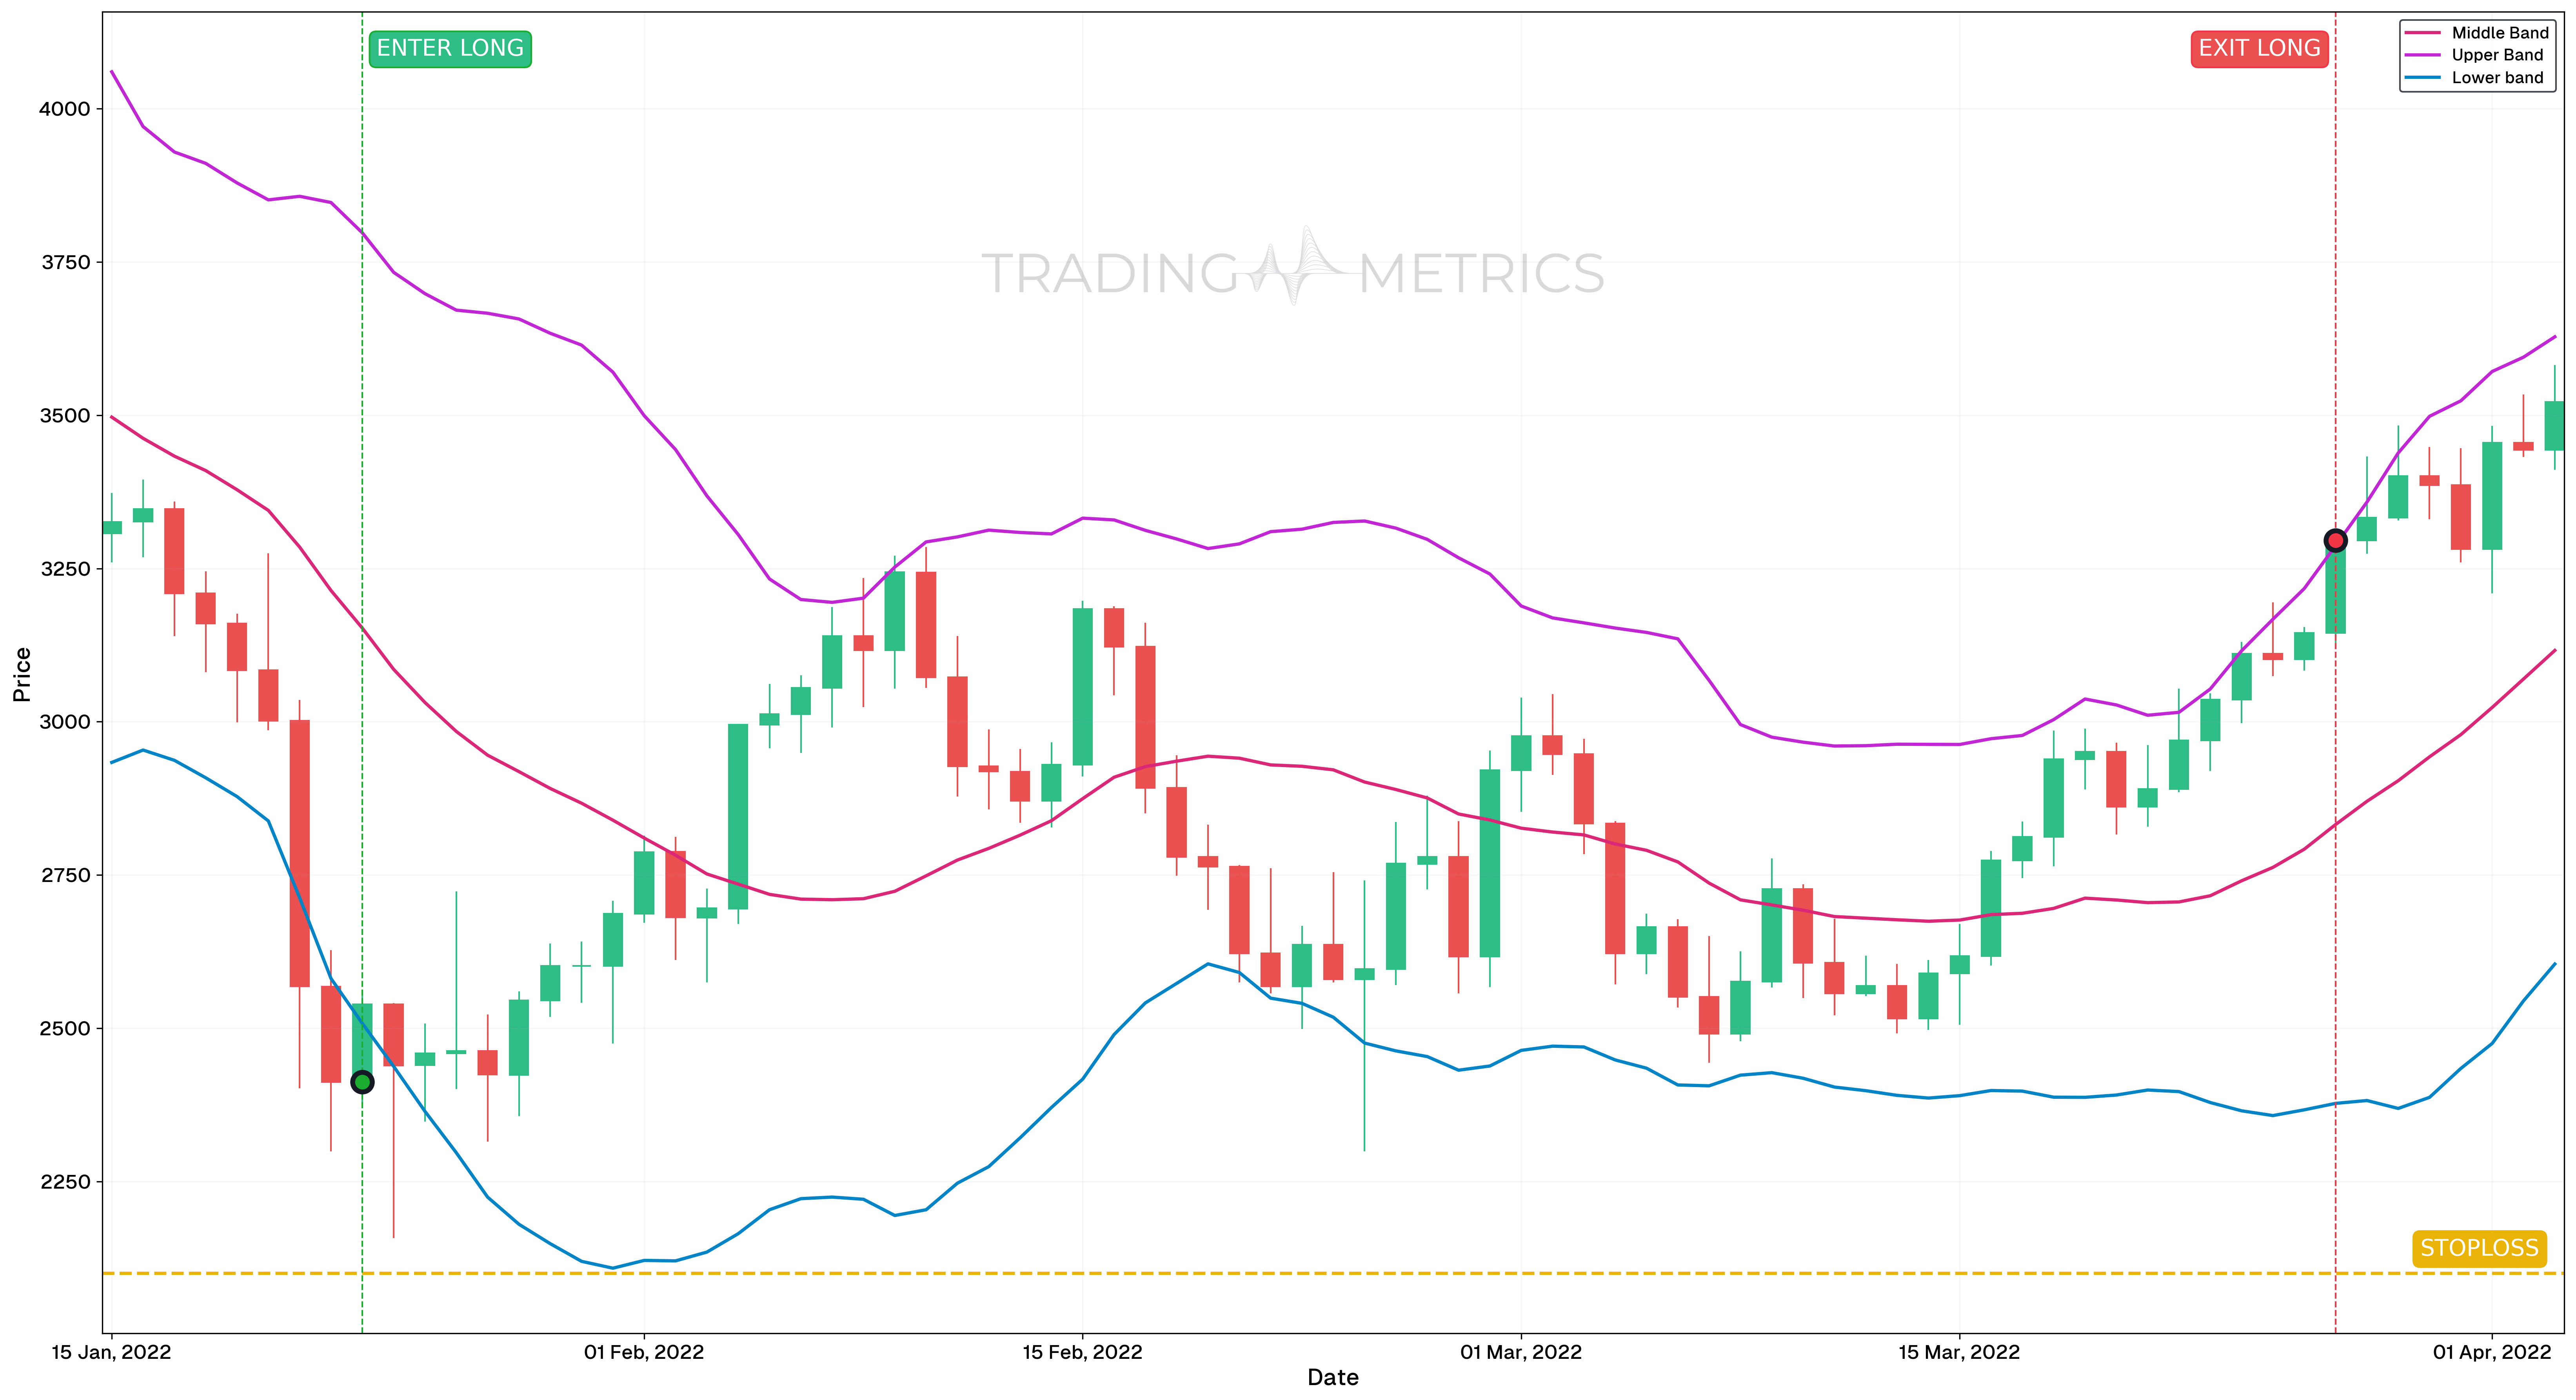
- On January 23, 2022, a buy signal was triggered as the candlestick crossed the Lower Bollinger Band, indicating the market was likely oversold. This presented a potential buying opportunity, and the price began to show signs of recovery, confirming the oversold condition.
- On March 27, 2022, a sell signal was identified as the Upper Bollinger Band crossed the candlestick, signaling the market was likely overbought. Following this signal, the price began to decline, suggesting a potential market correction after a rally.
Trade Setup
- Entry: On January 23, 2022, a long position was initiated based on the Lower Bollinger Band crossover, highlighting the market’s oversold condition and potential for recovery.
- Exit: The position was closed on March 27, 2022, as the Upper Bollinger Band crossover indicated the market was likely overbought, signaling an ideal exit point.
- Outcome: This setup illustrates the effectiveness of Bollinger Bands in identifying oversold and overbought conditions, providing traders with reliable signals for timing their entries and exits with precision.
Risk Management
- Stop-Loss Placement: The stop-loss was strategically set at $2100, positioned below the lower Bollinger Band to maintain a controlled risk profile while aligning with the oversold entry signal.
- Position sizing: Position size was calculated to ensure a maximum risk exposure of 2% of trading capital, adhering to structured risk management principles.
- Risk-Reward Analysis: The trade setup adhered to a 1:2.83 Risk-Reward Ratio, balancing the potential upside with the predefined risk level, especially given the Bollinger Band structure.
- Managing Volatility: Monitoring price action around the middle Bollinger Band and adjusting the stop-loss as the price moves towards the upper band can help secure gains while protecting against sudden reversals.
- Exit Strategy: Implementing a partial exit strategy near the middle band allows for capturing gains while maintaining exposure to further upside potential as the price approaches the upper Bollinger Band.
Bollinger Band Squeeze (Contraction)
Bollinger Band Squeeze is known as a squeeze, and it often precedes a significant price move. The price will likely break out in either direction, often resulting in strong momentum. Traders typically wait for the breakout to occur before making a trade in the direction of the breakout.
Caution: Initial moves after a squeeze can sometimes be false, so confirmation with additional indicators is recommended.
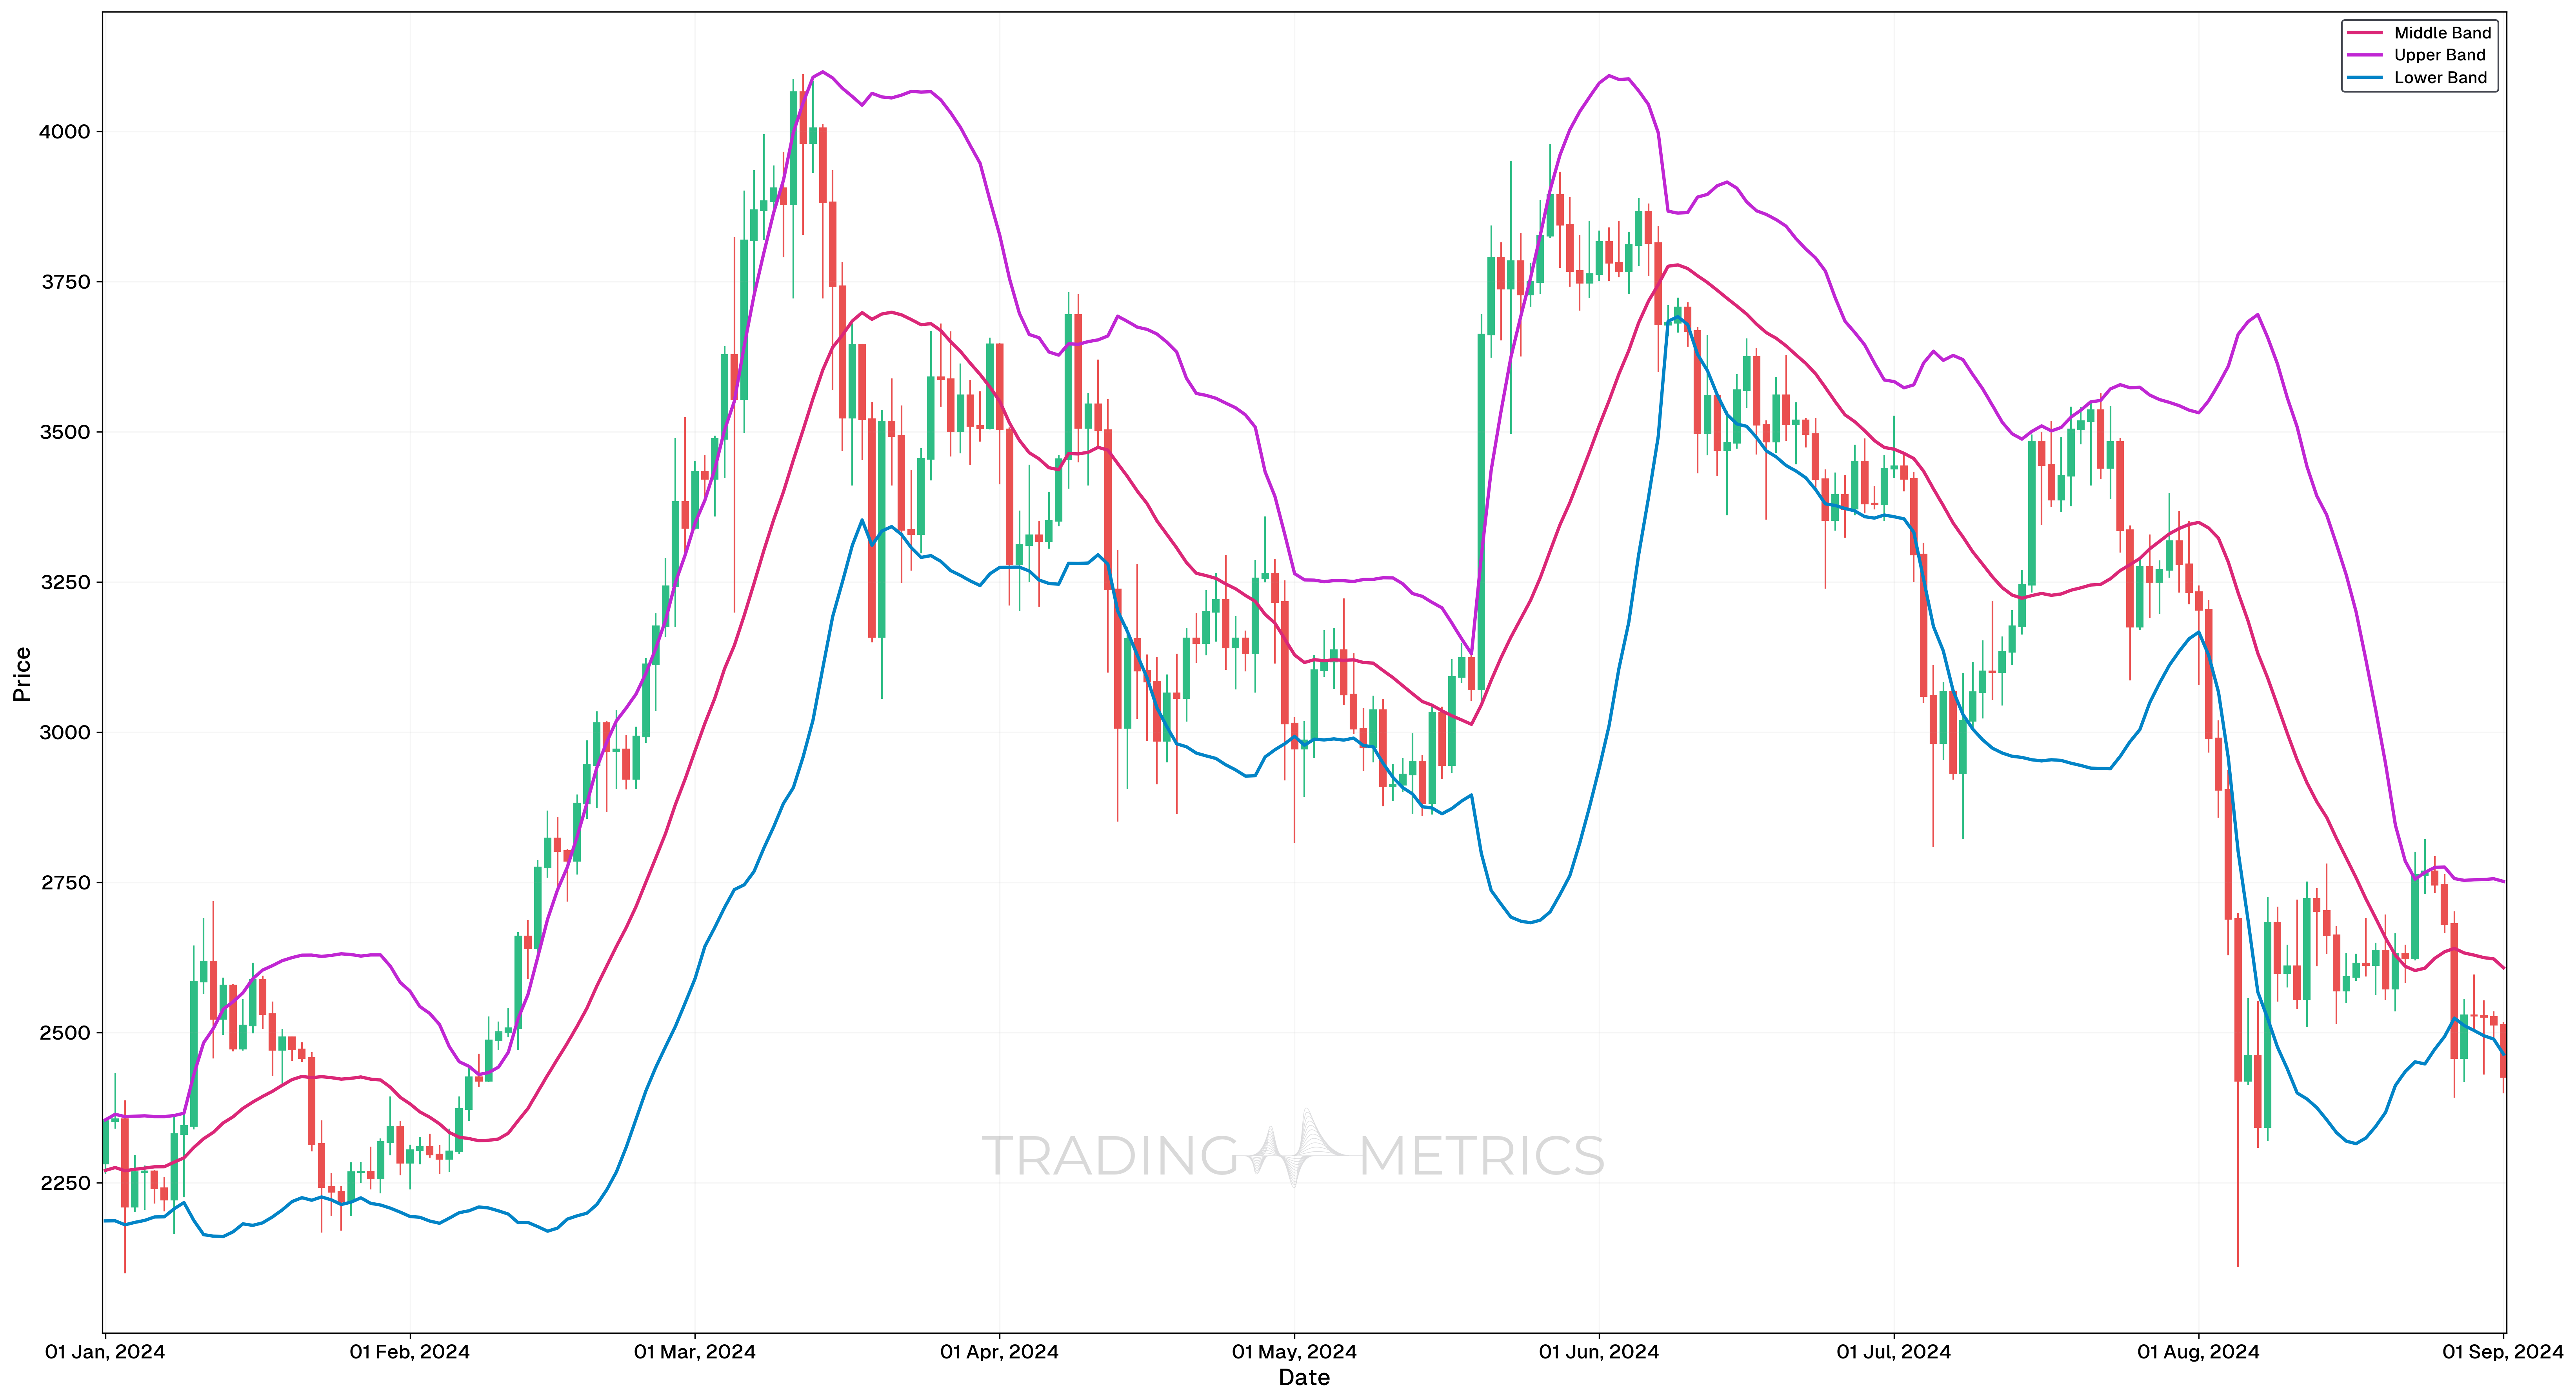
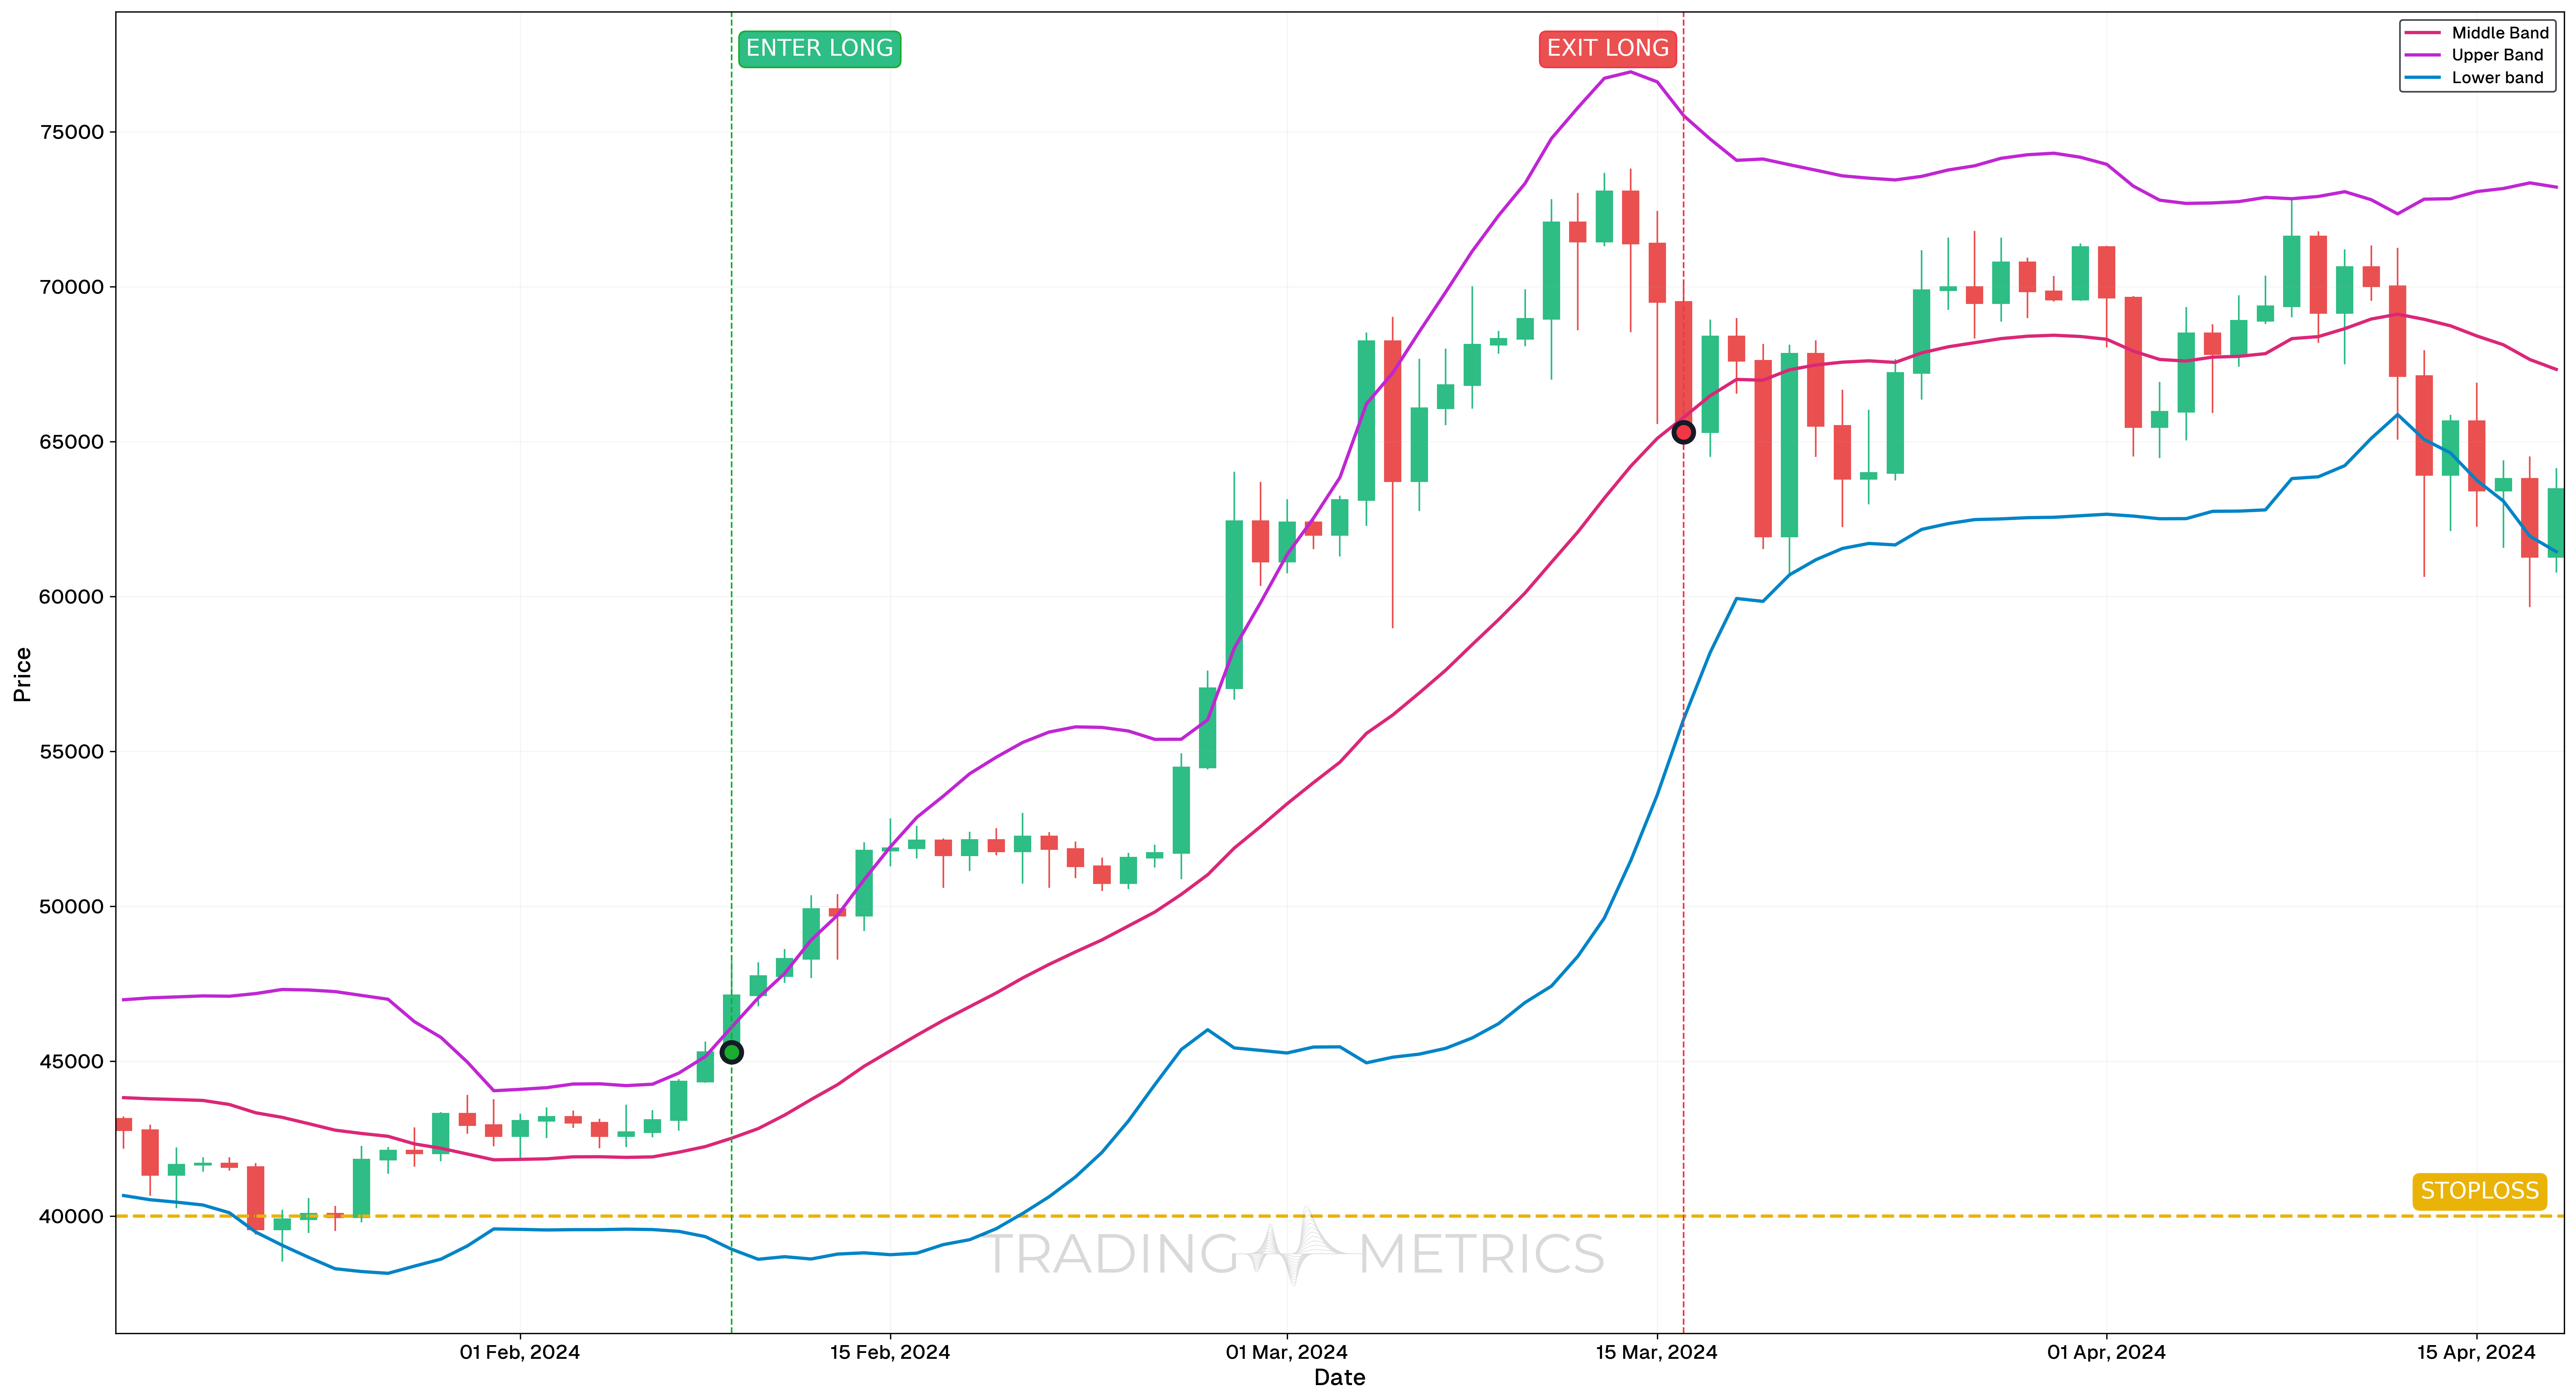
In this analysis, we will explore how Bollinger Band Squeeze can provide buy and sell signals based on the price movement and volatility of the asset. Specifically, we’ll analyze two key dates: the buy signal on February 8, 2024, and the sell signal on March 16, 2024.
Analysis
-
On February 9, 2024, a buy signal was triggered as the price broke out from a Bollinger Band squeeze, moving toward the upper band with increasing volatility. This breakout typically signals the start of an upward trend, making it a favorable buy opportunity.
-
On March 16, 2024, a sell signal occurred as the price crossed back below the middle band. At this point, the Bollinger Bands began squeezing again, indicating decreasing volatility and signaling a potential consolidation period or downtrend. This provided an optimal exit point for the position.
Trade Setup
- Entry: On February 9, 2024, a long position was initiated as the Bollinger Band squeeze breakout indicated the start of an upward trend, supported by increasing volatility.
- Exit: The position was closed on March 16, 2024, when the price crossed below the middle band and the Bollinger Bands began squeezing again, signaling declining volatility and potential market consolidation or reversal.
- Outcome: This setup highlights the importance of understanding Bollinger Band behavior and changes in volatility, allowing traders to optimize their entries and exits for improved trading performance.
Risk Management
- Stop-Loss Placement: The stop-loss was strategically set at $40,000, positioned below the lower Bollinger Band, allowing for adequate risk management while aligning with the initial squeeze breakout structure.
- Position sizing: Position size was calculated to ensure a maximum risk exposure of 2% of trading capital, adhering to a structured risk management framework.
- Risk-Reward Analysis: The trade setup maintained a 1:3.79 Risk-Reward Ratio, optimizing the potential for reward relative to the defined risk, especially given the squeeze breakout context.
- Managing Volatility: Monitoring the Bollinger Band width is critical in this setup. As the squeeze resolves and volatility increases, trailing the stop-loss along the middle band can help lock in gains while protecting against sharp reversals.
- Exit Strategy: Implementing partial exits as price approaches the upper Bollinger Band can help secure gains while maintaining exposure to continued upward momentum, aligning with the squeeze breakout strategy.
Squeeze Strategy: A squeeze in Bollinger Bands often signals a major price move is brewing so stay alert for a directional breakout!
Bollinger Band Breakout Condition
Signal: A price moving outside of the bands indicates strong momentum. This can be a continuation signal (the trend will keep going in that direction).
Caution: While a breakout can suggest strong momentum, some traders mistakenly view every move outside the bands as a reversal signal. It’s critical to watch whether the price continues to “hug” the bands, suggesting the trend will persist
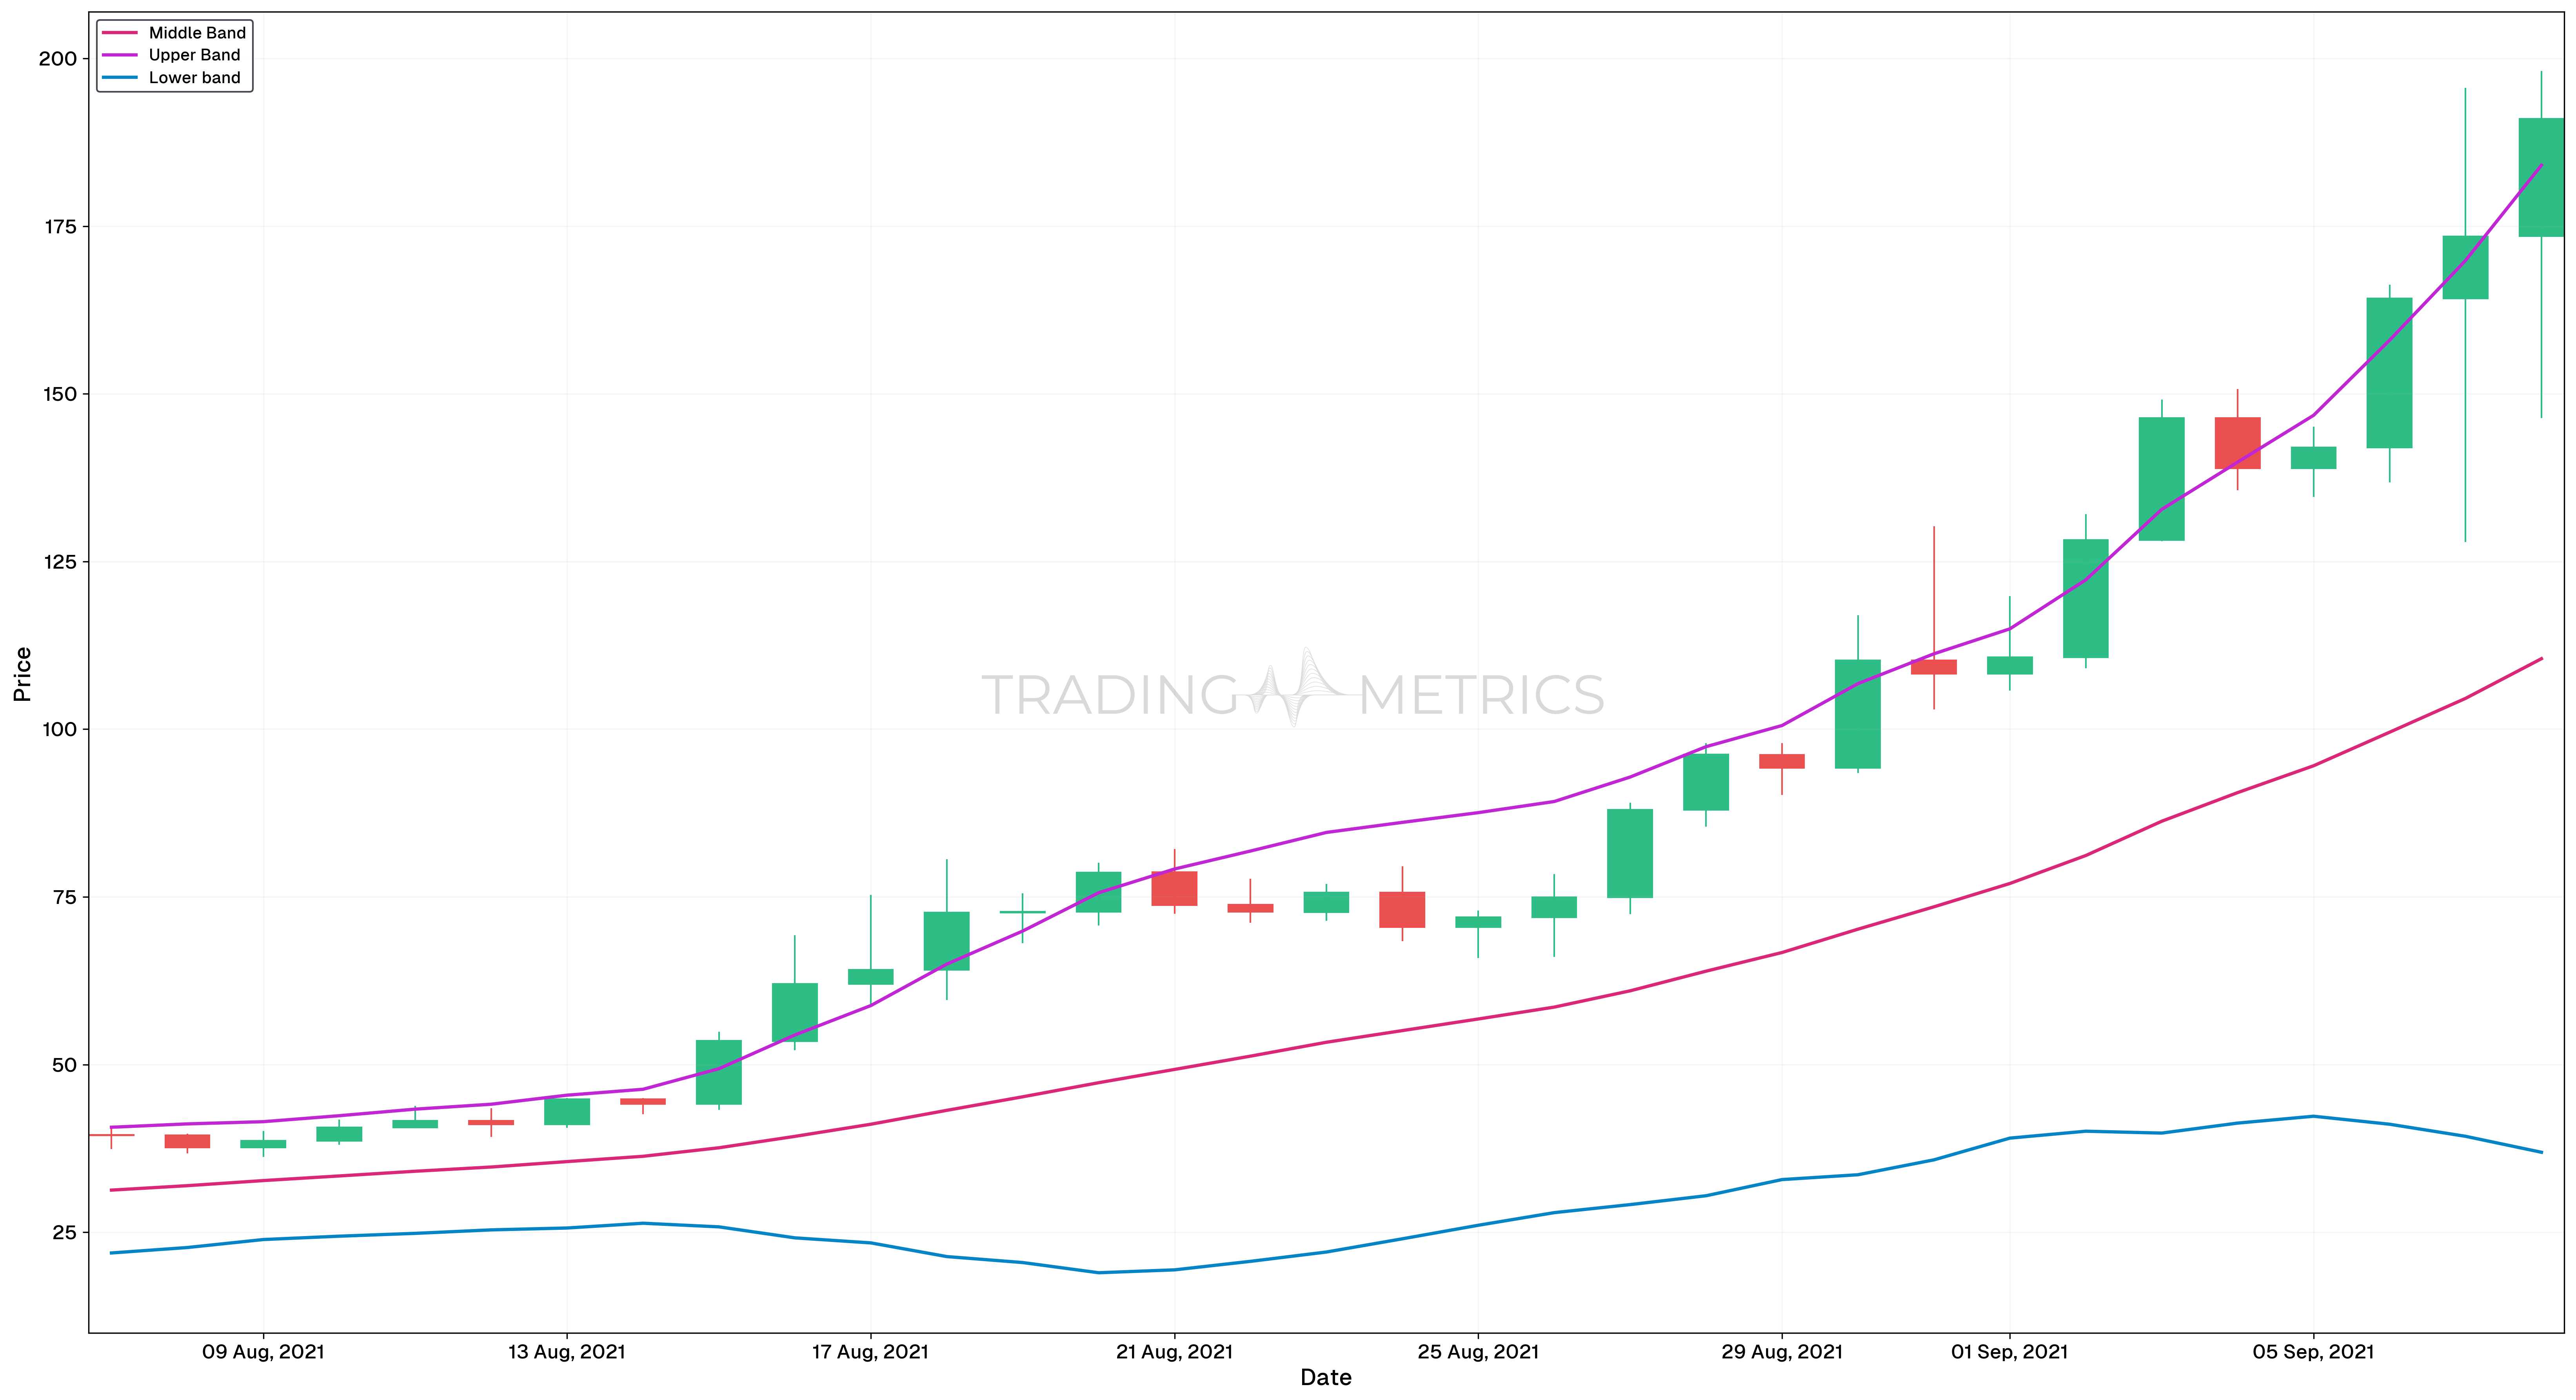
This chart displays the price action of the SOL/USDT pair over the date range from August 7, 2021, to September 8, 2021. Throughout this period, the closing price broke above the upper Bollinger Band multiple times, signaling strong bullish momentum. Such Bollinger Band breakouts indicate periods of heightened price volatility and can suggest a continuation of the current trend. During this timeframe, the breakout points often reflected increased buying pressure, reinforcing the notion that price movements outside the bands typically signal strong directional momentum.
Breakout Alerts: Bollinger Bands shine in volatile markets - watch for price to breach the bands for potential breakout setups.
Trend-Following with Bands
- Strong Uptrend Signal: If the price “rides” the upper band, it indicates a strong uptrend. Traders may follow this trend until the price pulls away from the band.
- Strong Downtrend Signal: Similarly, if the price hugs the lower band, it signals a strong downtrend.
Caution: It’s crucial to avoid assuming a trend is exhausted simply because it’s near the bands. Trend confirmation tools like momentum indicators (e.g., RSI) can help
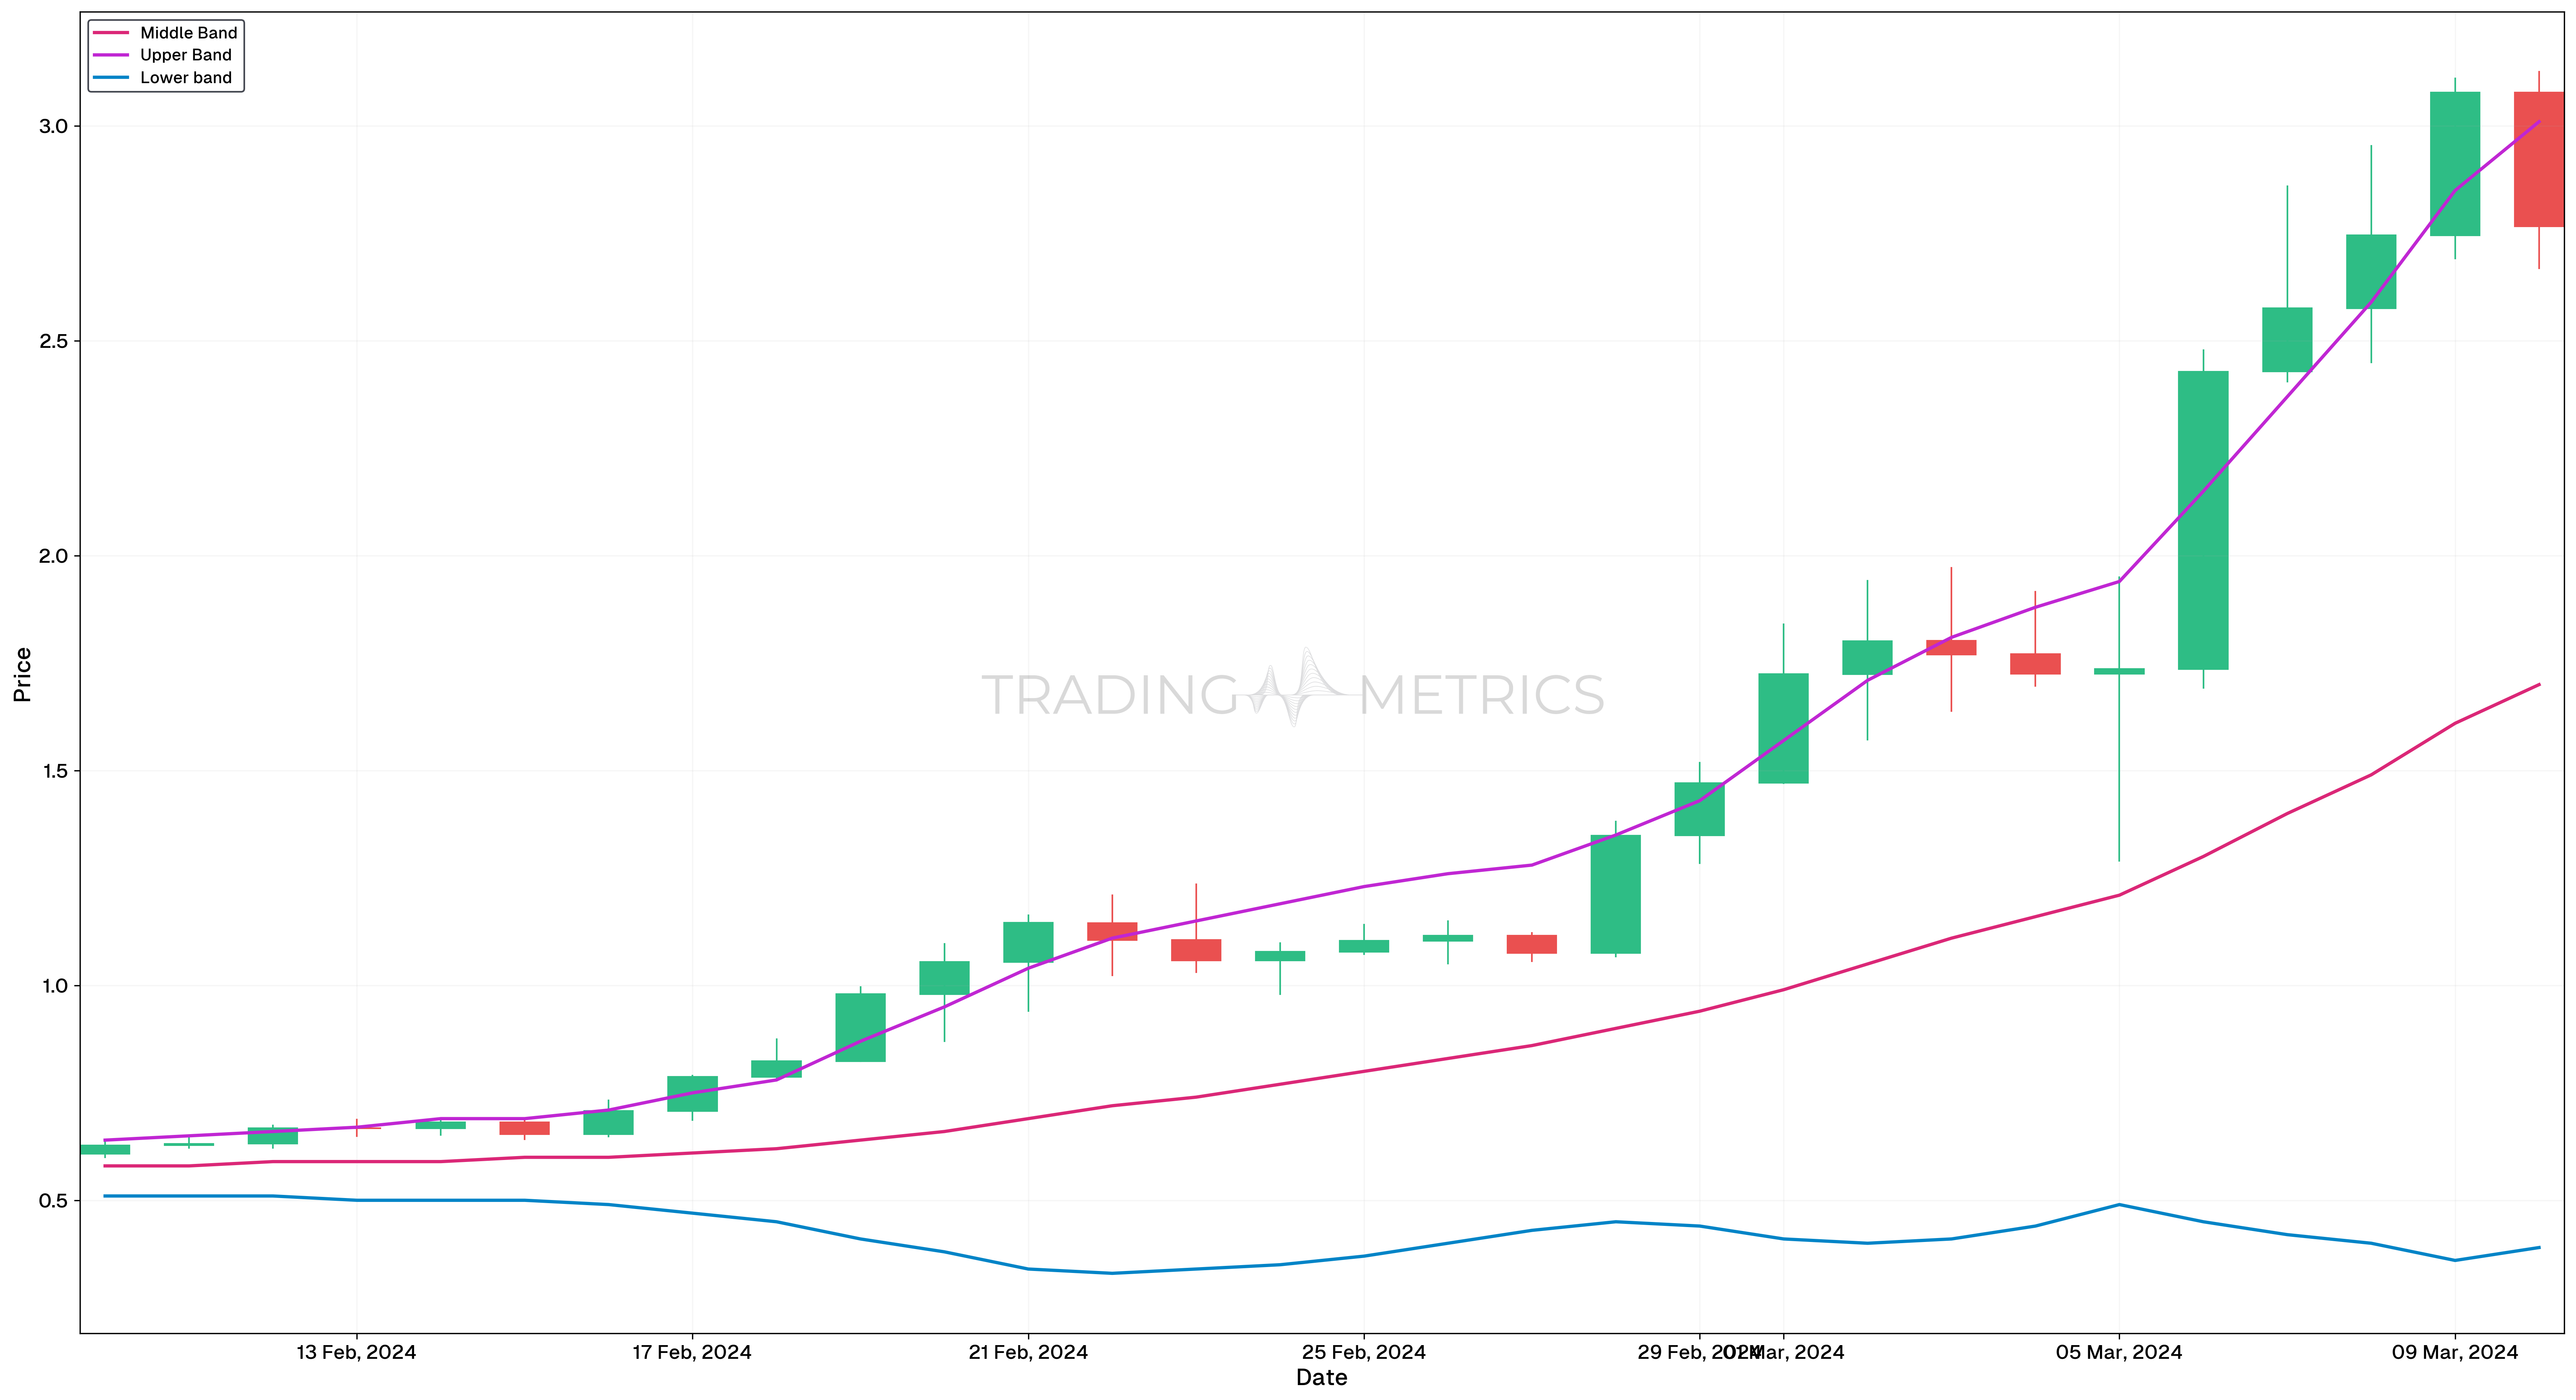
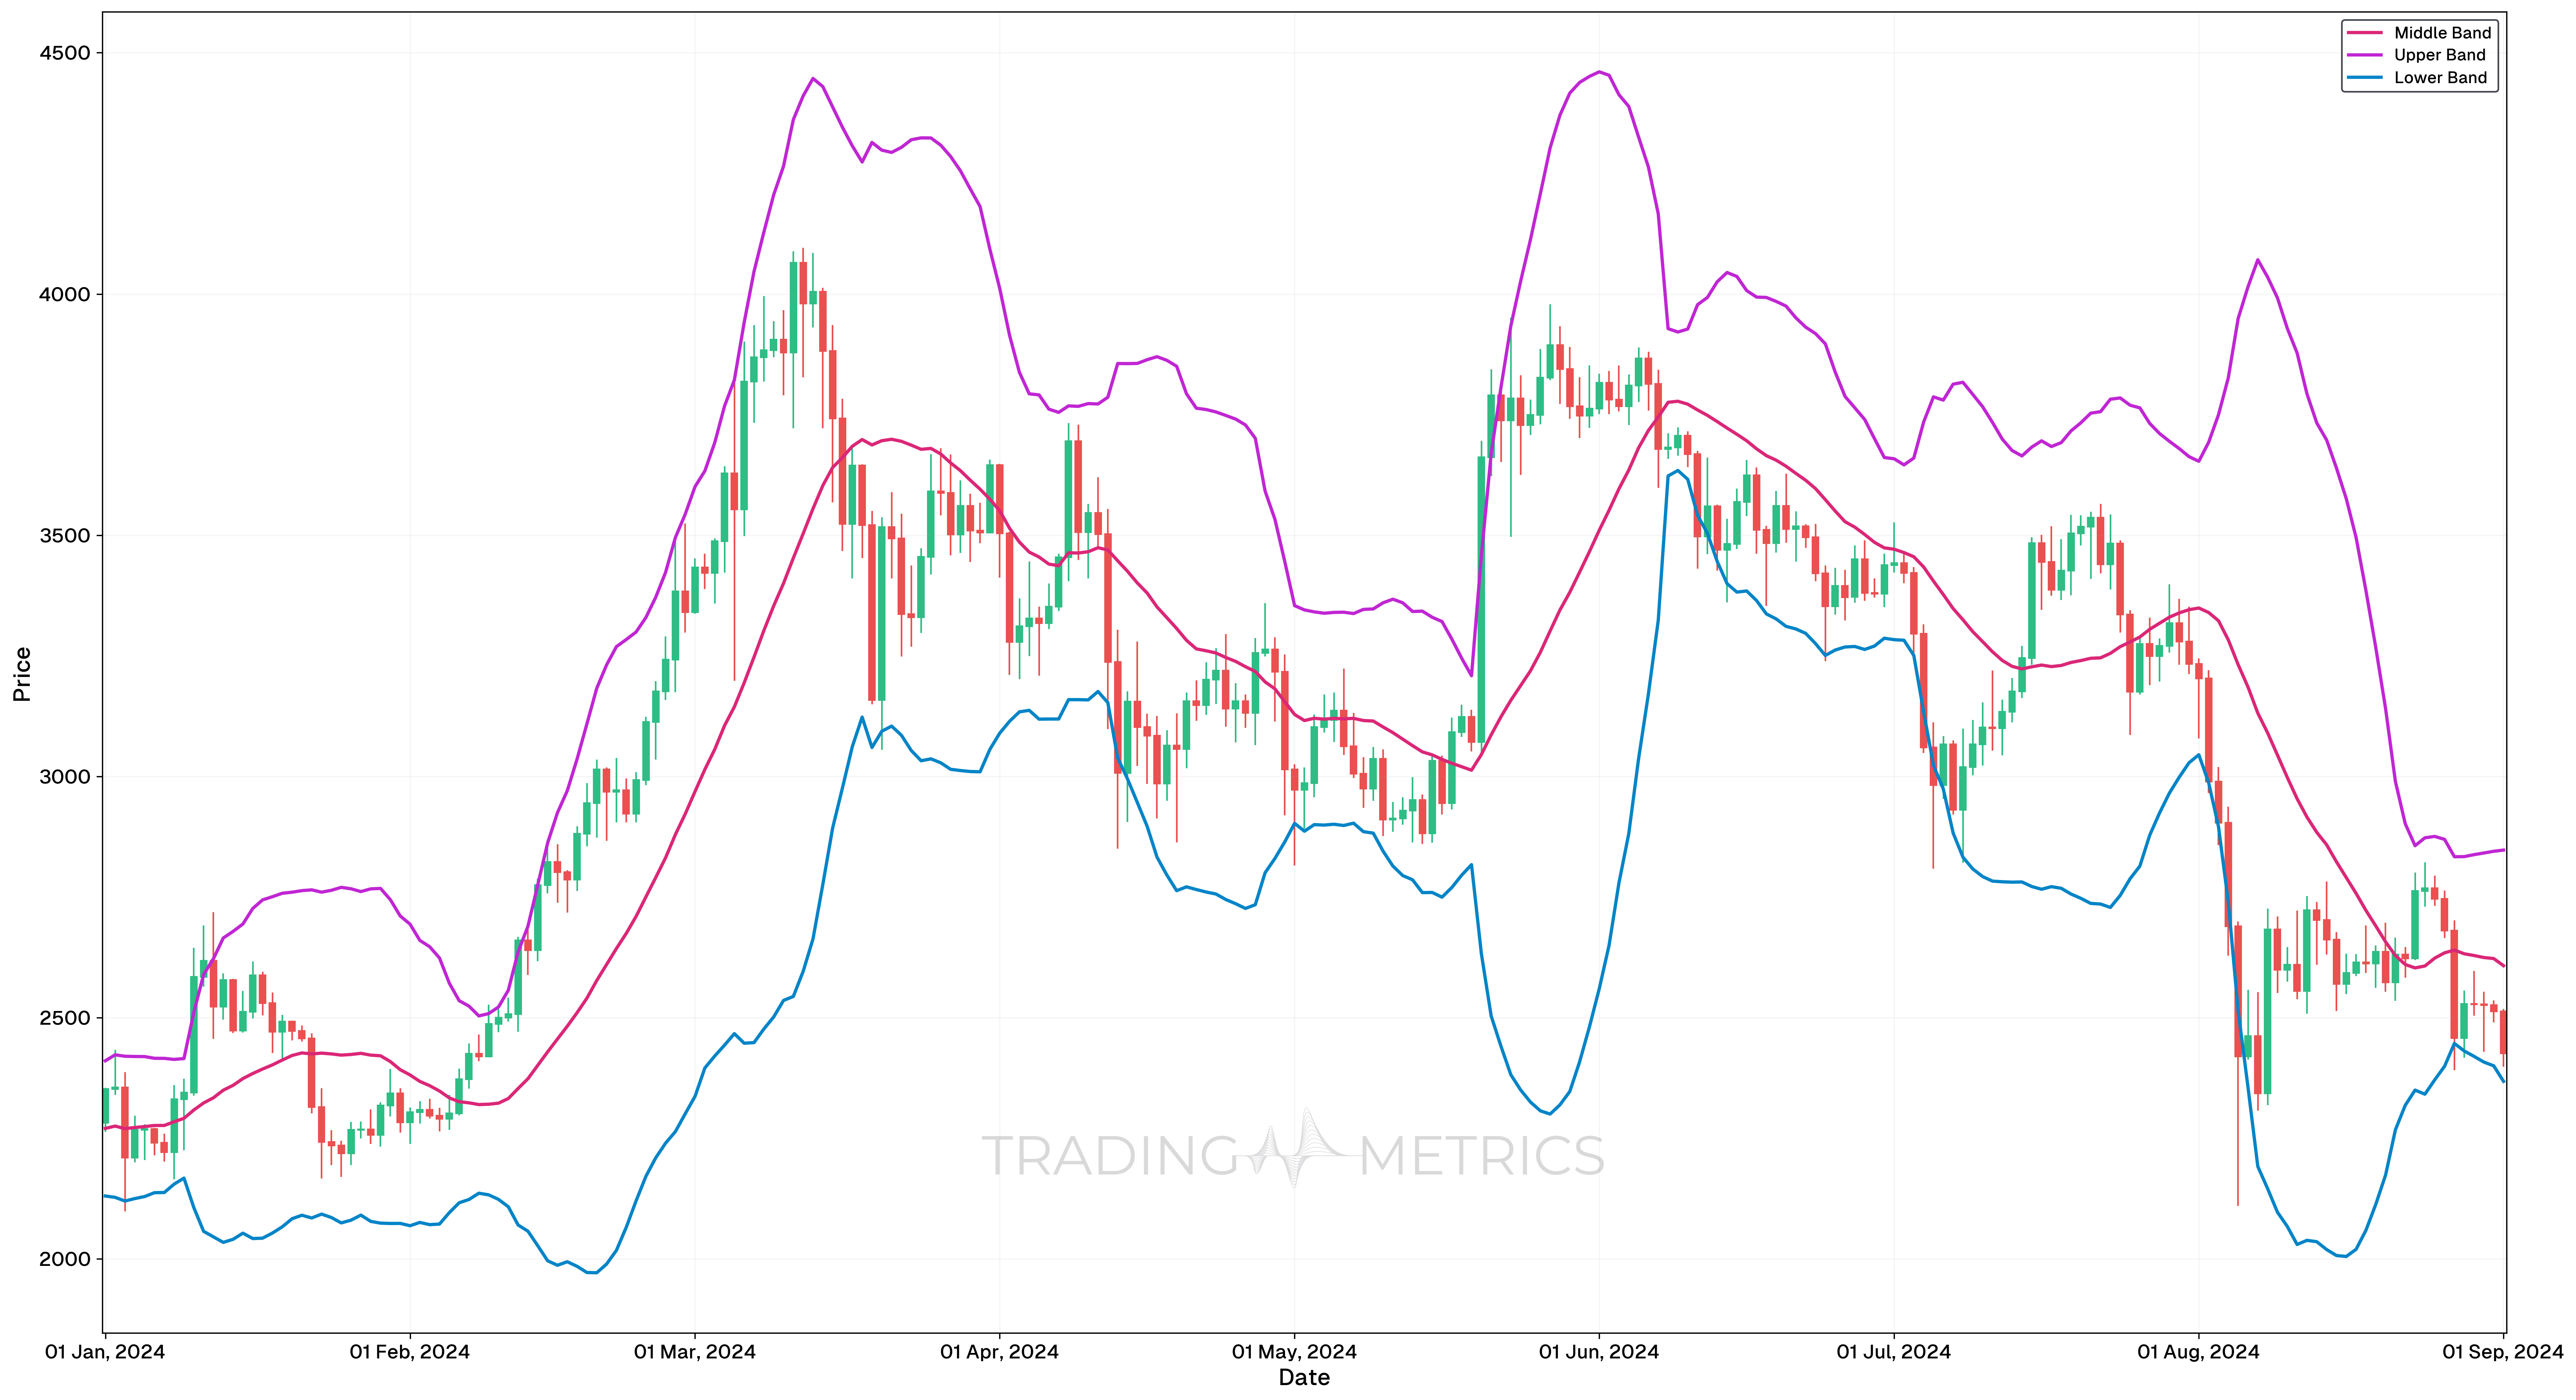
This candlestick chart for the FET/USDT trading pair, spanning from 10th February 2024 to 10th March 2024, demonstrates key price movements relative to the Bollinger Bands.
Throughout this period, the price frequently interacted with the upper Bollinger Band, signaling a strong uptrend. Several instances during this timeframe show the price “riding” the upper band, which is a classic indication of a bullish trend. Traders observing this would potentially follow the uptrend, waiting for confirmation tools, such as momentum indicators, to verify the trend’s strength.
The price touching the upper band multiple times during this range underscores that the uptrend remained robust until the price began pulling away from the upper band, at which point traders would closely monitor for potential reversals. The price behavior aligns with the trend-following strategy for Bollinger Bands, where sustained movement along one band (in this case, the upper) suggests that the trend will continue until significant deviation occurs.
Combining Bollinger Bands with Other Tools
For a more comprehensive analysis, Bollinger Bands can be combined with other technical indicators such as:
- Relative Strength Index (RSI): To confirm overbought or oversold conditions.
- MACD (Moving Average Convergence Divergence): To identify trend direction and strength.
- Volume: To confirm the strength of a price move.
Adapt to Market Conditions: Bollinger Bands settings can be adjusted based on the asset and market conditions. For example, more volatile assets might require different settings.
Key Points
- Volatility Indicator: Bollinger Bands measure price volatility by plotting a moving average (middle band) and two standard deviation-based bands (upper and lower) around it.
- Range Interpretation: Price near the upper band suggests overbought conditions while price near the lower band indicates oversold conditions.
- Mean Reversion: Prices tend to revert to the middle band (moving average) after reaching the upper or lower bands, offering potential trade opportunities.
- Breakout Signals: Breakouts above or below the bands can indicate strong momentum, though they require confirmation to avoid false signals.
- Volatility Analysis: Narrow bands signify low volatility (consolidation), often preceding sharp price movements, while wide bands indicate high volatility.
- Dynamic Support and Resistance: The upper and lower bands act as dynamic support and resistance levels, aiding in trade entry and exit decisions.
- Combine with Other Indicators: Use Bollinger Bands with momentum or trend indicators like RSI or MACD to validate signals and improve accuracy.
- Customizable Settings: Adjust the moving average period and standard deviation to align with specific trading styles or market conditions.
- Effective in Range-Bound and Trending Markets: In range-bound markets, trade the bounces off the bands. But in trending markets, use band breakouts as continuation signals.
- Backtesting and Fine-Tuning: Incorporate Bollinger Bands into backtesting to evaluate their effectiveness in various market environments and refine parameters for better performance.
Conclusion
Bollinger Bands are a valuable tool for identifying market conditions and potential trade opportunities. They help traders understand volatility and price trends, making them essential for both novice and experienced traders. By incorporating Bollinger Bands into your trading strategy and combining them with other indicators, you can gain a deeper insight into market behavior and improve your trading outcomes. Whether trading stocks like Apple or cryptocurrencies like Bitcoin, Bollinger Bands provide a reliable framework for making informed trading decisions.
Frequently Asked Questions
Quick answers based on this page's topic.
A squeeze occurs when the upper and lower bands constrict toward the midline, signaling a period of exceptionally low volatility. Historically, these periods are precursors to explosive price moves, alerting traders to prepare for a major breakout as volatility eventually expands.
In ranging markets, the outer bands act as dynamic resistance and support levels. When price touches or pierces these boundaries, it is considered statistically overextended, often signaling an opportunity to trade back toward the middle 20-period moving average.
Walking the bands happens when price consistently stays between an outer band and the middle moving average during a breakout. This signals an intense trend; traders should generally avoid fighting this momentum until the price clearly breaks back toward the center line.
When price touches the lower Bollinger Band and RSI simultaneously reads below 30, it creates a high-probability mean reversion setup. This dual confirmation filters out many false signals because both the price envelope and momentum oscillator agree that the asset is statistically oversold.
The default 20-period, 2-standard-deviation setting works for most assets on daily charts. For highly volatile assets like crypto, widening to 2.5 standard deviations reduces false signals. For intraday trading, shortening the period to 10 or 12 captures faster price action more accurately.