Beta: How Sensitive Is Your Portfolio to the Market?
Beta () is a measure of an asset’s volatility in relation to the overall market. In the world of finance and trading, it helps investors understand how much risk an asset carries compared to the market as a whole. A Beta value of 1 indicates that the asset’s price moves with the market. A Beta greater than 1 indicates higher volatility than the market, and a Beta less than 1 indicates lower volatility.
Beta is a useful tool, but it is only one piece of the puzzle in understanding risk and return.
- William J. Bernstein
How to Calculate Beta?
Beta is calculated using the formula:
Where:
-
is the covariance between the return of the asset and the return of the market .
-
is the variance of the market returns.
Match Beta to Your Risk Tolerance: Low-beta stocks offer stability, while high-beta stocks bring potential for higher returns and risks. Choose what suits your goals
Importance of Beta in Trading
Beta is crucial in trading as it helps in assessing the risk of an asset. Here are a few points highlighting its importance:
- Risk Assessment: Helps in determining the risk level of a particular asset in relation to the market.
- Portfolio Diversification: Assists in balancing a portfolio by mixing assets with different Beta values.
- Expected Returns: Investors can predict how an asset will perform in different market conditions.
Don’t Ignore the Market Beta: An index’s beta is always 1. Use this baseline to understand whether your asset outpaces or underperforms the market.
Comparing High and Low Beta
Let’s consider two hypothetical stocks: Stock A with a Beta of 1.5 and Stock B with a Beta of 0.5. We’ll analyze their performance relative to the market and explore trading strategies based on these Beta values.
| Beta | Stock vs Market |
|---|---|
> 1 | High Correlation, Higher Volatility |
1 | High Correlation, Same Volatility |
0 to 1 | Slight Correlation, Lower Volatility |
0 | No Correlation |
-1 to 0 | Slight Inverse Correlation, Lower Volatility |
-1 | High Inverse Correlation, Same Volatility |
< -1 | High Inverse Correlation, Higher Volatility |
High Beta Stock Trading
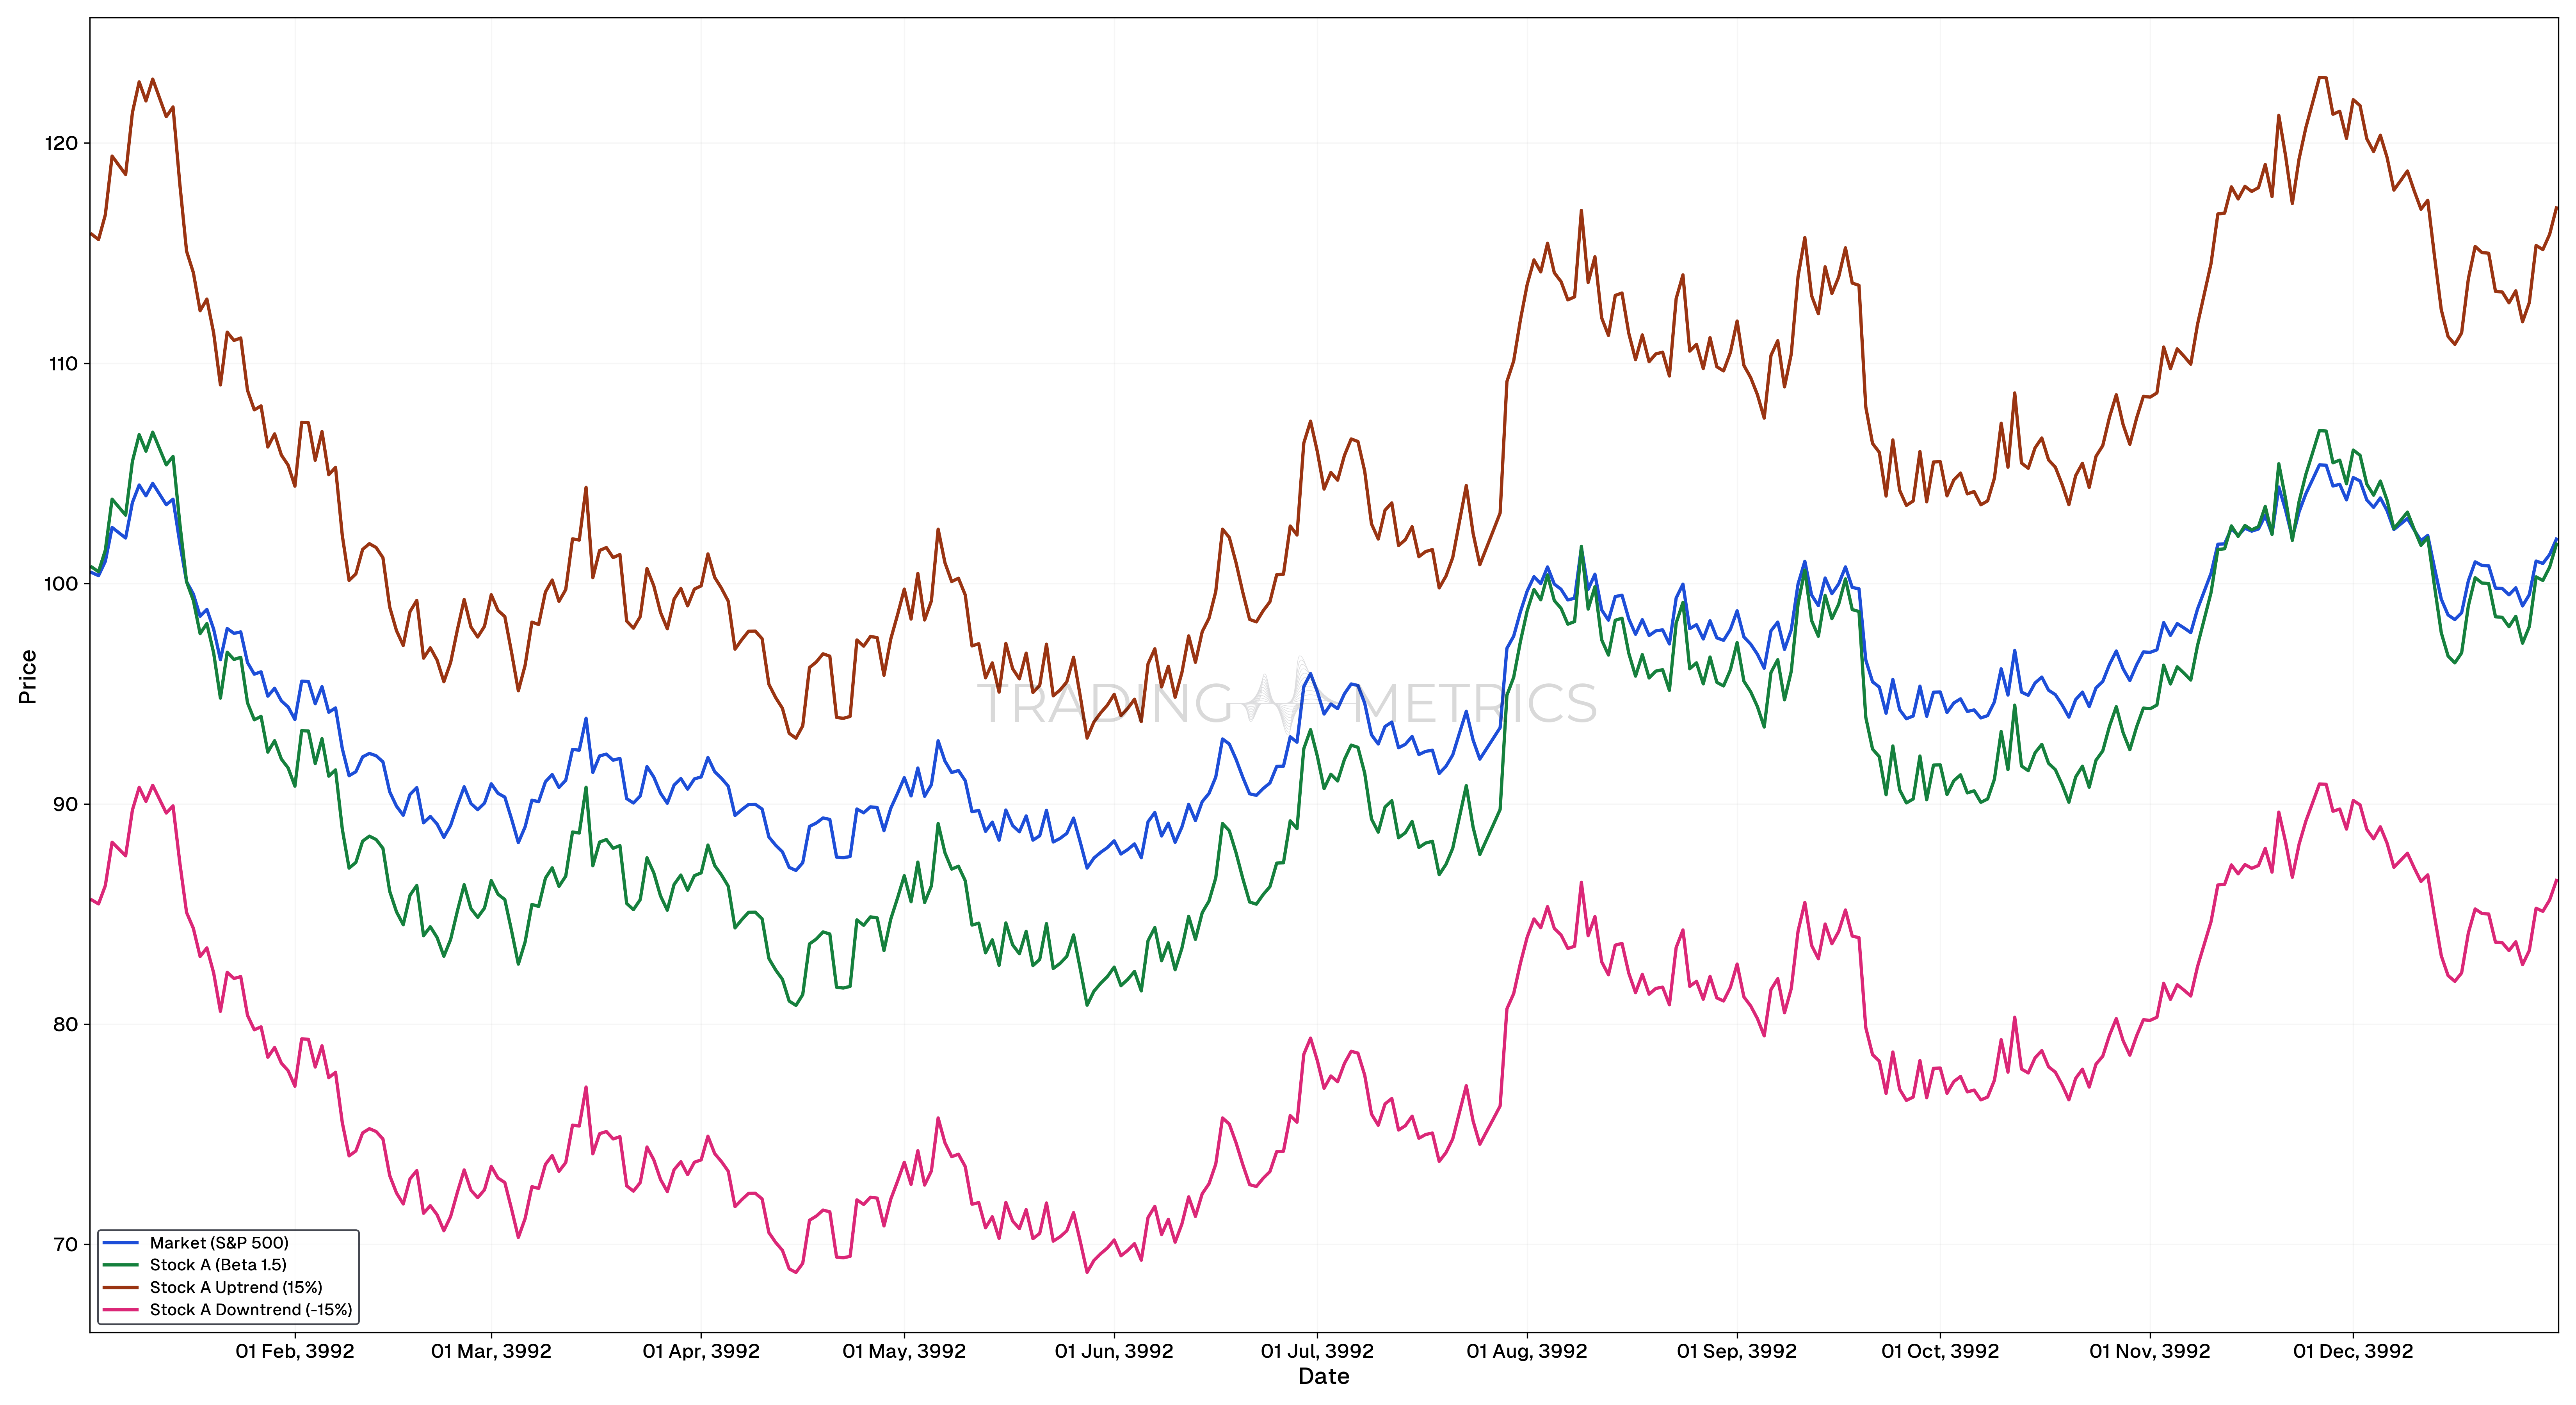
Consider an investor trading Stock A, which has a Beta of 1.5. This stock is 50% more volatile than the market. Suppose the investor anticipates a market uptrend based on economic data and decides to buy Stock A.
Trading Scenario: The market index (S&P 500) increased by 10%. Given that Stock A has a Beta of 1.5, its price is expected to increase by 15% (1.5 * 10%).
Analysis: When the market increases by 10%, Stock A increases by 15%, validating the higher beta value. An investor trading on this information could achieve higher returns by choosing high beta stocks during expected market uptrends.
Low Beta Stock Trading
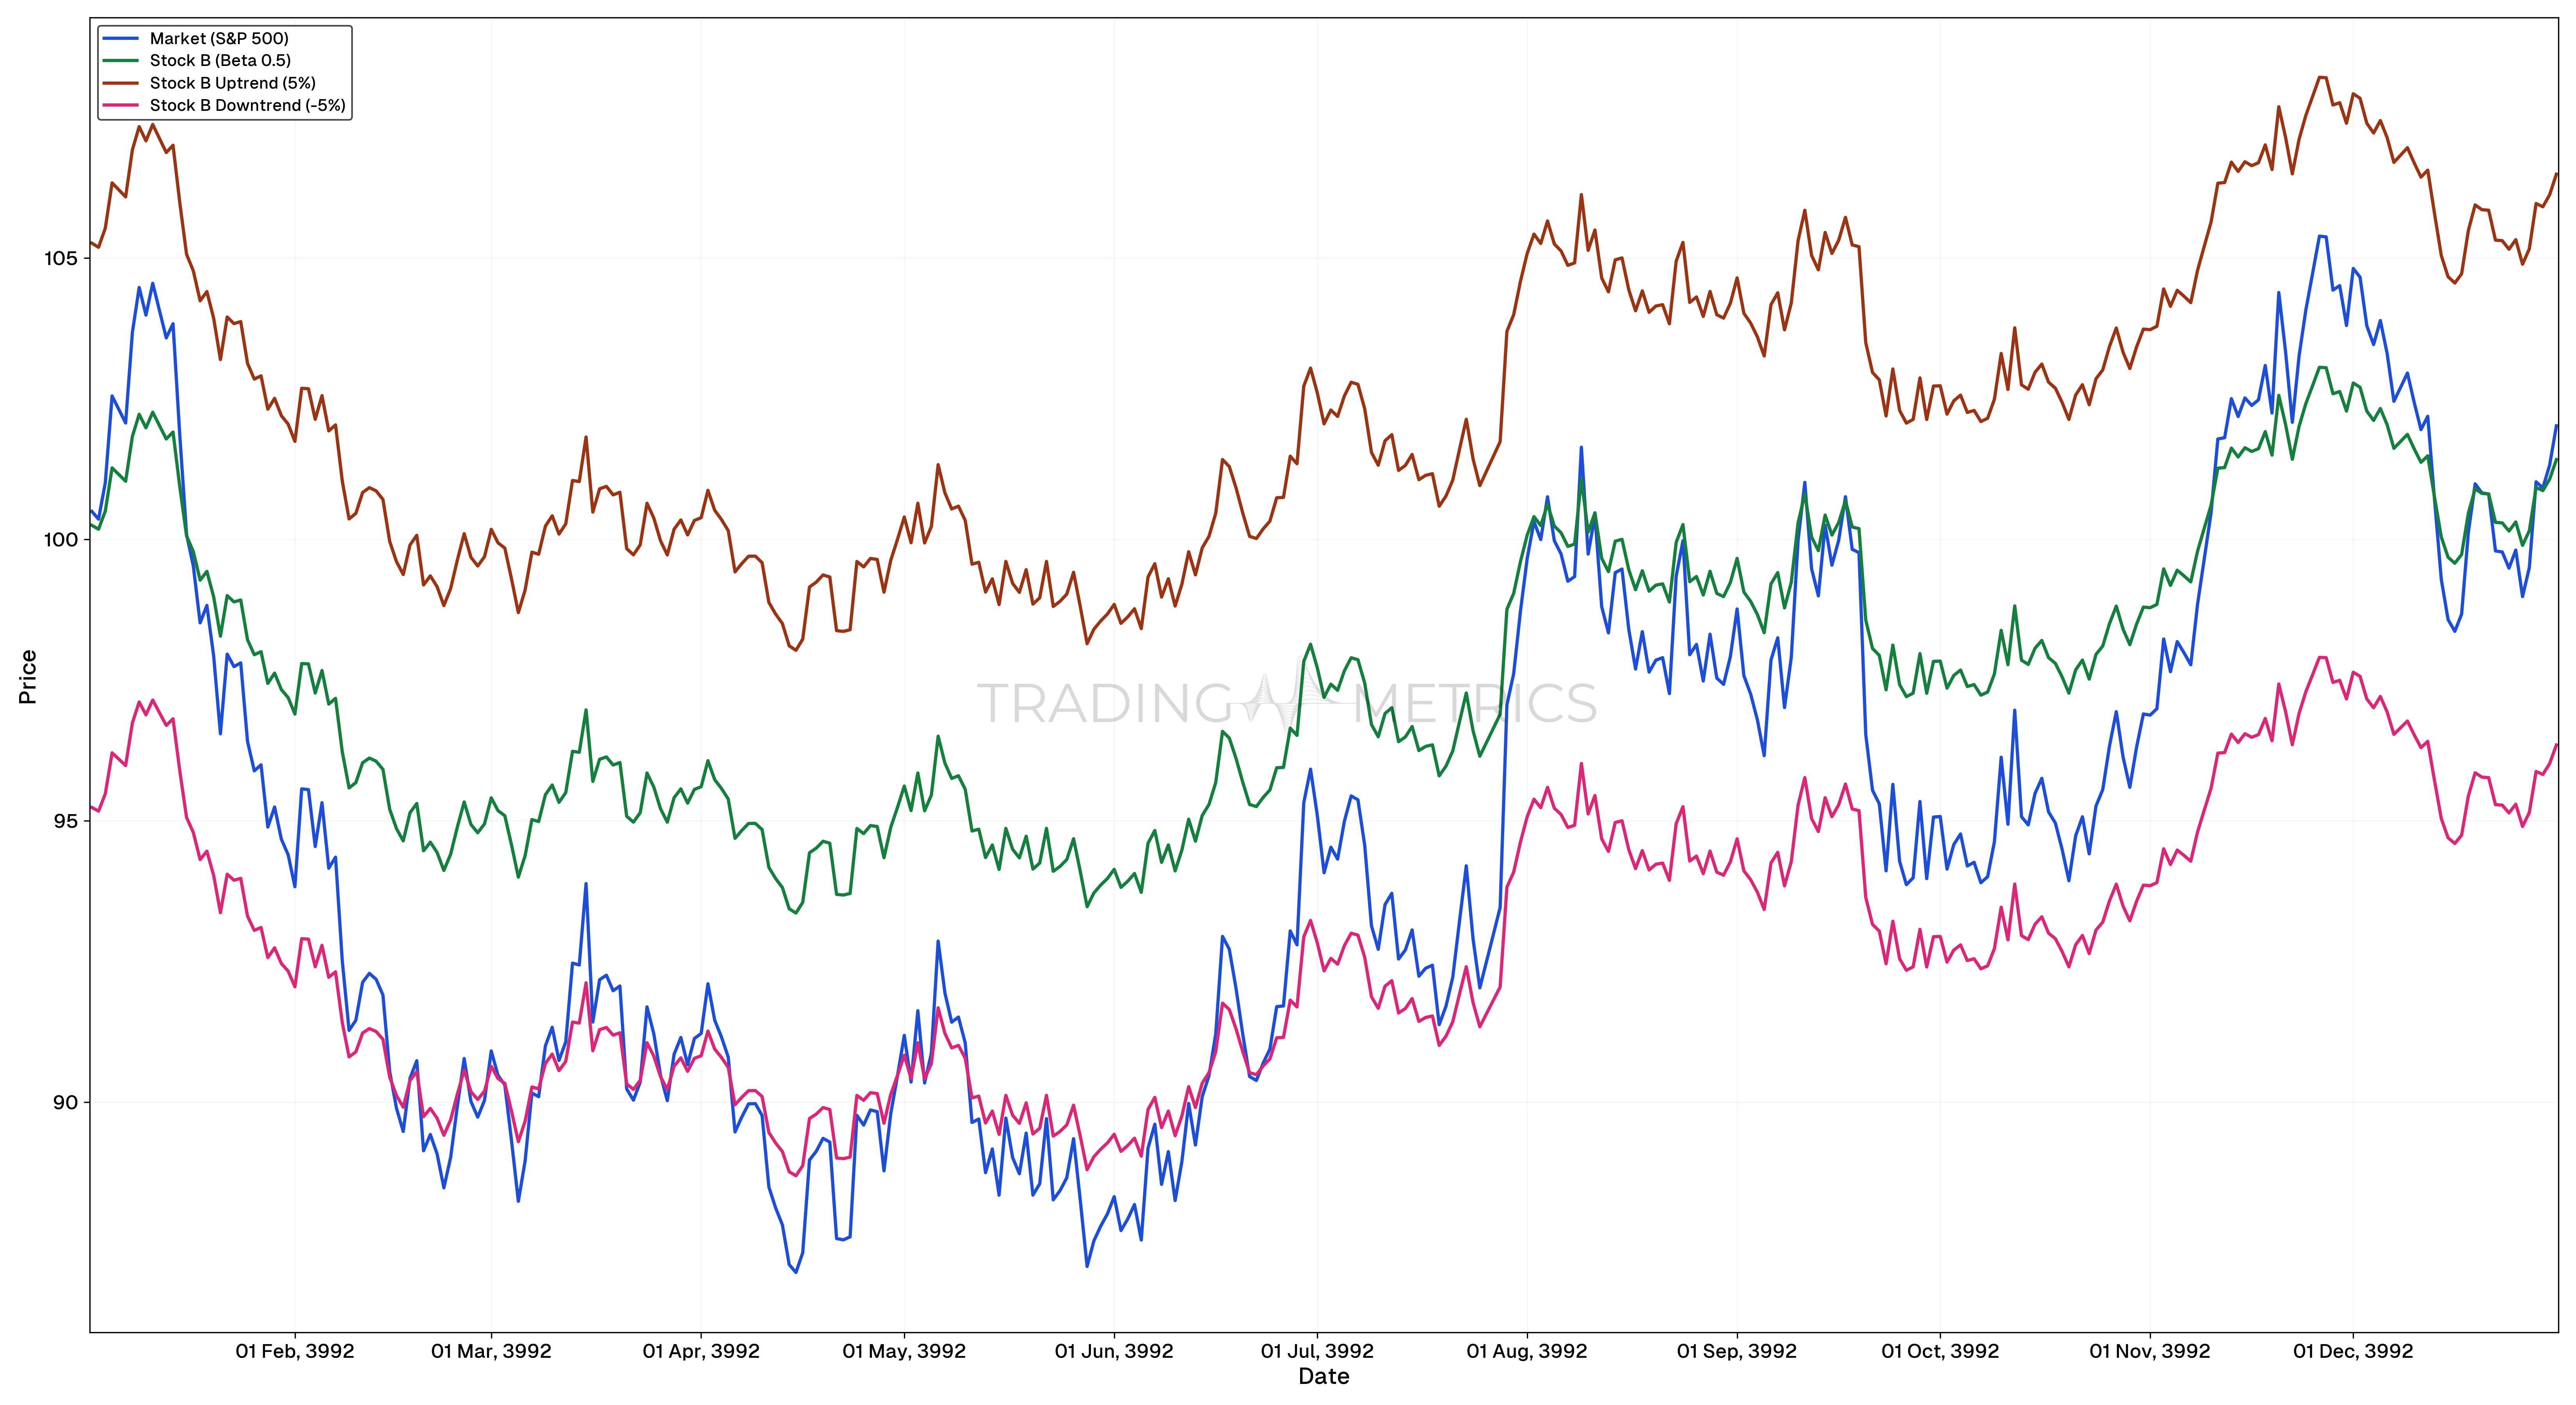
Now consider an investor trading Stock B, which has a Beta of 0.5. This stock is 50% less volatile than the market. Suppose the investor anticipates a market downturn and prefers a less risky asset.
Trading Scenario:
-
Market Movement: Market index (S&P 500) decreases by 10%.
-
Expected Movement of Stock B: Since Stock B’s Beta is 0.5, its price is expected to decrease by 5% (0.5 * 10%).
Analysis: When the market decreases by 10%, Stock B decreases by only 5%, showing its lower volatility. An investor trading on this information might choose low beta stocks to minimize losses during market downturns.
By analyzing Beta, investors can gauge the potential risk and reward of a stock relative to the market. High Beta stocks, like Stock A, can offer higher returns during market upswings but come with greater risk. Low beta stocks, like Stock B, provide more stability and are ideal for conservative investors seeking to protect their investments during market downturns.
By understanding and utilizing beta, investors can make more informed trading decisions that align with their risk tolerance and market outlook.
Customize Strategies with Beta: High-beta assets are ideal for momentum trades, while low-beta options excel in defensive or stable portfolios.
Combining Beta with Other Tools
Beta alone doesn’t provide a complete picture. Here are some tools to combine with Beta for better insights:
-
Alpha: Measures the asset’s performance relative to the market. While Beta shows volatility, Alpha shows how much better or worse the asset performed compared to market expectations.
-
Standard Deviation: Provides a sense of the total volatility of an asset, not just in relation to the market.
-
Sharpe ratio: Helps in understanding the return per unit of risk.
-
Correlation Coefficient: Shows how two assets move in relation to each other, helping in diversification strategies.
Beta and Sector Sensitivity: Sector trends influence beta tech stocks typically have higher betas, while utilities lean towards lower betas.
Key Points
- Market Sensitivity: Beta measures an asset’s sensitivity to overall market movements, with a beta of 1 indicating movement in line with the market.
- Low Beta Assets: Assets with beta < 1 are less volatile than the market, offering stability during turbulent conditions.
- High Beta Assets: Assets with beta > 1 are more volatile than the market, providing greater potential returns but also higher risk.
- Negative Beta: A negative beta indicates an inverse relationship with the market, often seen in assets like gold or certain hedging instruments.
- Portfolio Diversification: Including assets with varying beta values helps balance risk and performance based on market conditions.
- Contextual Importance: Beta is most useful when analyzing stocks in the context of a well-defined benchmark, like the S&P 500.
- Applicability to Strategy: Low beta stocks suit conservative, income-focused strategies, while high beta stocks align with growth or speculative strategies.
- Limitations of Beta: Beta is backward-looking and does not account for future changes in company fundamentals or market conditions.
- Combined with Volatility: While beta measures correlation to the market, combining it with volatility metrics provides a fuller risk profile.
- Economic and Sector Impact: Certain sectors, like technology, tend to have higher betas, while defensive sectors, like utilities, often exhibit lower betas.
Conclusion
Beta is a important tool in the arsenal of any trader or investor, providing a gauge for market-related risk. When used alongside other metrics like Alpha, Standard Deviation, and the Sharpe ratio, Beta helps in constructing well-balanced portfolios and making informed investment decisions. By understanding and utilizing Beta, traders can better navigate the volatile world of trading, making more informed and strategic decisions.
Frequently Asked Questions
Quick answers based on this page's topic.
A Beta of 1.5 means the asset is 50% more volatile than the benchmark. If the market rises by 10%, your asset is theoretically expected to rise by 15%. However, this also works on the downside, making high-beta assets riskier during market corrections.
Low-beta assets (values below 1.0) offer stability and capital preservation. They are less sensitive to market-wide panics, making them ideal for defensive portfolios. By mixing low-beta assets with higher-risk ones, traders can achieve a more balanced and psychologically manageable equity curve.
A negative beta indicates an inverse relationship with the market. Assets like Gold often exhibit negative or zero beta, meaning they may move upward when the stock market falls. Traders use negative-beta assets as 'hedges' to protect their portfolios during systemic financial stress.