Trading the Island Reversal: A Two-Gap Trap for Trend Followers
The Island Reversal is a powerful reversal signal in technical analysis, appearing at the end of an uptrend or downtrend. It forms when price gaps in one direction, consolidates in a small range, and then gaps the opposite way, leaving an “island” of candles stranded. This pattern signals a sharp shift in control — from bulls to bears in a bearish island reversal, or from bears to bulls in a bullish island reversal. When spotted, it gives traders an early opportunity to enter in the new trend direction, whether short or long.
How to Identify the Island Reversal Pattern in Trading
The Island Reversal is a candlestick gap pattern that marks a sharp trend reversal. It traps price in an “island” separated by gaps on both sides, then flips momentum when the second gap breaks in the opposite direction. It can appear as a bearish reversal at the top of an uptrend or a bullish reversal at the bottom of a downtrend. Here’s the step-by-step guide.
Start with the Big Picture
This pattern shows up after a sustained trend. A sudden gap in the direction of the trend stalls into an island, then another gap flips momentum, signaling an abrupt reversal.
Trace the Gap Structure
The formation unfolds in three phases:
- First Gap: A gap in the direction of the prevailing trend.
- Island: A cluster of candles isolated by the gaps, showing stalling or indecision.
- Second Gap: A gap in the opposite direction, leaving the island stranded.
Zero in on the Confirmation Level
The confirmation level is the extreme of the first gap (its high in a bearish reversal, its low in a bullish reversal). A close beyond this point validates the pattern.
Watch the Reversal Move
The signal is confirmed when price closes past the extreme of the first gap after the second gap forms. This is your entry point in the new trend direction.
Check Volume for Additional Confirmation
Volume behavior often follows a sequence:
- Spikes on the first gap as momentum peaks.
- Drops during the island while price stalls.
- Surges again on the second gap, confirming the reversal with conviction.
Gap Span: Measure the height of the island range or use nearby support/resistance levels to project a realistic price target from the second gap’s close in the direction of the reversal.
How to Trade the Island Reversal (Bearish) Pattern (Trading Example)
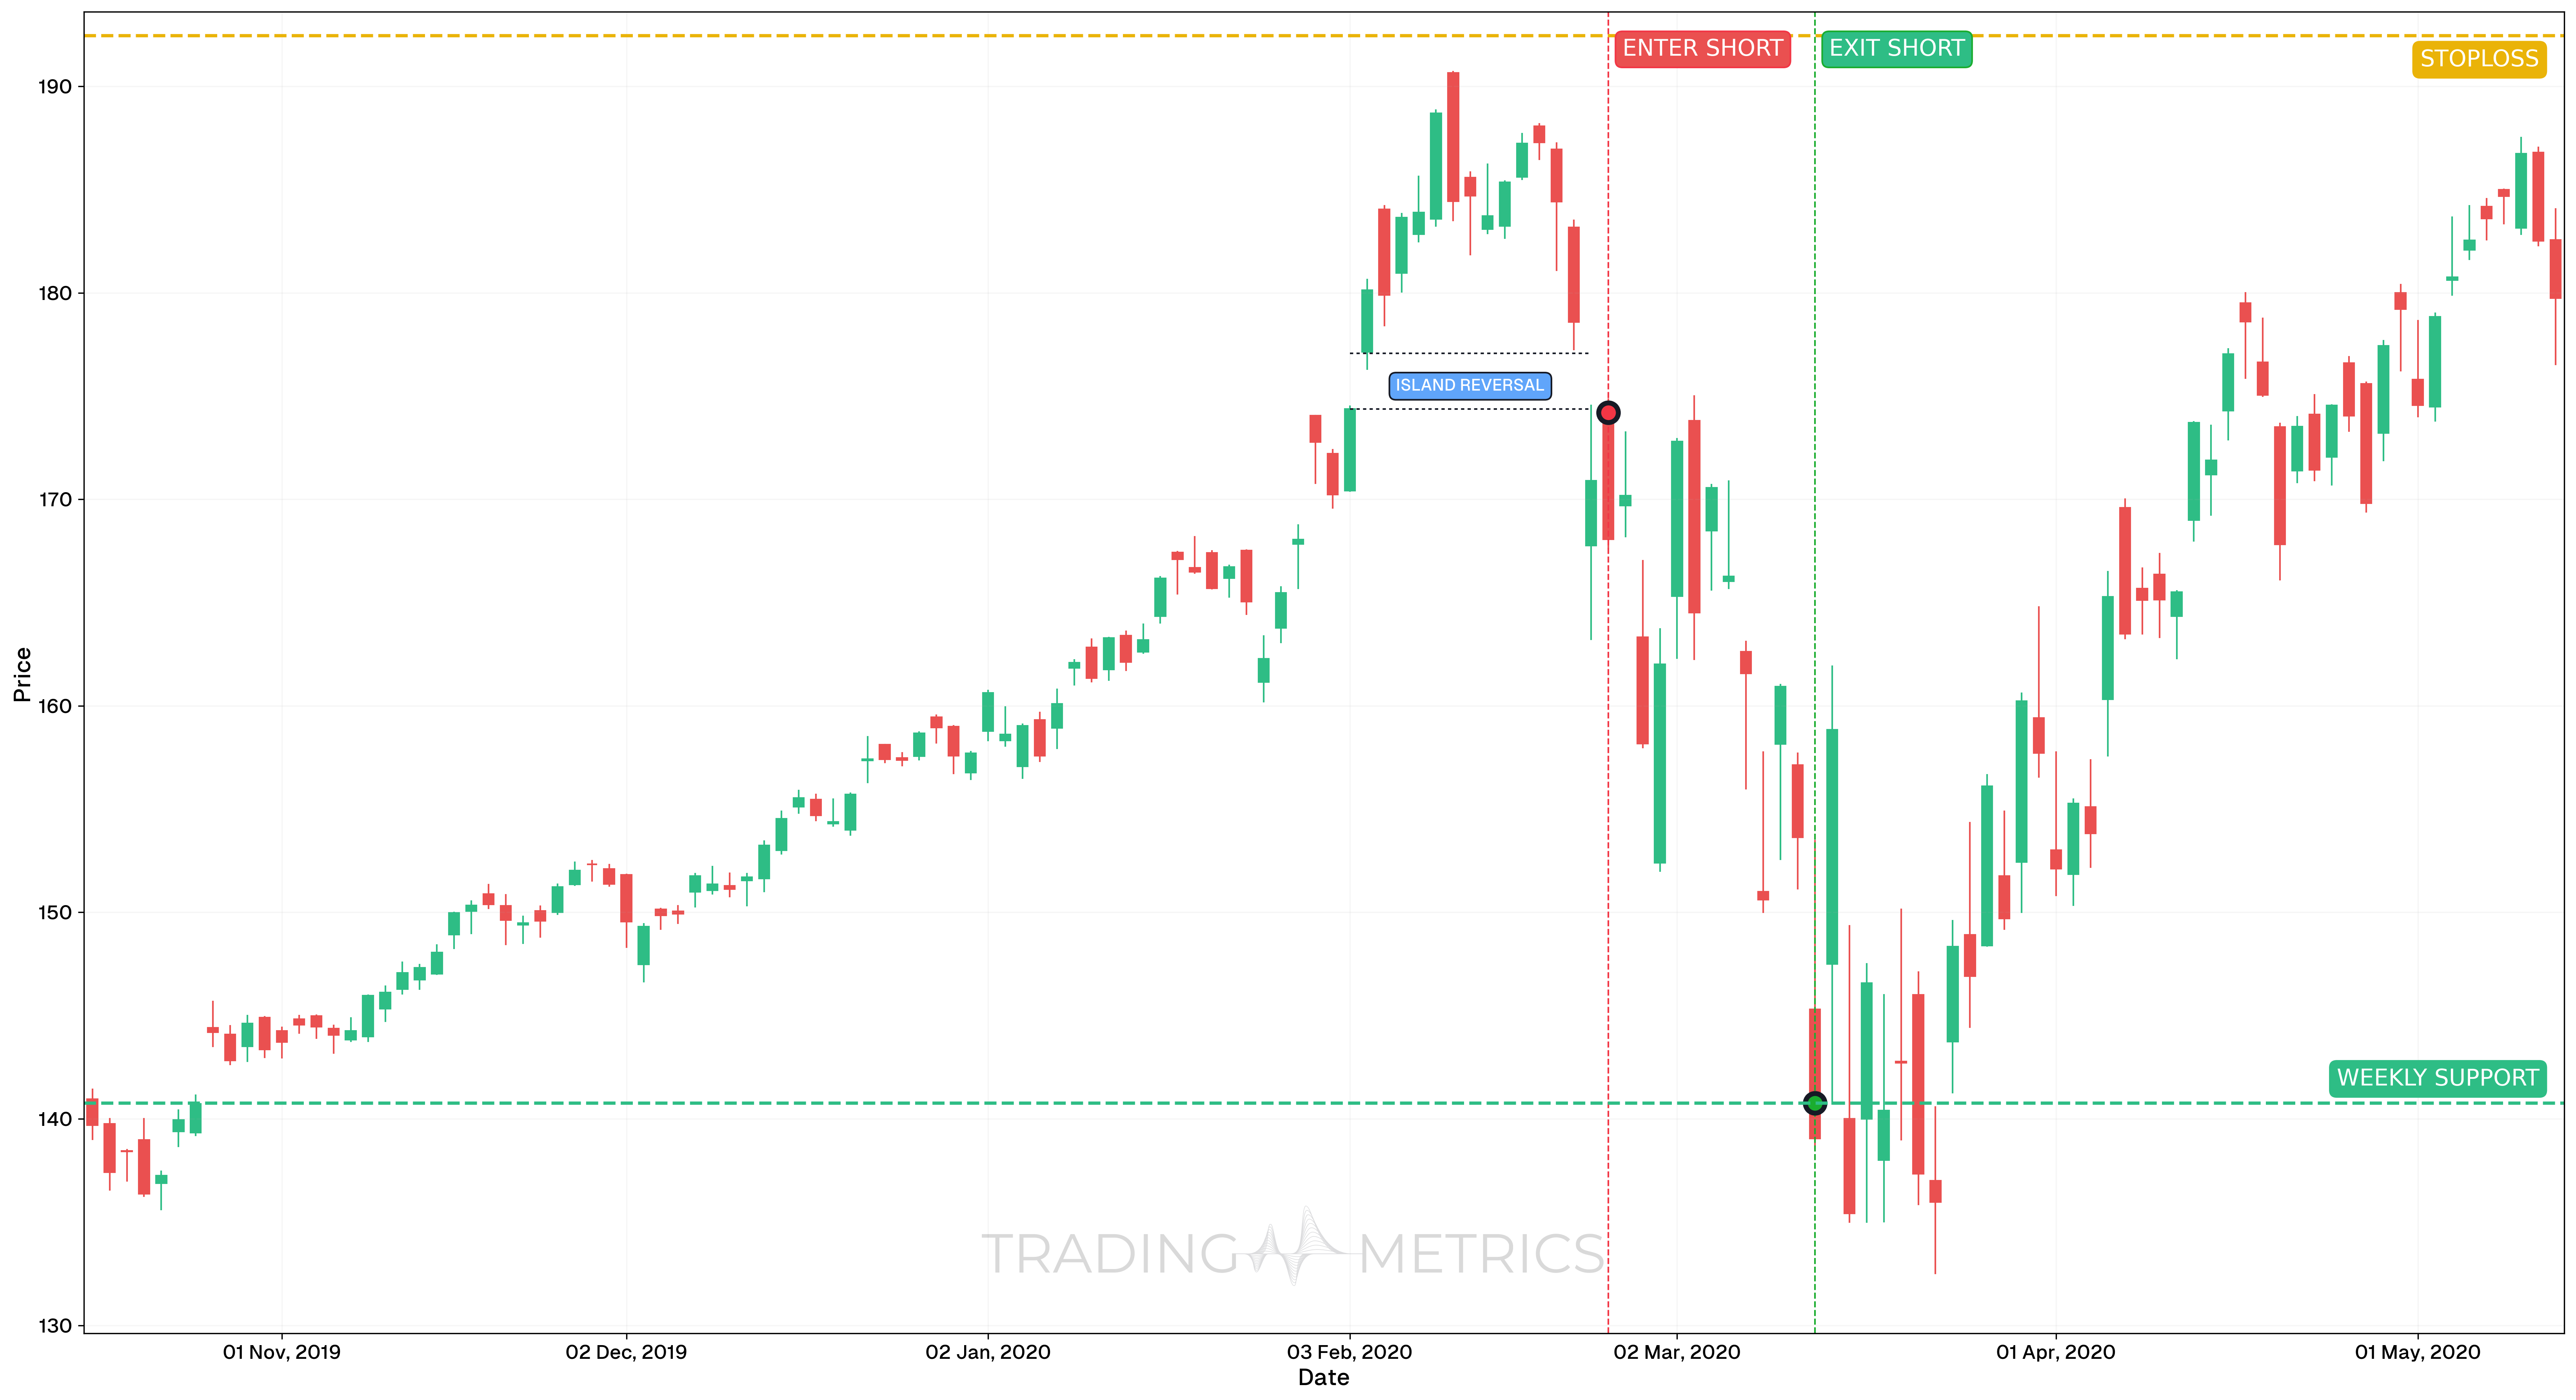
This trade demonstrates the Island Reversal (Bearish) using the MSFT chart on the daily timeframe. The pattern occurred during the early stages of the 2020 market correction and was followed by a sharp decline.
Analysis
On February 25, 2020, MSFT completed a textbook Island Reversal (Bearish), with a gap up, a brief isolated price zone, and then a gap down, creating a trapped long scenario. This gap-down initiated a breakdown from a short-term distribution zone, accelerating bearish momentum.
The pattern coincided with macro-level uncertainty, compounding the signal’s impact.
Trade Setup
-
Entry: The trade was entered on February 25, 2020, at $174.20, immediately after the gap down confirmed the bearish island. Confirmation included:
-
Exit: The position was closed on March 12, 2020, at $140.76, near a weekly support zone, locking in a substantial portion of the decline.
-
Outcome: The trade captured a large part of the corrective move, following confirmation of the Island Reversal (Bearish).
Risk Management
- Stop-Loss placement: The stop-loss was set at $192.46, just above the isolated “island” price range. A break above this zone would invalidate the pattern.
- Risk-Reward Ratio: 1:1.83 – this was a lower Risk-Reward Ratio trade due to market volatility, but still offered structured risk with confirmed momentum.
- Position sizing: Calculated with a 2% capital risk model, based on the distance between entry and stop.
- Volatility Consideration: The entry followed a volatility spike, which is typical for island patterns, and allowed for clean downside momentum after confirmation.
- Momentum Confirmation: Both RSI and StochRSI supported bearish momentum during the gap breakdown, strengthening conviction in the trade setup.
Volume Drop: A volume spike on the gaps, fading post-island, sinks the pattern into a bearish plunge.
How to Trade the Island Reversal (Bullish) Pattern (Trading Example)
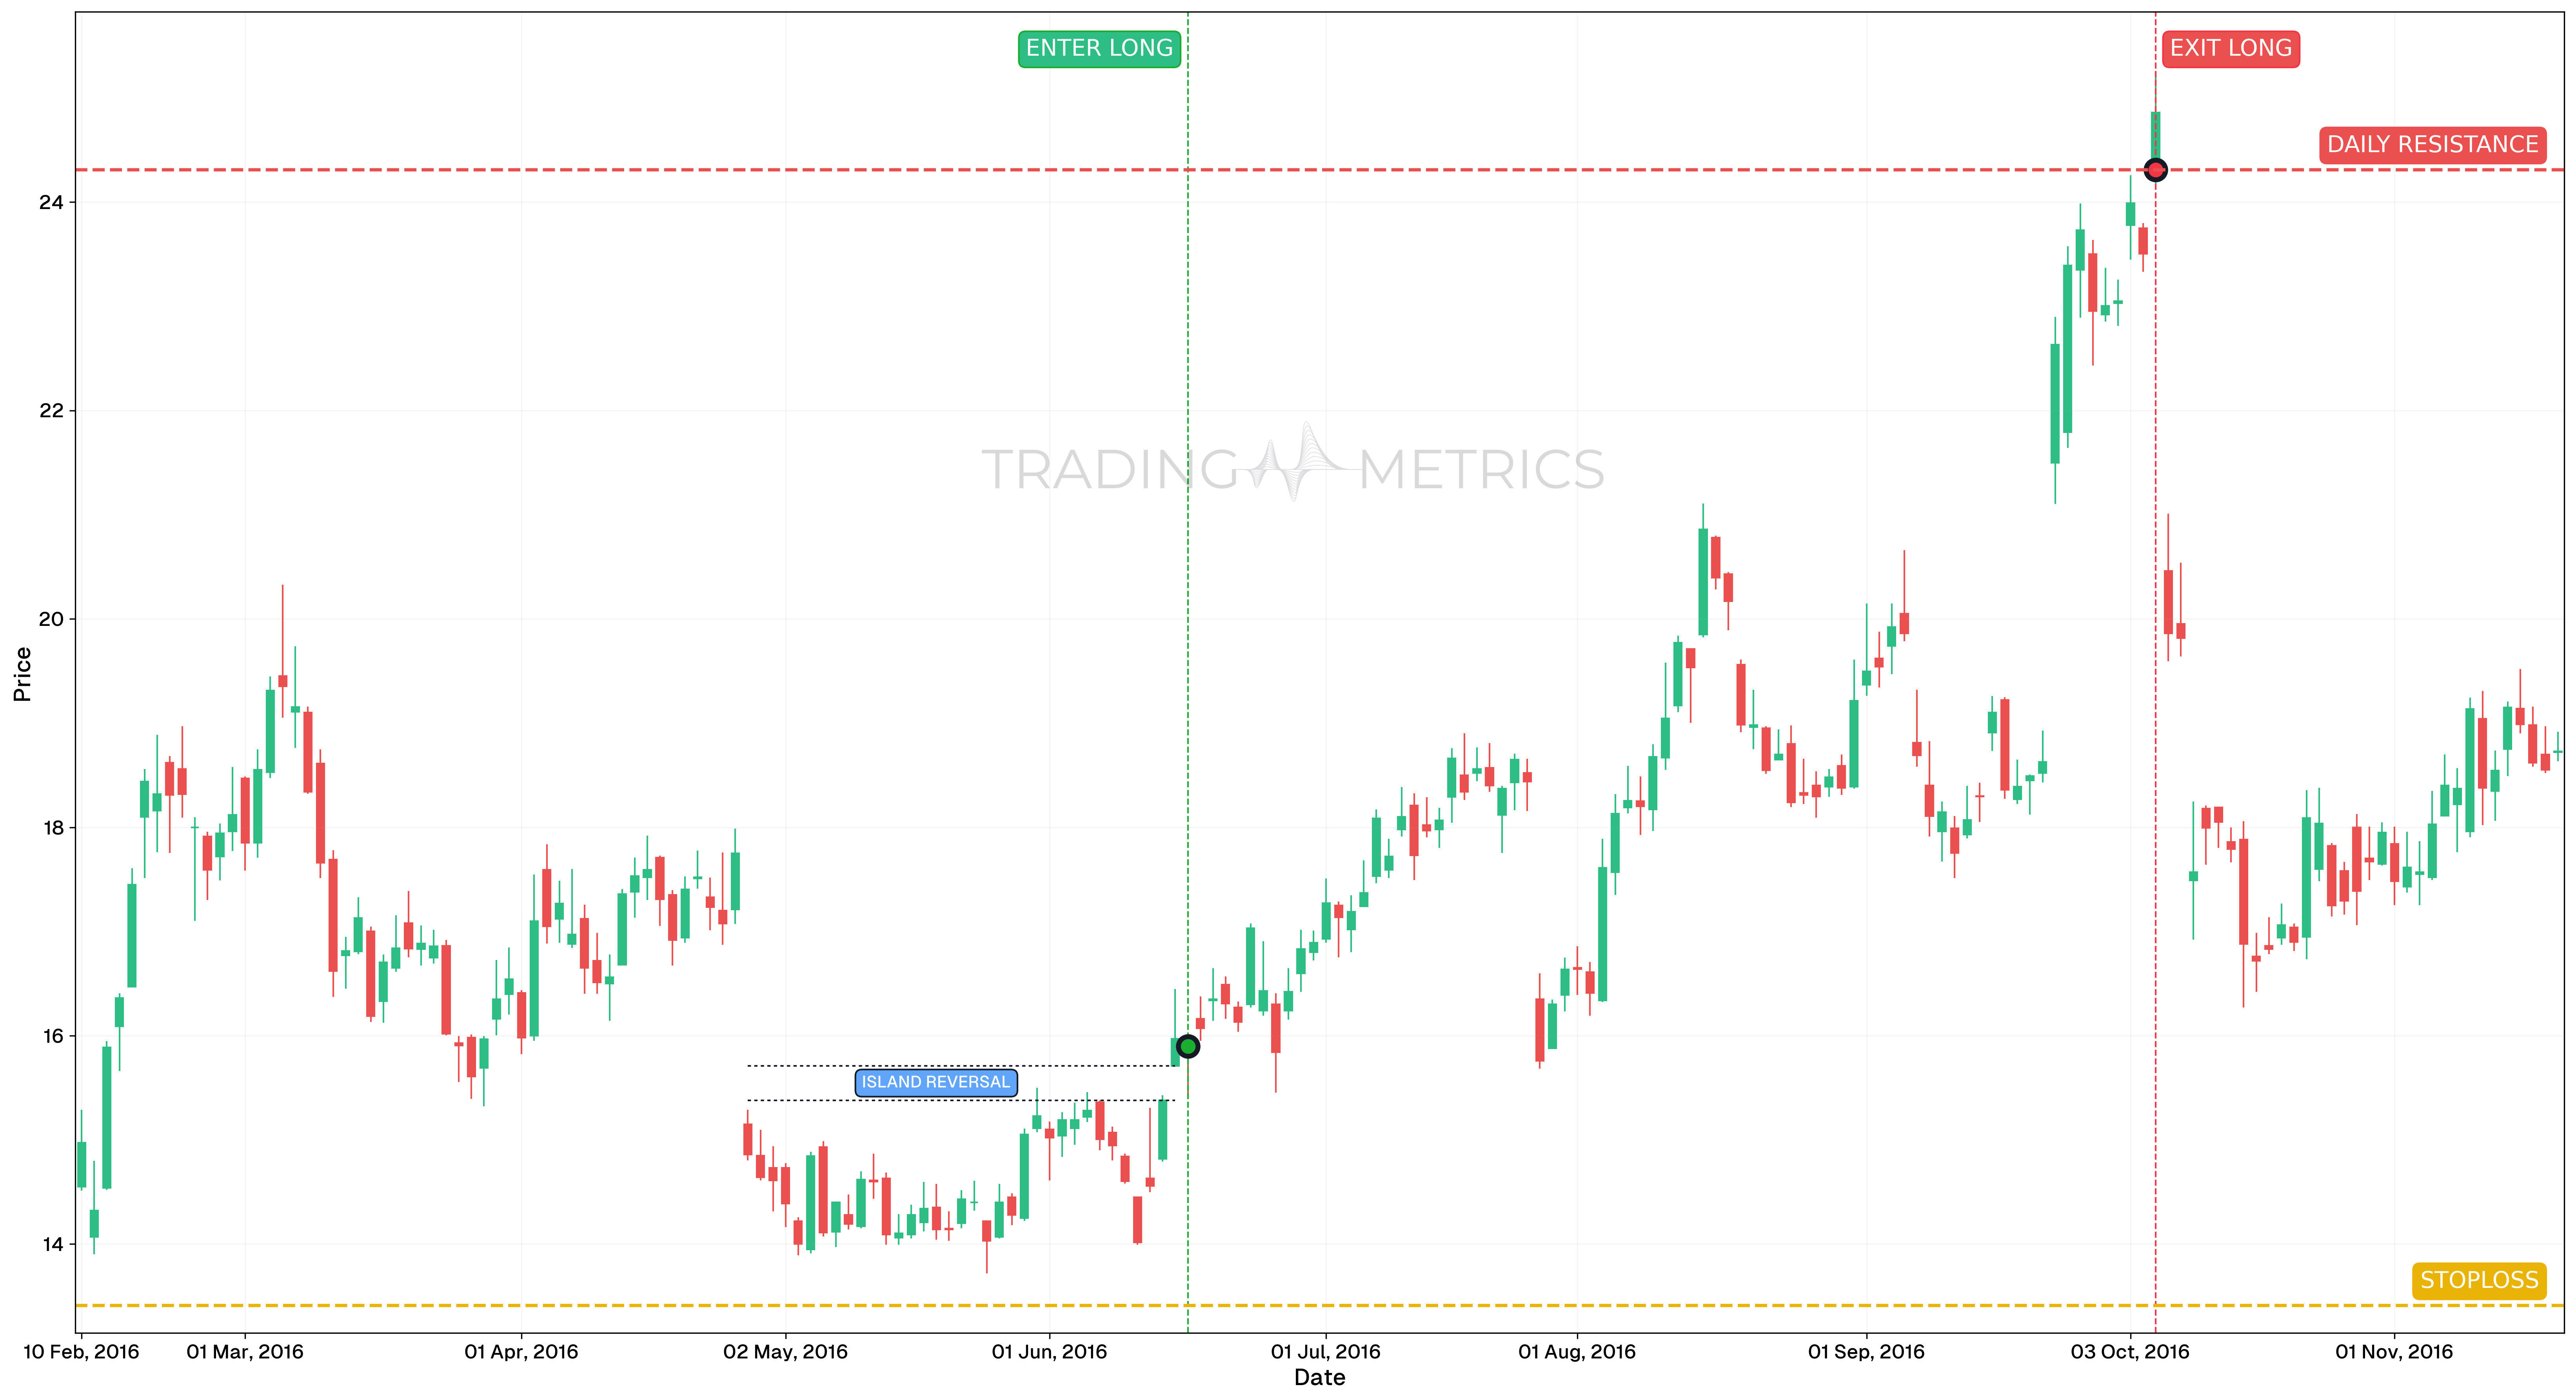
This example demonstrates the Island Reversal (Bullish) pattern using the TWTR chart on a 12-hour timeframe. This rare pattern marked a clean bottoming structure, leading into a multi-month uptrend.
Analysis
On June 16, 2016, TWTR printed an Island Reversal (Bullish) following a prolonged downtrend. This structure was characterized by a gap down, a range-bound island of candles, and a subsequent gap up - trapping bears and signaling a strong reversal.
The pattern was followed by a clean directional rally, aligning with improving Momentum Indicators.
Trade Setup
-
Entry: The trade was entered on June 16, 2016, at $15.9, immediately after the gap up confirmed the island structure. Entry was backed by:
-
Exit: The position was exited at $24.31 on October 5, 2016, near a major daily resistance zone.
-
Outcome: This Island Reversal setup provided a clean and early entry into a significant upside move, capturing nearly the entire leg.
Risk Management
- Stop-Loss placement: The stop-loss was placed at $13.41, just below the island base. A break below would invalidate the reversal signal.
- Risk-Reward Ratio: 1:3.38 – offering high reward with clearly defined risk parameters.
- Position sizing: Executed with a 2% capital risk model, depending on the entry-to-stop distance.
- Volatility Consideration: This pattern often emerges after a volatility spike, and the gap reversal traps short positions, creating potential for strong follow-through.
- Momentum Confirmation: Confirmation through both RSI and StochRSI improved conviction and helped avoid false reversals.
Pre-Trade Checklist
Boost Confirmation: Combine the pattern with volume surges and technical indicators like RSI to avoid false signals and increase your odds.
Key Points
- Gap Isolation: Two gaps with an island between them boost reliability — overlaps weaken it.
- Time Frame: Most effective on daily or weekly charts after strong prior trends.
- Combine with Indicators: Use moving averages or RSI for confirmation.
- Breakout Confirmation: A close beyond the first gap’s extreme validates the reversal — watch the second gap’s follow-through.
- Price Target: Measure the island height or use support/resistance levels to set realistic targets.
- Risk Management: Place a stop-loss just beyond the island’s edge (above for bearish, below for bullish) to protect against failure.
Wait for Confirmation: Entering before the second gap forms risks a false island signal — let it fully establish first.
Conclusion
The Island Reversal pattern is a striking tool for spotting major reversals in either direction. Its isolated “island,” when paired with volume, RSI, and moving averages, helps traders catch turning points with confidence. Whether in crypto, stocks, or forex, it sharpens your edge. Stay disciplined, manage risk, and let the island form — that stranded zone could be the start of a powerful new trend.
Frequently Asked Questions
Quick answers based on this page's topic.
Its reliability stems from total participant entrapment. A cluster of price action is completely isolated by two opposing gaps, creating a 'psychological island.' This structure forces those who entered during the island phase to liquidate immediately, fueling a sharp move in the new direction.
A Bearish Island occurs at peaks (gap-up followed by a gap-down), while a Bullish Island occurs at bottoms (gap-down followed by a gap-up). The 'island' must have no price overlap with the surrounding candles, proving an abrupt and total shift in market sentiment.
The most technical stop-loss is placed just beyond the edge of the island. For a bearish setup, place the stop above the island's highest peak. If the price returns to the island range, the 'abandonment' thesis is invalidated, and the previous trend may still be active.