Gann Box: Mapping Time and Price With Geometric Ratios
The Gann Box is a powerful trading tool developed by the legendary trader W.D. Gann, who was known for his innovative methods in market analysis. It’s a unique blend of geometry, time, and price, offering traders a way to project future market movements based on past data. The Gann Box isn’t just a grid; it’s a framework that helps you visualize how time and price can move in harmony, enabling you to spot potential trend reversals, support and resistance levels, and market cycles.
Start with Higher Timeframes: If you’re new to the Gann Box, practice on higher timeframes where patterns are clearer and more reliable.
How to Use Gann Box
Using the Gann Box involves plotting it over a specific swing high and swing low to create a visual representation of time-price symmetry. Here’s a simplified step-by-step guide:
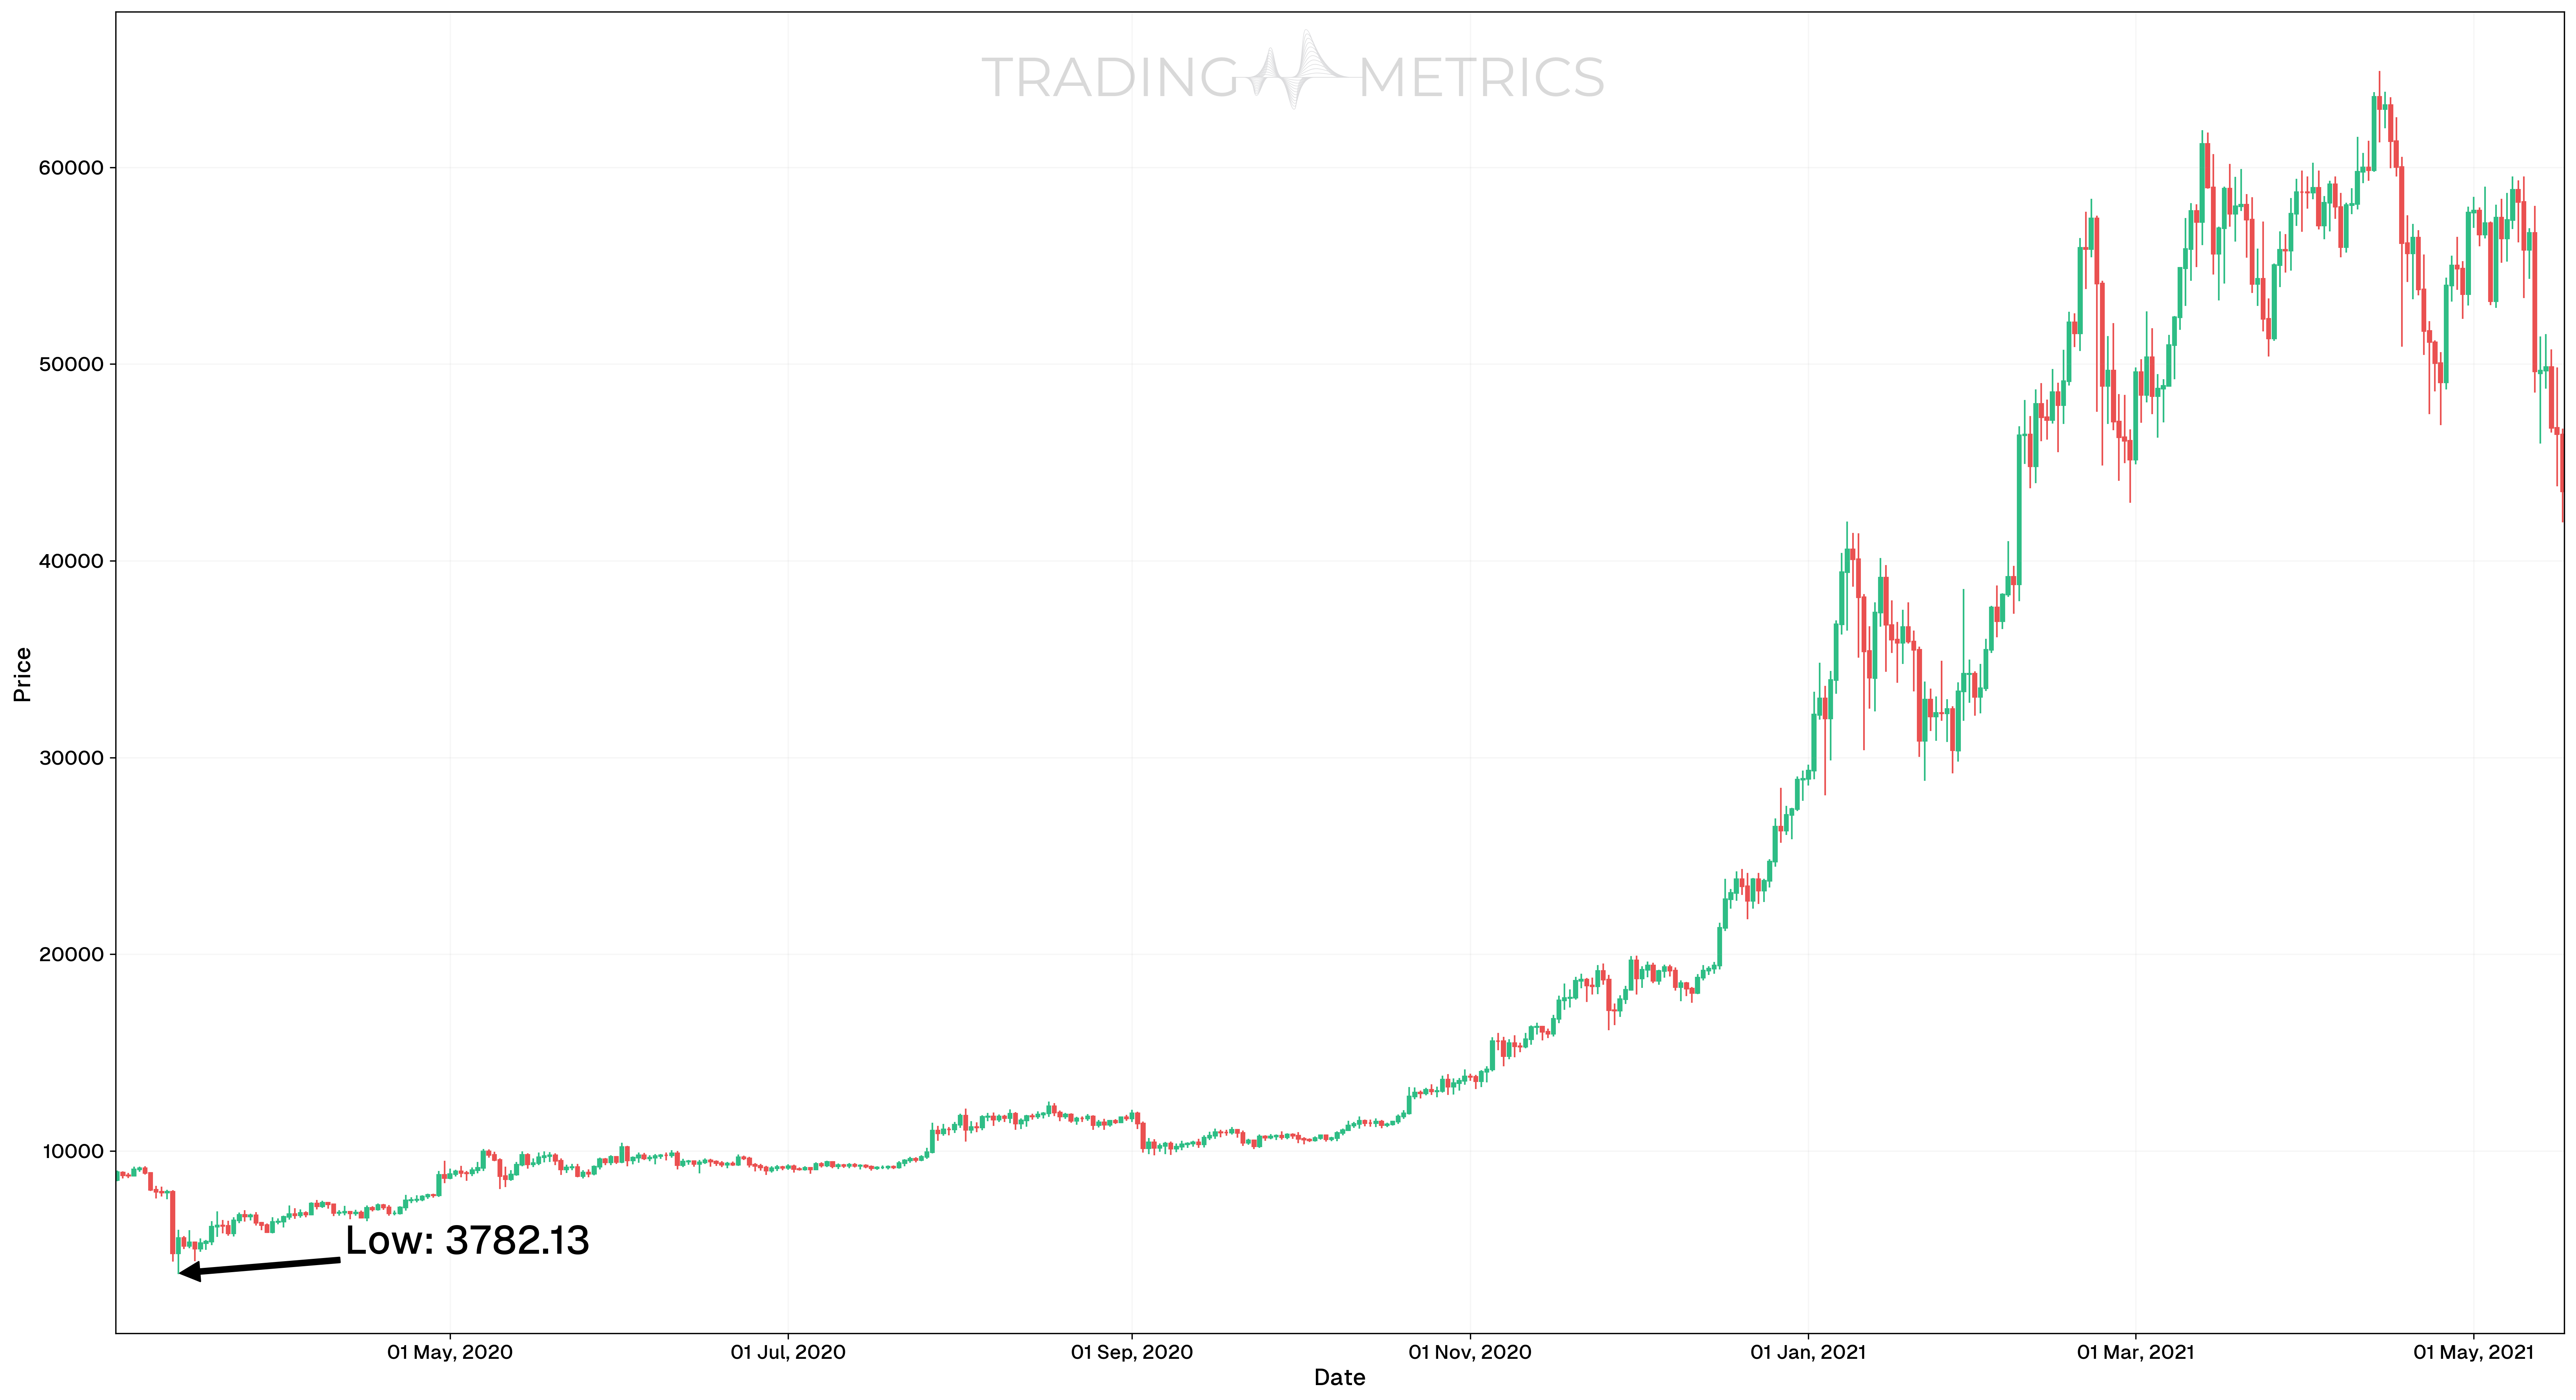
Identify Your Starting Point (First Point)
Begin by selecting a significant low in the price movement. This should be a notable low that marks the start of an important upward or downward trend.
Position the Second Point (Ending Point)
Place the second point at the height of a significant high that represents the end of the current trend or major swing. Ensure this second point is extended to the right of the high, positioning the 50% level at this significant high. This setup allows you to project potential future price movements and retracements beyond the current trend.
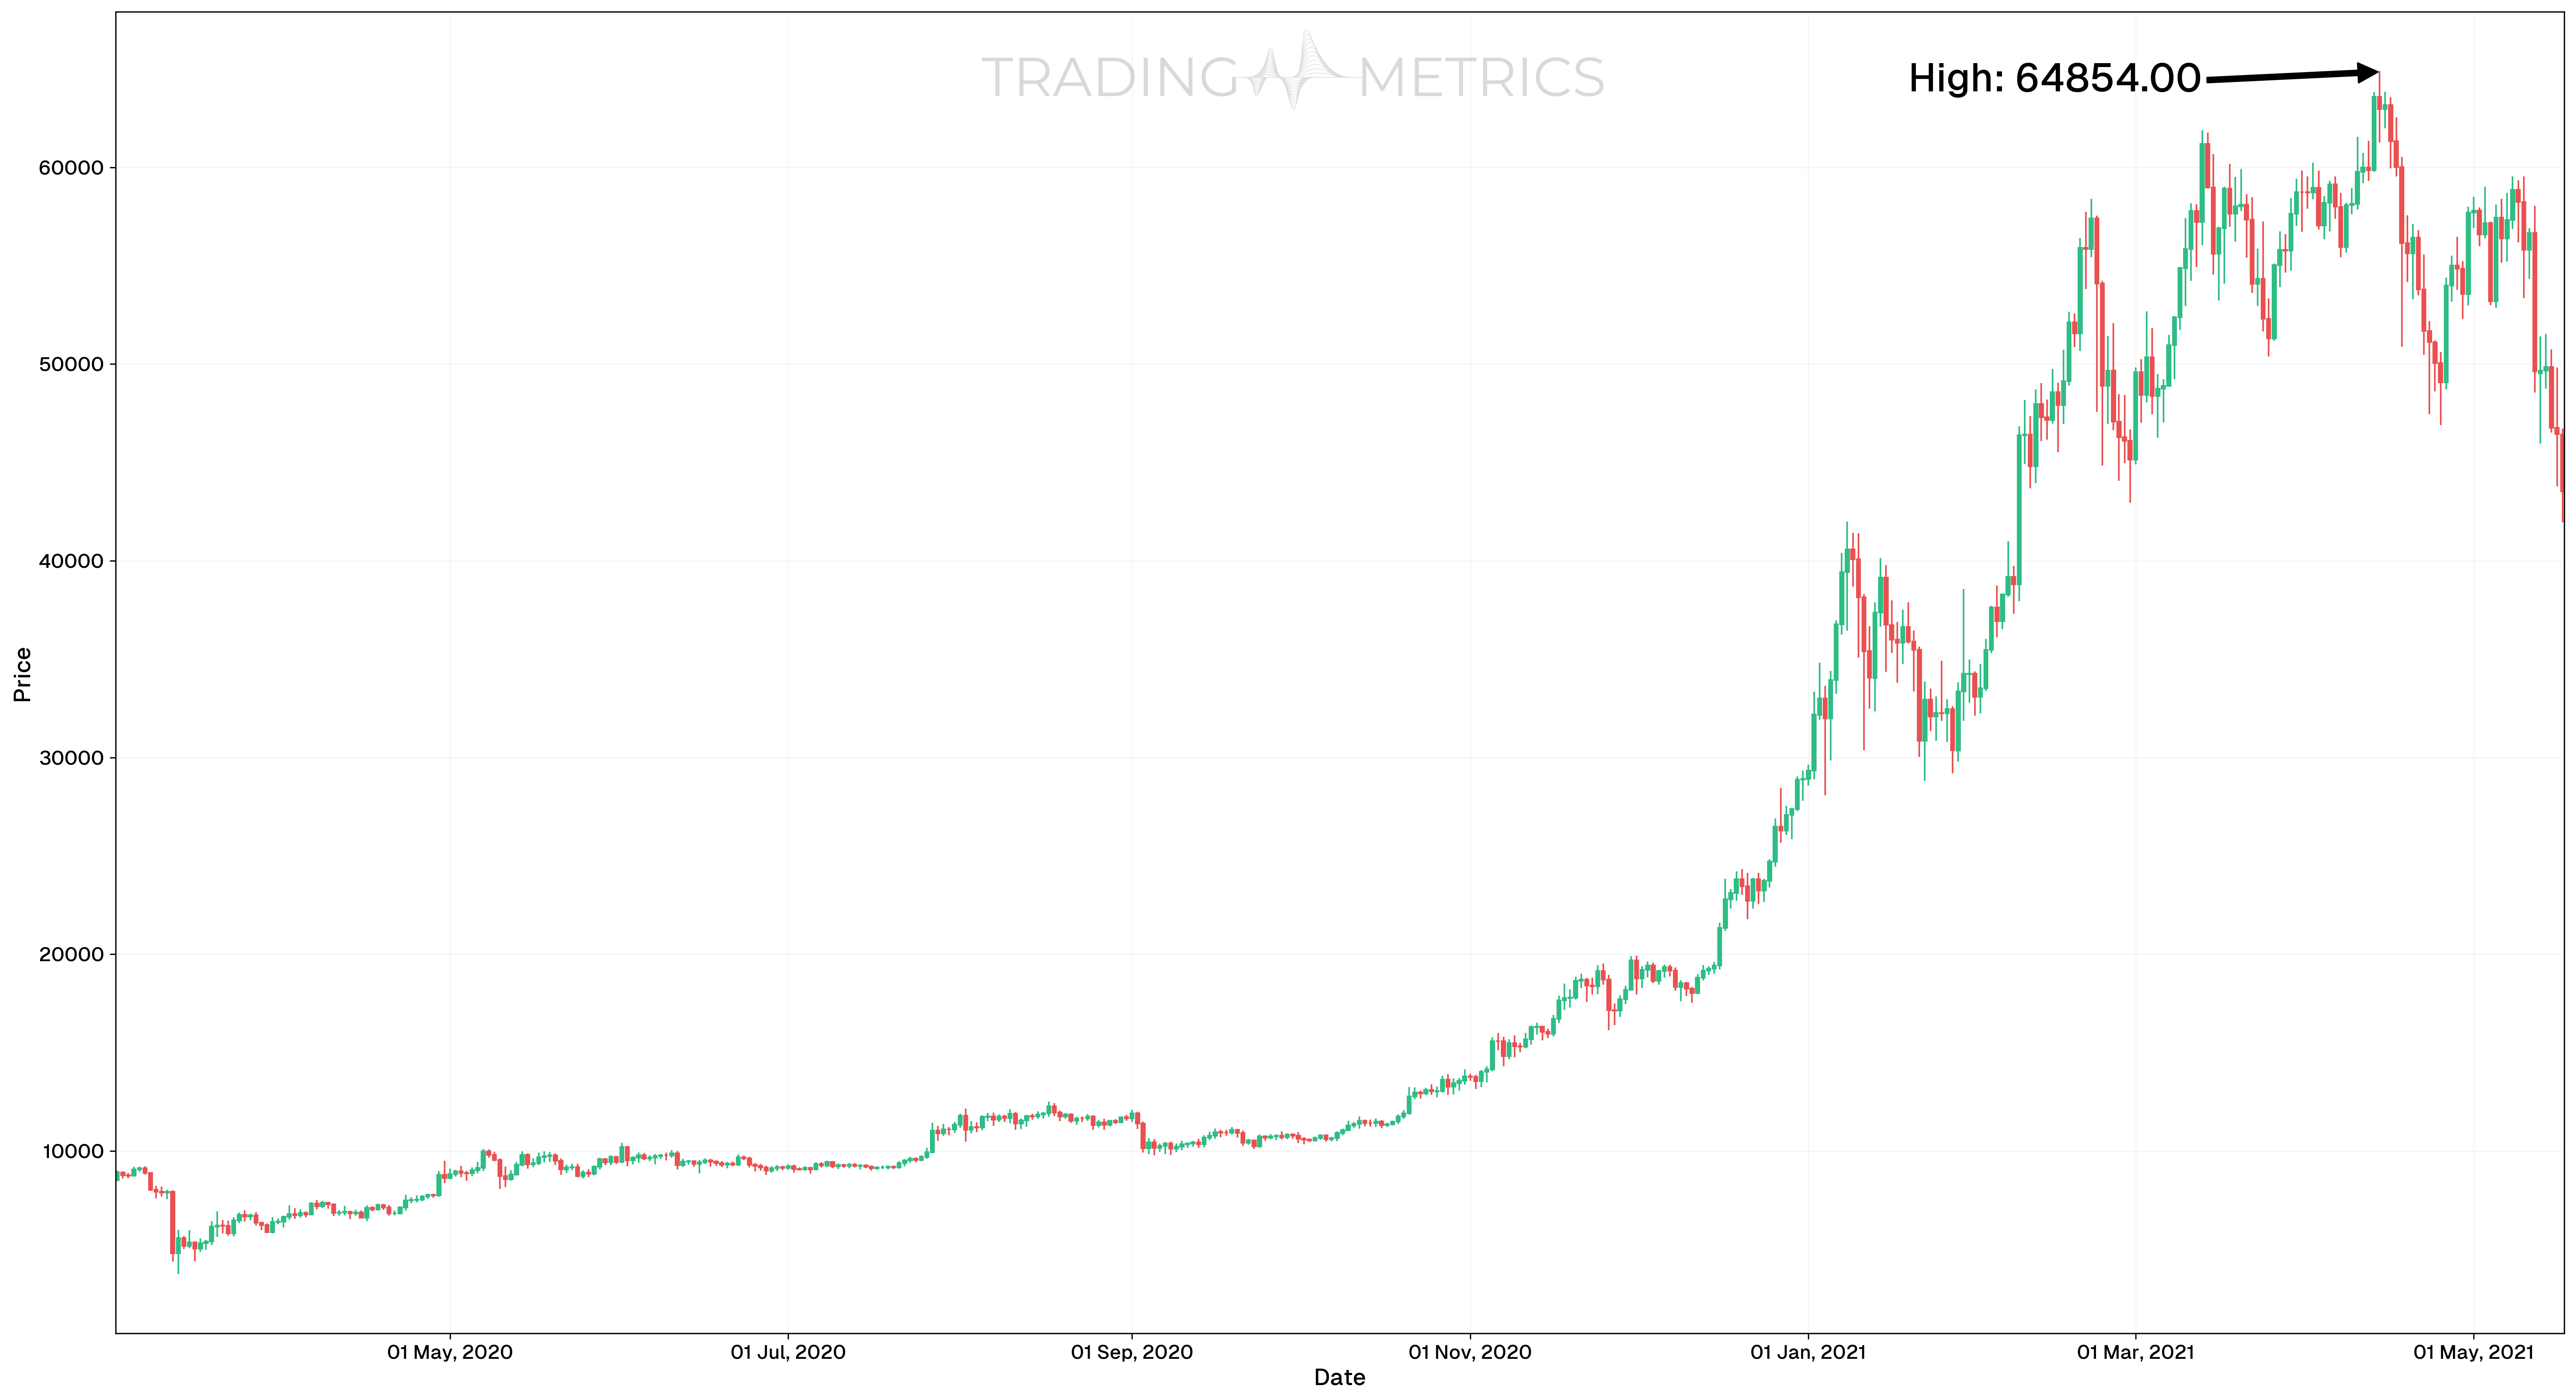
Key Insight: Extending the second point to the right aligns the 0.5 (or 50%) level at the top of the significant high. This makes it easier to analyze future retracement and extension levels.
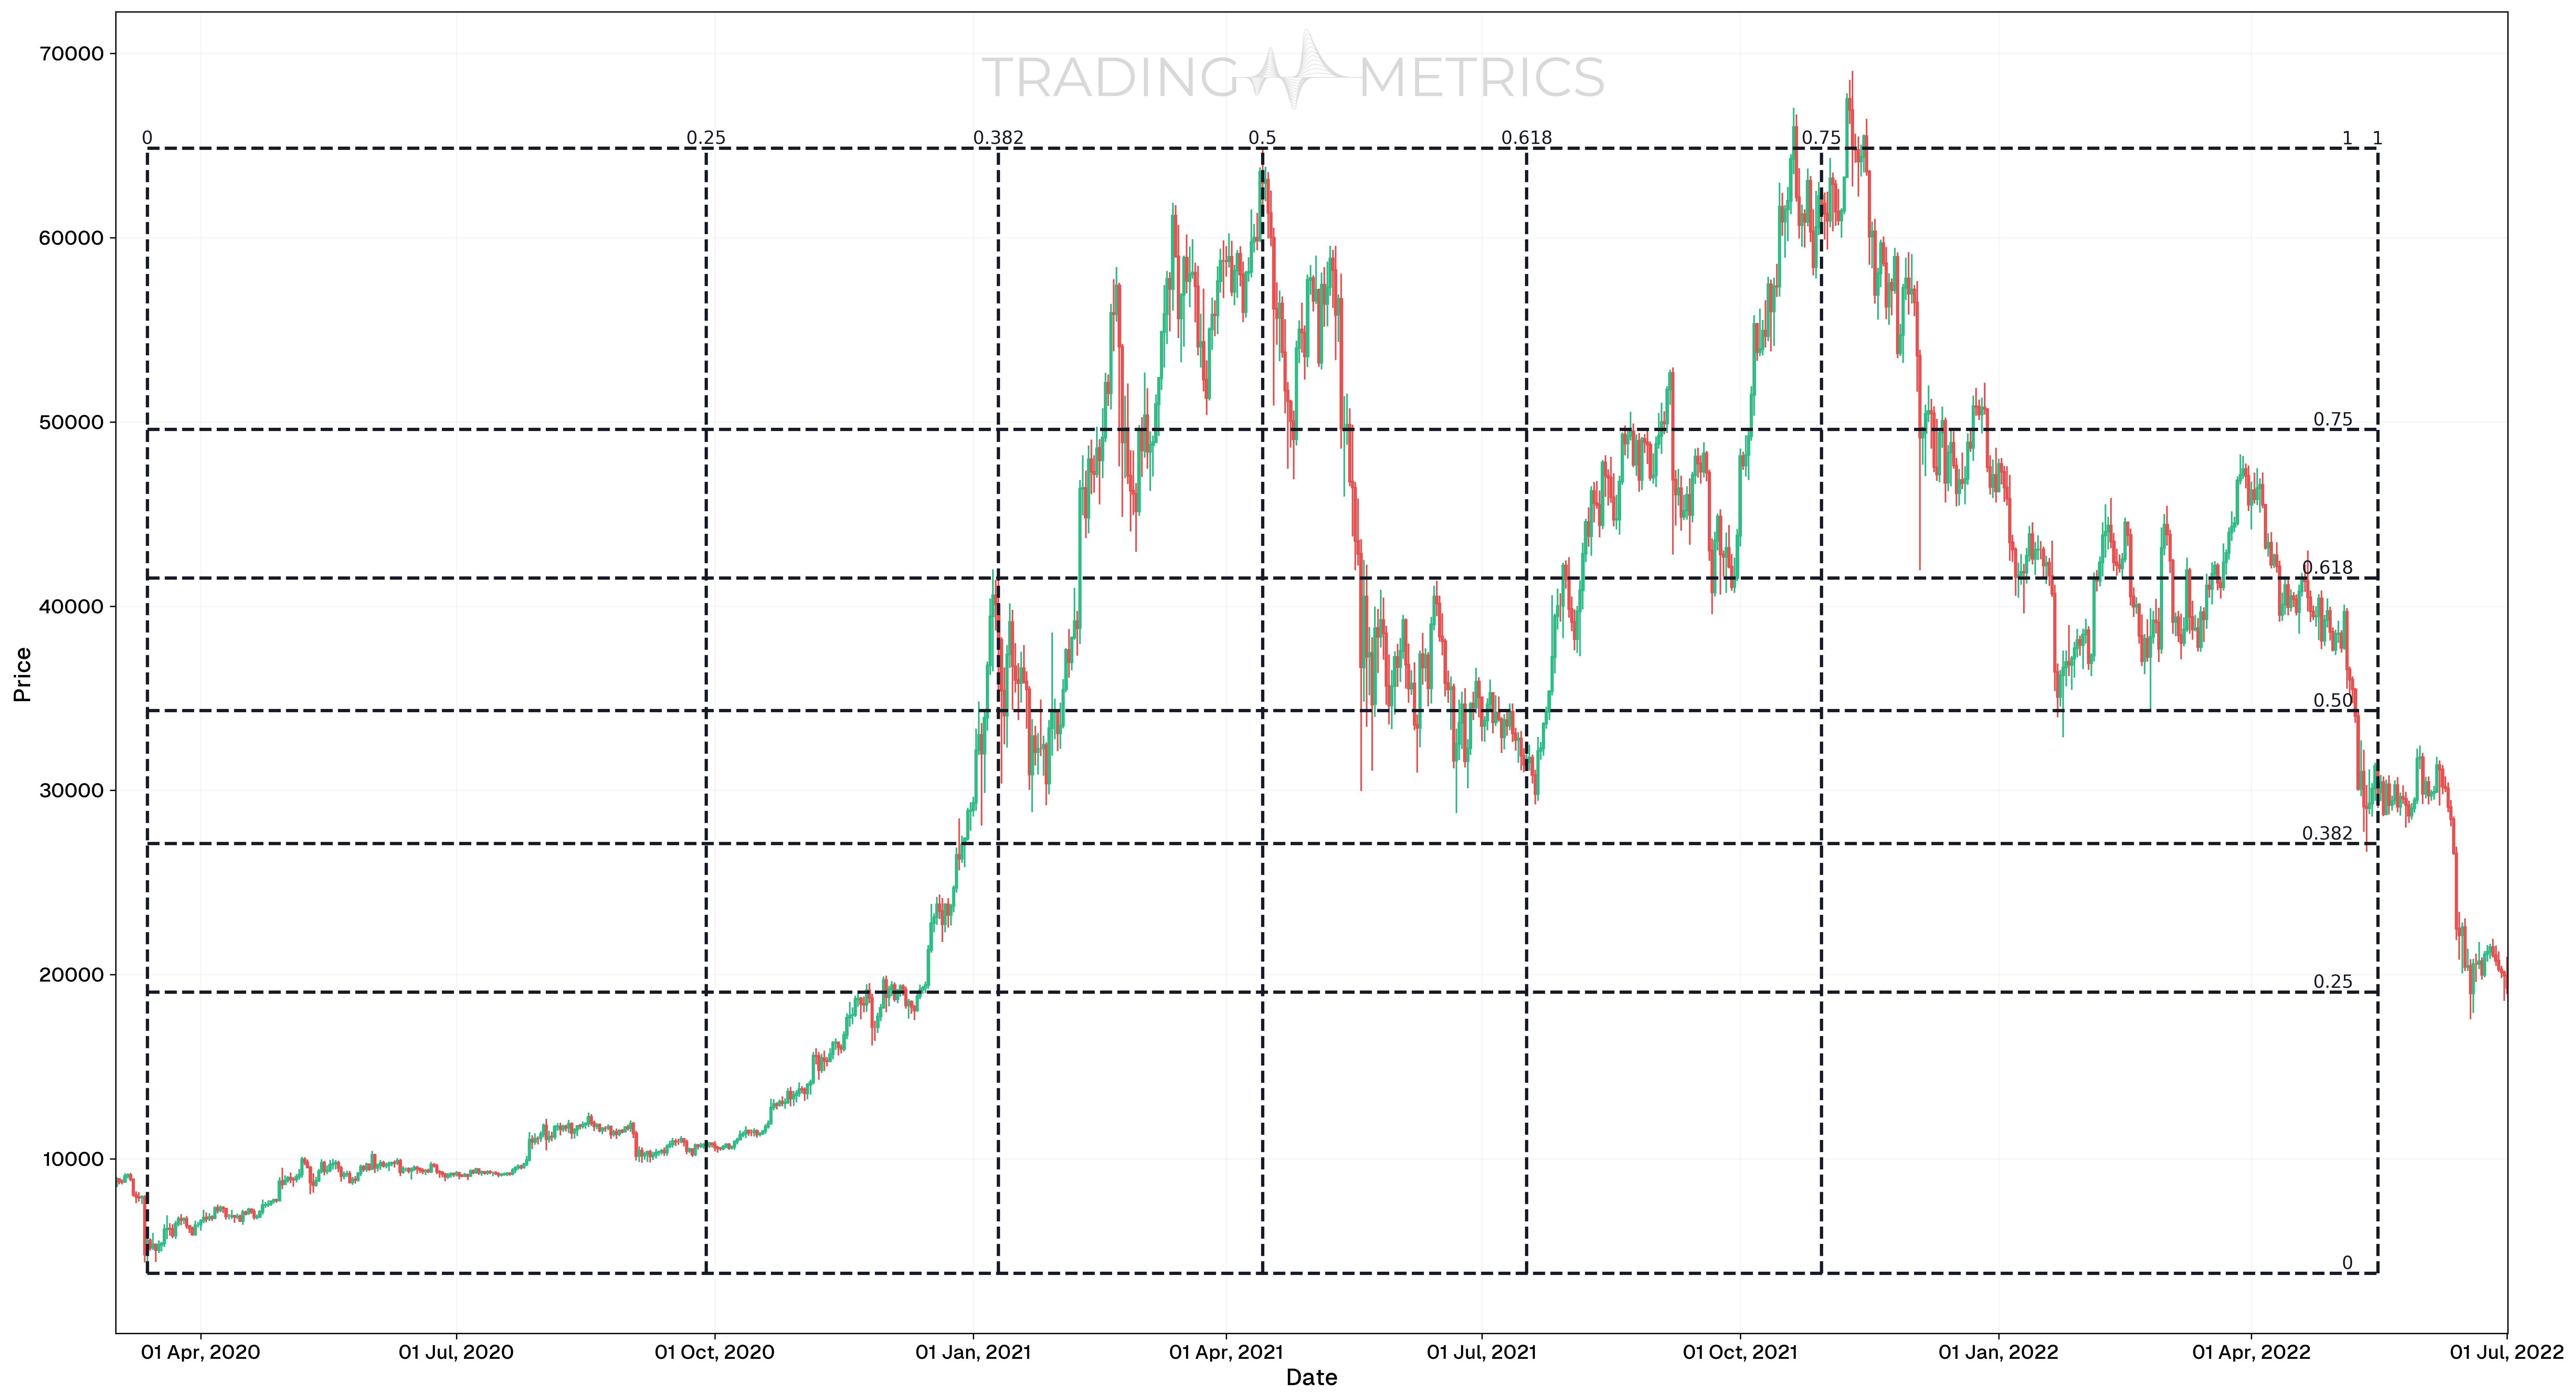
Draw the Gann Box
Connect the first and second points to create the Gann Box, ensuring it encompasses the full range of the trend from the significant low to the significant high.

Analyze Key Levels within the Gann Box
Observe how price movements interact with the Gann Box’s horizontal and vertical lines. The 50% level (0.5) should align with the significant high, acting as a reference for potential retracement. The 25%, 50%, and 75% levels can indicate key support and resistance points as the price moves forward in time.
Fine-Tune and Secure the Gann Box
Make any necessary adjustments to ensure the box aligns with your chosen trend and timeframe. Lock the Gann Box to prevent accidental changes, maintaining its position for ongoing analysis.
Pro Tip: Use the Gann Box in conjunction with other technical tools, such as trendlines or volume indicators, to confirm potential breakout or reversal points.
Validate with Other Tools: Always combine the Gann Box with other technical indicators for the best results.
Key Points
The Gann Box is a powerful tool in technical analysis used for understanding potential support and resistance levels, timing, and price movements in a chart. The Gann Box integrates both price and time into one analytical model, allowing traders to identify significant turning points. The primary points in a Gann Box include 0, 0.25, 0.382, 0.5, 0.618, 0.75, and 1. Each of these points has unique significance due to their mathematical or theoretical basis, often tied to market psychology or natural ratios.
0 (Starting Point):
- Significance: The starting point, or 0%, represents the beginning of the analysis period. This is where traders start plotting the Gann Box. It marks the initial reference for both time and price, serving as a baseline to project future movements.
0.25 (25% Level):
- Significance: The 25% level is significant because it represents a quarter of the movement between the start and the projected endpoint. This level often acts as a preliminary support or resistance level, indicating the first area where price action may pause or reverse.
- Why Important: This level reflects an early retracement in the trend and can signify minor pullbacks within larger price movements.
0.382 (38.2% Level):
- Significance: The 38.2% level is derived from the Fibonacci sequence and is commonly associated with natural retracements in both time and price. This level often acts as a stronger support or resistance level than 0.25, highlighting areas where the market may make significant corrective moves.
- Why Important: Traders monitor this point to anticipate possible consolidation or a change in trend momentum due to its alignment with the golden ratio found in nature and markets.
0.5 (50% Level):
- Significance: The 0.5 or 50% level is central to the Gann Box and is considered a pivotal point for analyzing potential reversals. This level represents an equal division of the price and time movement, signaling a potential shift in market sentiment.
- Why Important: The 50% retracement level is significant because W.D. Gann himself emphasized it as a key point where trends often reverse or accelerate. This level is widely recognized by traders as a crucial area for decision-making.
0.618 (61.8% Level)
- Significance: The 61.8% level is another Fibonacci-based point and is often regarded as the golden ratio. It represents a critical area of potential support or resistance where the probability of price reversals is high.
- Why Important: The 61.8% level is considered one of the most powerful in the Gann Box. It aligns with the natural phenomena of proportionality seen in financial markets, making it a strong indicator of potential price reactions.
0.75 (75% Level)
- Significance: The 0.75 level is often seen as the final significant retracement before the price reaches the full move (point 1). It indicates an area where traders might see a last push or a final resistance/support before the ultimate completion of the trend.
- Why Important: While not as heavily watched as 61.8% or 50%, the 75% level serves as an indicator of deeper retracements within a trend. It can signal whether the market is nearing exhaustion before fully reversing or continuing.
1 (Ending Point)
- Significance: The 100% point represents the end of the projected time and price movement. This is where traders expect the price movement to complete the cycle defined by the Gann Box.
- Why Important: The 100% level is crucial as it marks the target area for price movement completion. It indicates whether a full retracement or price extension has occurred and helps traders identify if a new cycle is about to start.
Be Mindful of Proportions: Ensure that your box is drawn with correct proportions; otherwise, your analysis could be misleading.
Combining Gann Box with Other Tools
To increase its effectiveness, traders often combine the Gann Box with other technical tools, such as:
- Fibonacci Retracement: The combination of Fibonacci levels and the Gann Box can strengthen the prediction of key reversal points. If a Fibonacci Retracement level aligns with a Gann level, it adds weight to that price level as a strong support or resistance zone.
- Moving Averages: Adding moving averages to your analysis can help confirm the direction indicated by the Gann Box. If the price intersects with a significant Gann line and a moving average, the probability of a reversal is higher.
- Volume Indicators: Volume spikes at Gann levels can indicate the strength of a potential move. If price action at a Gann level is accompanied by a significant volume increase, it often confirms a reversal or breakout.
- Relative Strength Index (RSI): The RSI can signal whether a market is overbought or oversold. If an intersection on the Gann Box aligns with an extreme RSI reading, it can strengthen the case for taking action.
Watch the 1x1 Line: The 1x1 line is crucial, as it shows a perfect balance between time and price. A break of this line often signals a shift in trend momentum.
Conclusion
The Gann Box is more than a trading tool it’s a strategic lens through which you can view the interplay between time and price. It can seem complex at first, but with practice, it becomes a powerful ally in your trading arsenal. So, if you’re looking for that extra edge in your trading strategy, the Gann Box is well worth mastering. It’s a perfect blend of art and science that, when combined with solid trading discipline, can lead to a winning formula.
Frequently Asked Questions
Quick answers based on this page's topic.
The Gann Box uses geometric angles to project future support and resistance based on a specific price-time relationship. By drawing the box across a major move, traders identify 'hidden' levels where time and price intersect, often marking significant market turning points.
Unlike Fibonacci tools that focus primarily on price retracements, the Gann Box treats time as an equal variable. It suggests that markets move in predictable cycles and that price action is a result of geometric proportions between vertical price and horizontal time.
Accuracy depends on identifying the correct 'starting' high and low points. Using the Gann Box on higher timeframes, like daily or weekly charts, helps filter out market noise and provides more reliable long-term projections for price-time exhaustion zones.