Annualized Return: Precise Performance Analysis
Annualized return, often referred to as the geometric average return, is a way to measure the average yearly return of an investment over a specified period. Unlike simple average returns, which might not account for the compounding effect, annualized returns give a clearer picture of an investment’s performance by considering compounding. This makes it easier for investors to compare the performance of different investments over various time periods.
In the long run, it’s not just how much money you make that will determine your future prosperity. It’s how much of that money you put to work by saving it and investing it.
- Peter Lynch
How to Calculate Annualized Return?
The formula to calculate the annualized return is:
where:
- is the ending value of the investment.
- is the beginning value of the investment.
- is the number of years the investment is held.
Importance of Annualized Return in Trading
Annualized return is important because it allows traders to compare performance across different assets on a consistent time basis. It highlights the impact of compounding, making it easier to see how an investment grows over time. This helps traders allocate capital more effectively between stocks, bonds, and alternative assets.
Pro Tip: Annualized return helps you compare investments with different time frames by standardizing their performance over a year. It’s your shortcut to apples-to-apples analysis!
S&P500 and long term profitability
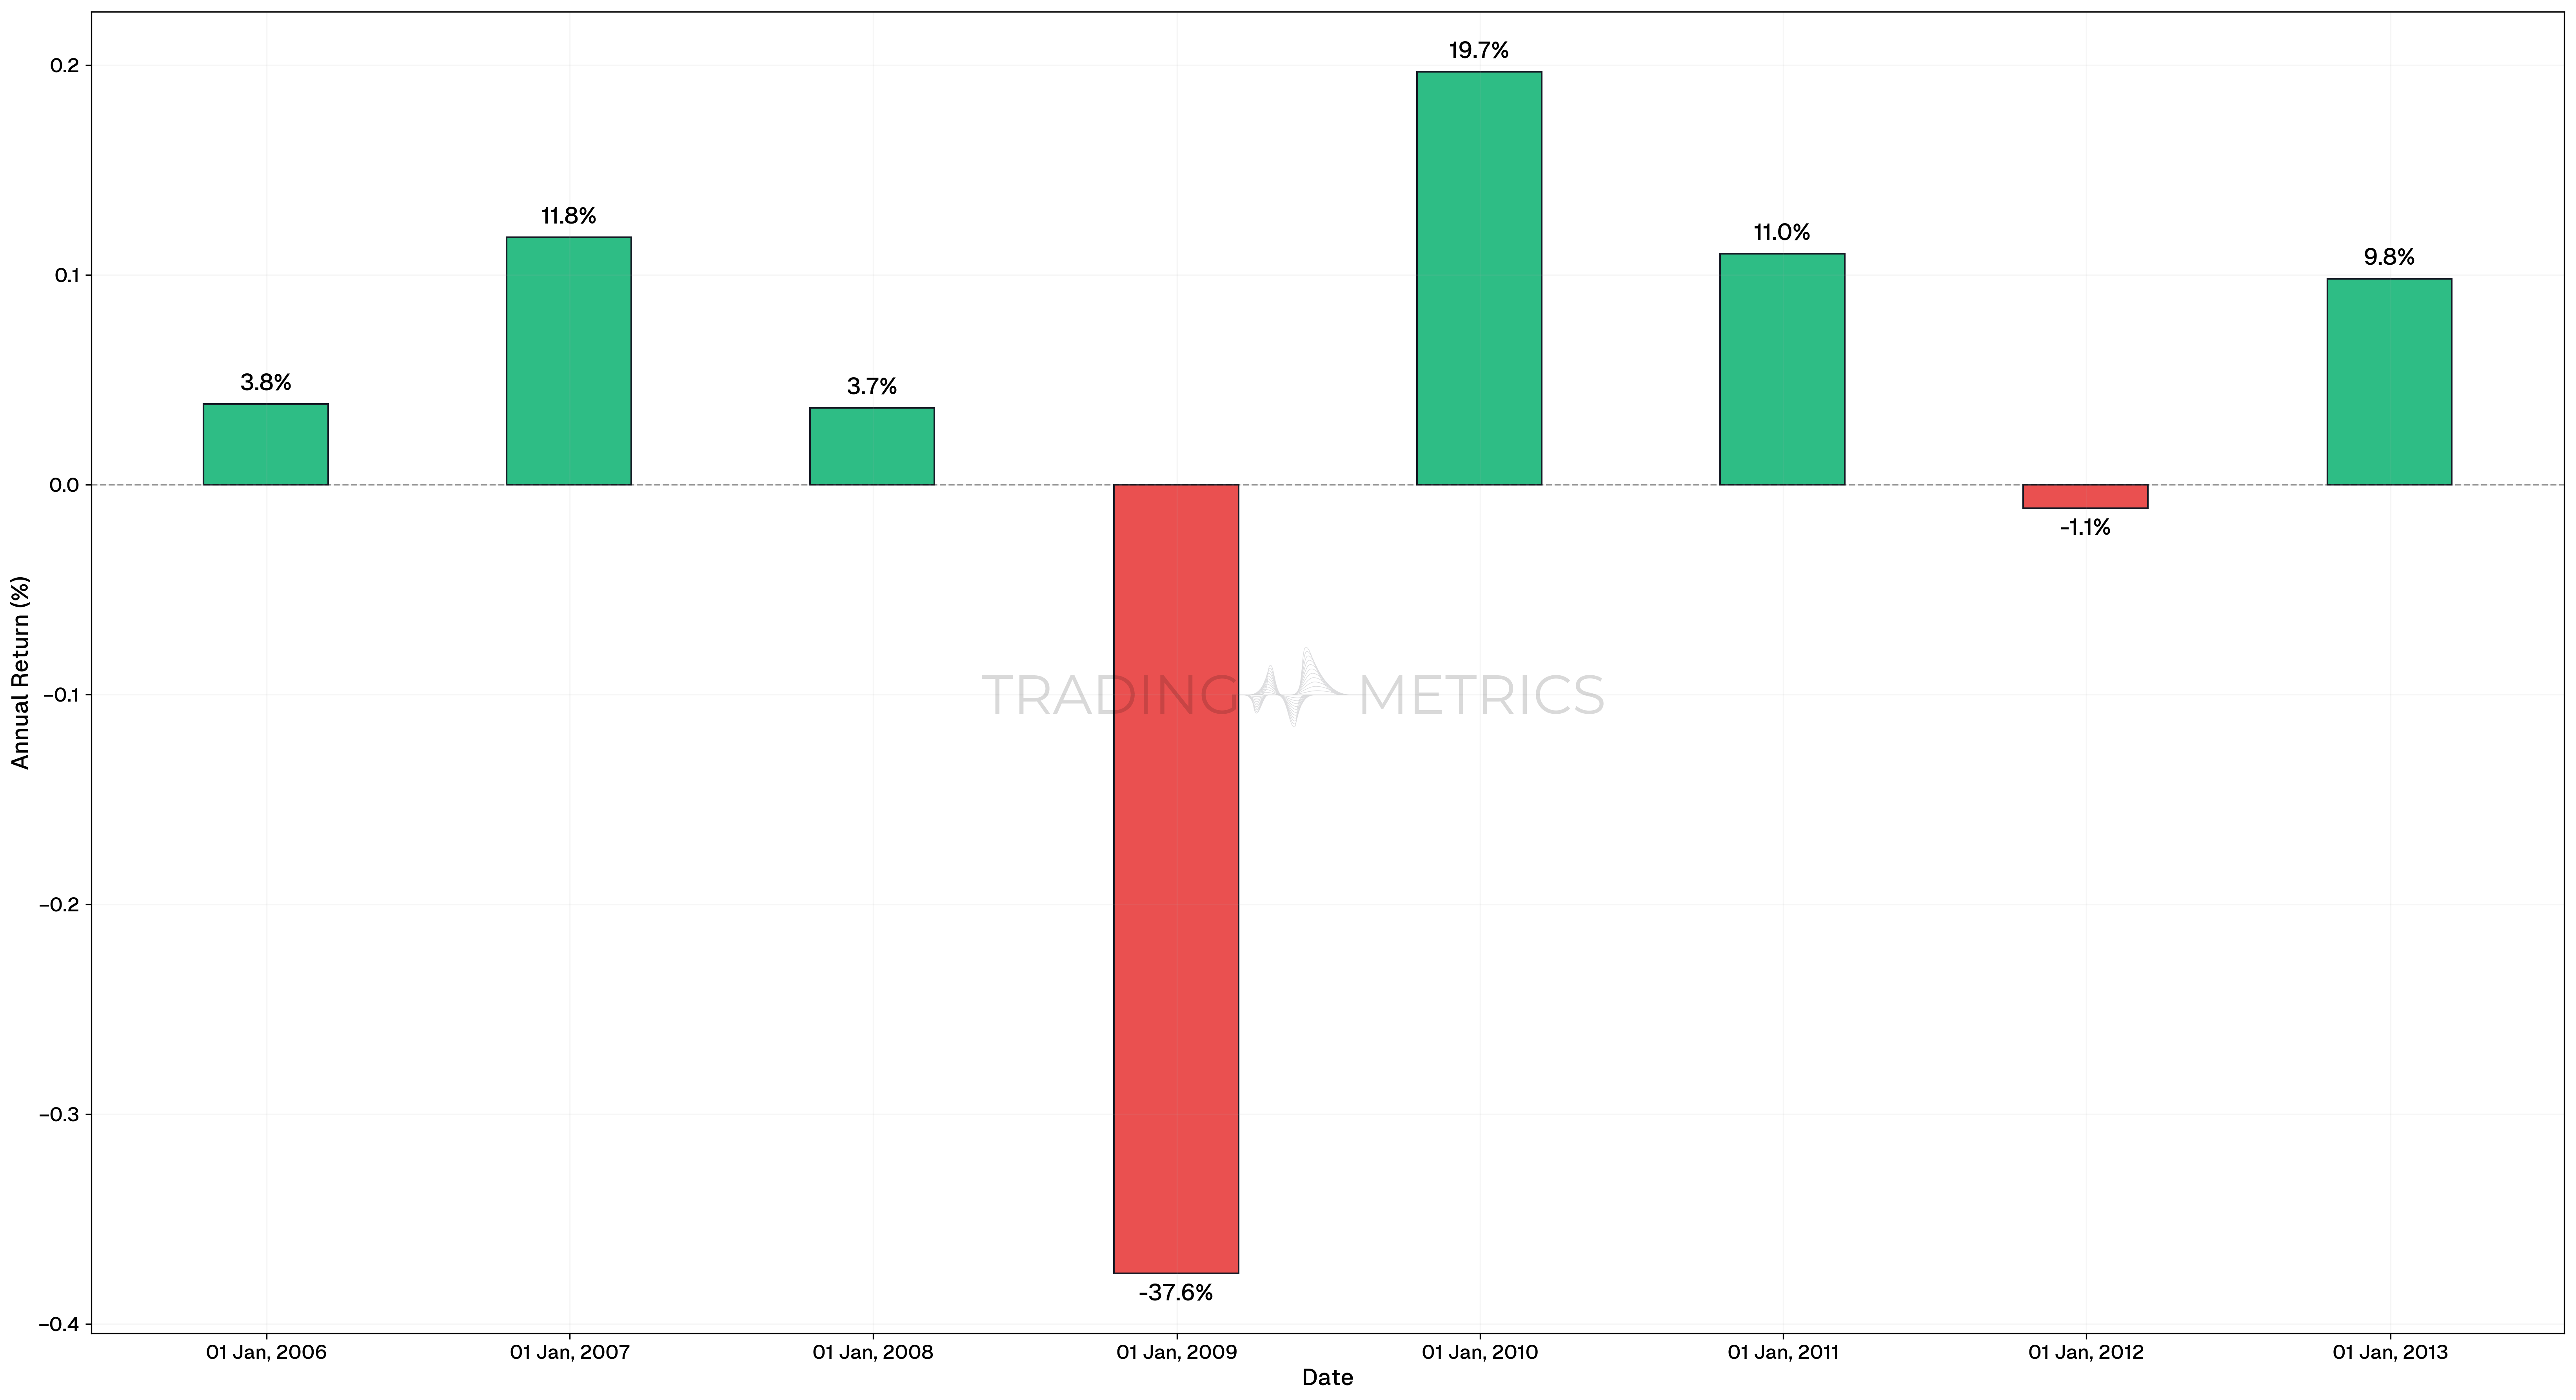
Trading the S&P 500 Index over different years provides valuable insights into the risks and rewards of investing. Here, we examine annualized returns from 2005 to 2012, showing how traders can experience both gains and losses in individual years while achieving long-term profitability.
The table below highlights the annualized returns of the S&P 500 Index from 2005 to 2012, showcasing the variability in yearly performance. This period includes both significant losses, such as during the 2008 financial crisis, and strong recovery years like 2009. Observing these annualized returns helps traders and investors understand the impact of market volatility over time, emphasizing the importance of a long-term investment horizon.
| Year | Annualized Return (%) |
|---|---|
| 2005 | 3.84 |
| 2006 | 11.78 |
| 2007 | 3.65 |
| 2008 | -37.58 |
| 2009 | 19.67 |
| 2010 | 11.00 |
| 2011 | -1.12 |
| 2012 | 9.82 |
Short-Term Loss:
The following table illustrates the annualized return for the S&P 500 Index during the challenging year of 2008, a period marked by the global financial crisis. This year witnessed a significant decline in market value, providing a clear example of how short-term market downturns can heavily impact annual Performance metrics. By breaking down the calculation, we see the magnitude of the loss and its implications for investors during that turbulent time.
| Metric | Value/Result |
|---|---|
Starting Date | 1 Jan, 2008 |
Starting Value (S&P 500) | 1,468.36 |
Ending Date | 31 Dec, 2008 |
Ending Value (S&P 500) | 903.25 |
Number of Days | 365 |
Annualized Return Formula | |
Annualized Return | -37.58% |
Long-Term Gain:
The following table highlights the annualized return for the S&P 500 Index during 2009, a year of strong recovery following the financial crisis. This rebound demonstrates the market’s resilience and emphasizes how significant gains can occur after periods of downturn. By analyzing this example, traders can understand the importance of staying invested during volatile periods to potentially capture long-term growth opportunities.
| Metric | Value/Result |
|---|---|
Starting Date | 1 Jan, 2009 |
Starting Value (S&P 500) | 903.25 |
Ending Date | 31 Dec, 2009 |
Ending Value (S&P 500) | 1,115.10 |
Number of Days | 365 |
Annualized Return Formula | |
Annualized Return | 19.67% |
Analysis: The analysis demonstrates that while an investor faced a -37.58% loss in 2008, remaining in the market for 2009 recovered 19.67%, showing the power of long-term investing. Despite yearly fluctuations, the compounded annualized return over multiple years often trends positively, rewarding patience and a long-term perspective.
Growth Factor: Compounding is a trader’s best friend! Even modest annualized returns can result in impressive gains when sustained over several years. Focus on consistency!
Combining Annualized Return with other Tools
To gain more comprehensive insights, annualized return can be combined with other metrics and tools, such as:
-
Volatility (Standard Deviation): Understanding how much the returns fluctuate over time helps in assessing the risk associated with the investment.
-
Sharpe ratio: This ratio measures the return per unit of risk. It is calculated by subtracting the risk-free rate from the annualized return and dividing by the standard deviation of the return.
-
Drawdown: This measures the peak-to-trough decline during a specific period and helps in understanding the potential downside risk.
-
Win rate: Combine annualized return with metrics like win rate for a holistic view of your trading strategy’s performance. It’s about the big picture!
Balanced View: While chasing high annualized returns is tempting, ensure the risk-adjusted return (like Sharpe ratio) is equally attractive to maintain a sustainable strategy.
Key Points
- Standardized Performance Measure: Annualized return allows for consistent comparison of investments, regardless of the time frame, by expressing returns as an average annual percentage.
- Impact of Compounding: Reflects the effects of compounding, providing a more accurate picture of long-term investment growth compared to simple average returns.
- Comparison Across Assets: Ideal for comparing the performance of investments with varying holding periods or risk profiles.
- Long-Term Focus: Emphasizes the sustainability of returns over time, helping investors focus on consistent growth rather than short-term fluctuations.
- Context with Total Return: Use annualized return alongside total return to understand both the cumulative performance and the efficiency of returns over time.
- Useful for Goal Setting: Helps investors align portfolio growth with long-term financial goals, such as retirement or education savings.
- Market Benchmarks: Compare annualized return against benchmark indices to assess relative performance and make informed adjustments.
- Sensitivity to Volatility: Consider that annualized return does not account for interim market volatility, which may affect actual realized outcomes.
- Strategic Planning: A critical tool for evaluating the historical performance of strategies and setting realistic expectations for future returns.
Conclusion
The annualized return is a vital metric for traders and investors to assess the performance of their investments over time, accounting for the effects of compounding. By combining annualized return with other metrics like volatility, sharpe ratio, and Drawdown, traders can make more informed decisions. By understanding and applying these concepts, you can better navigate the complex world of trading and make more informed investment decisions.
Frequently Asked Questions
Quick answers based on this page's topic.
Annualized return provides a standardized way to compare the performance of different investments that were held for varying lengths of time. By scaling returns to a 12-month period, it accounts for the effects of compounding and allows for a 'level playing field' comparison.
As the time horizon increases, annualized returns tend to smooth out extreme market fluctuations. While a single month may show a 20% gain, over five years, that gain is averaged out, providing a more realistic expectation of the strategy’s long-term sustainable growth rate.
Yes. Scaling a one-week 5% gain to an annualized figure can result in an impossibly high percentage. Annualization is most accurate when applied to data sets spanning at least one full year to avoid over-projecting the impact of temporary market anomalies.