Diamond Bottom Pattern: A Rare High-Conviction Bottom Formation
The Diamond Bottom pattern is a rare but dazzling bullish reversal signal in technical analysis, often surfacing after a downtrend. Imagine it as a diamond-shaped struggle - widening then narrowing - before price breaks upward. When this pattern shines through, it’s a vivid sign that bearish momentum is fading, handing traders an opportunity to buy or go long as an uptrend sparkles into view.
How to Identify the Diamond Bottom Pattern in Trading
The Diamond Bottom is a bullish reversal formation. It develops when price first expands, then contracts, creating a diamond-shaped base at the end of a downtrend. The setup confirms when price breaks above resistance. Here’s how to spot it:
Start with the Big Picture
This pattern appears after a downtrend. Sellers push aggressively at first, but the widening and then tightening swings show instability and rising volatility before buyers regain control.
Trace the Diamond Shape
The structure forms in two phases that mirror one another. Recognizing these shifts confirms the setup.
- Widening Phase: Price swings broaden with lower lows and higher highs, shaping the left side of the diamond.
- Base: The widest point marks the bottom, where volatility peaks.
- Narrowing Phase: Swings compress into higher lows and lower highs, forming the right side of the diamond.
- Breakout: Price pushes above the upper boundary, confirming the reversal.
Zero in on the Resistance Line
The resistance line (or neckline) is the upper boundary of the diamond. Once this level is broken, the pattern is complete.
Watch the Breakout
The bullish trigger comes when price closes above resistance.
- A decisive break over the neckline or
- A strong bullish candle
Both confirm the reversal and set up the entry.
Check Volume for Additional Confirmation
Volume adds credibility to the move.
- Spikes during the widening phase as volatility builds.
- Fades as swings narrow.
- Surges on the breakout, verifying buyer strength.
When that jump appears, the Diamond Bottom’s bullish reversal is validated.
Aim High: Measure the height from the base to the peak of the diamond and project it upward from the break for a solid price target.
How to Trade the Diamond Bottom Pattern (Trading Example)
To illustrate how the Diamond Bottom pattern can be used to enter a trade, we will choose the TAO/USDT Perp pair. This altcoin perpetual futures contract showed a clean bottoming formation on the daily chart, leading to a strong breakout and multi-target upside structure.
Analysis
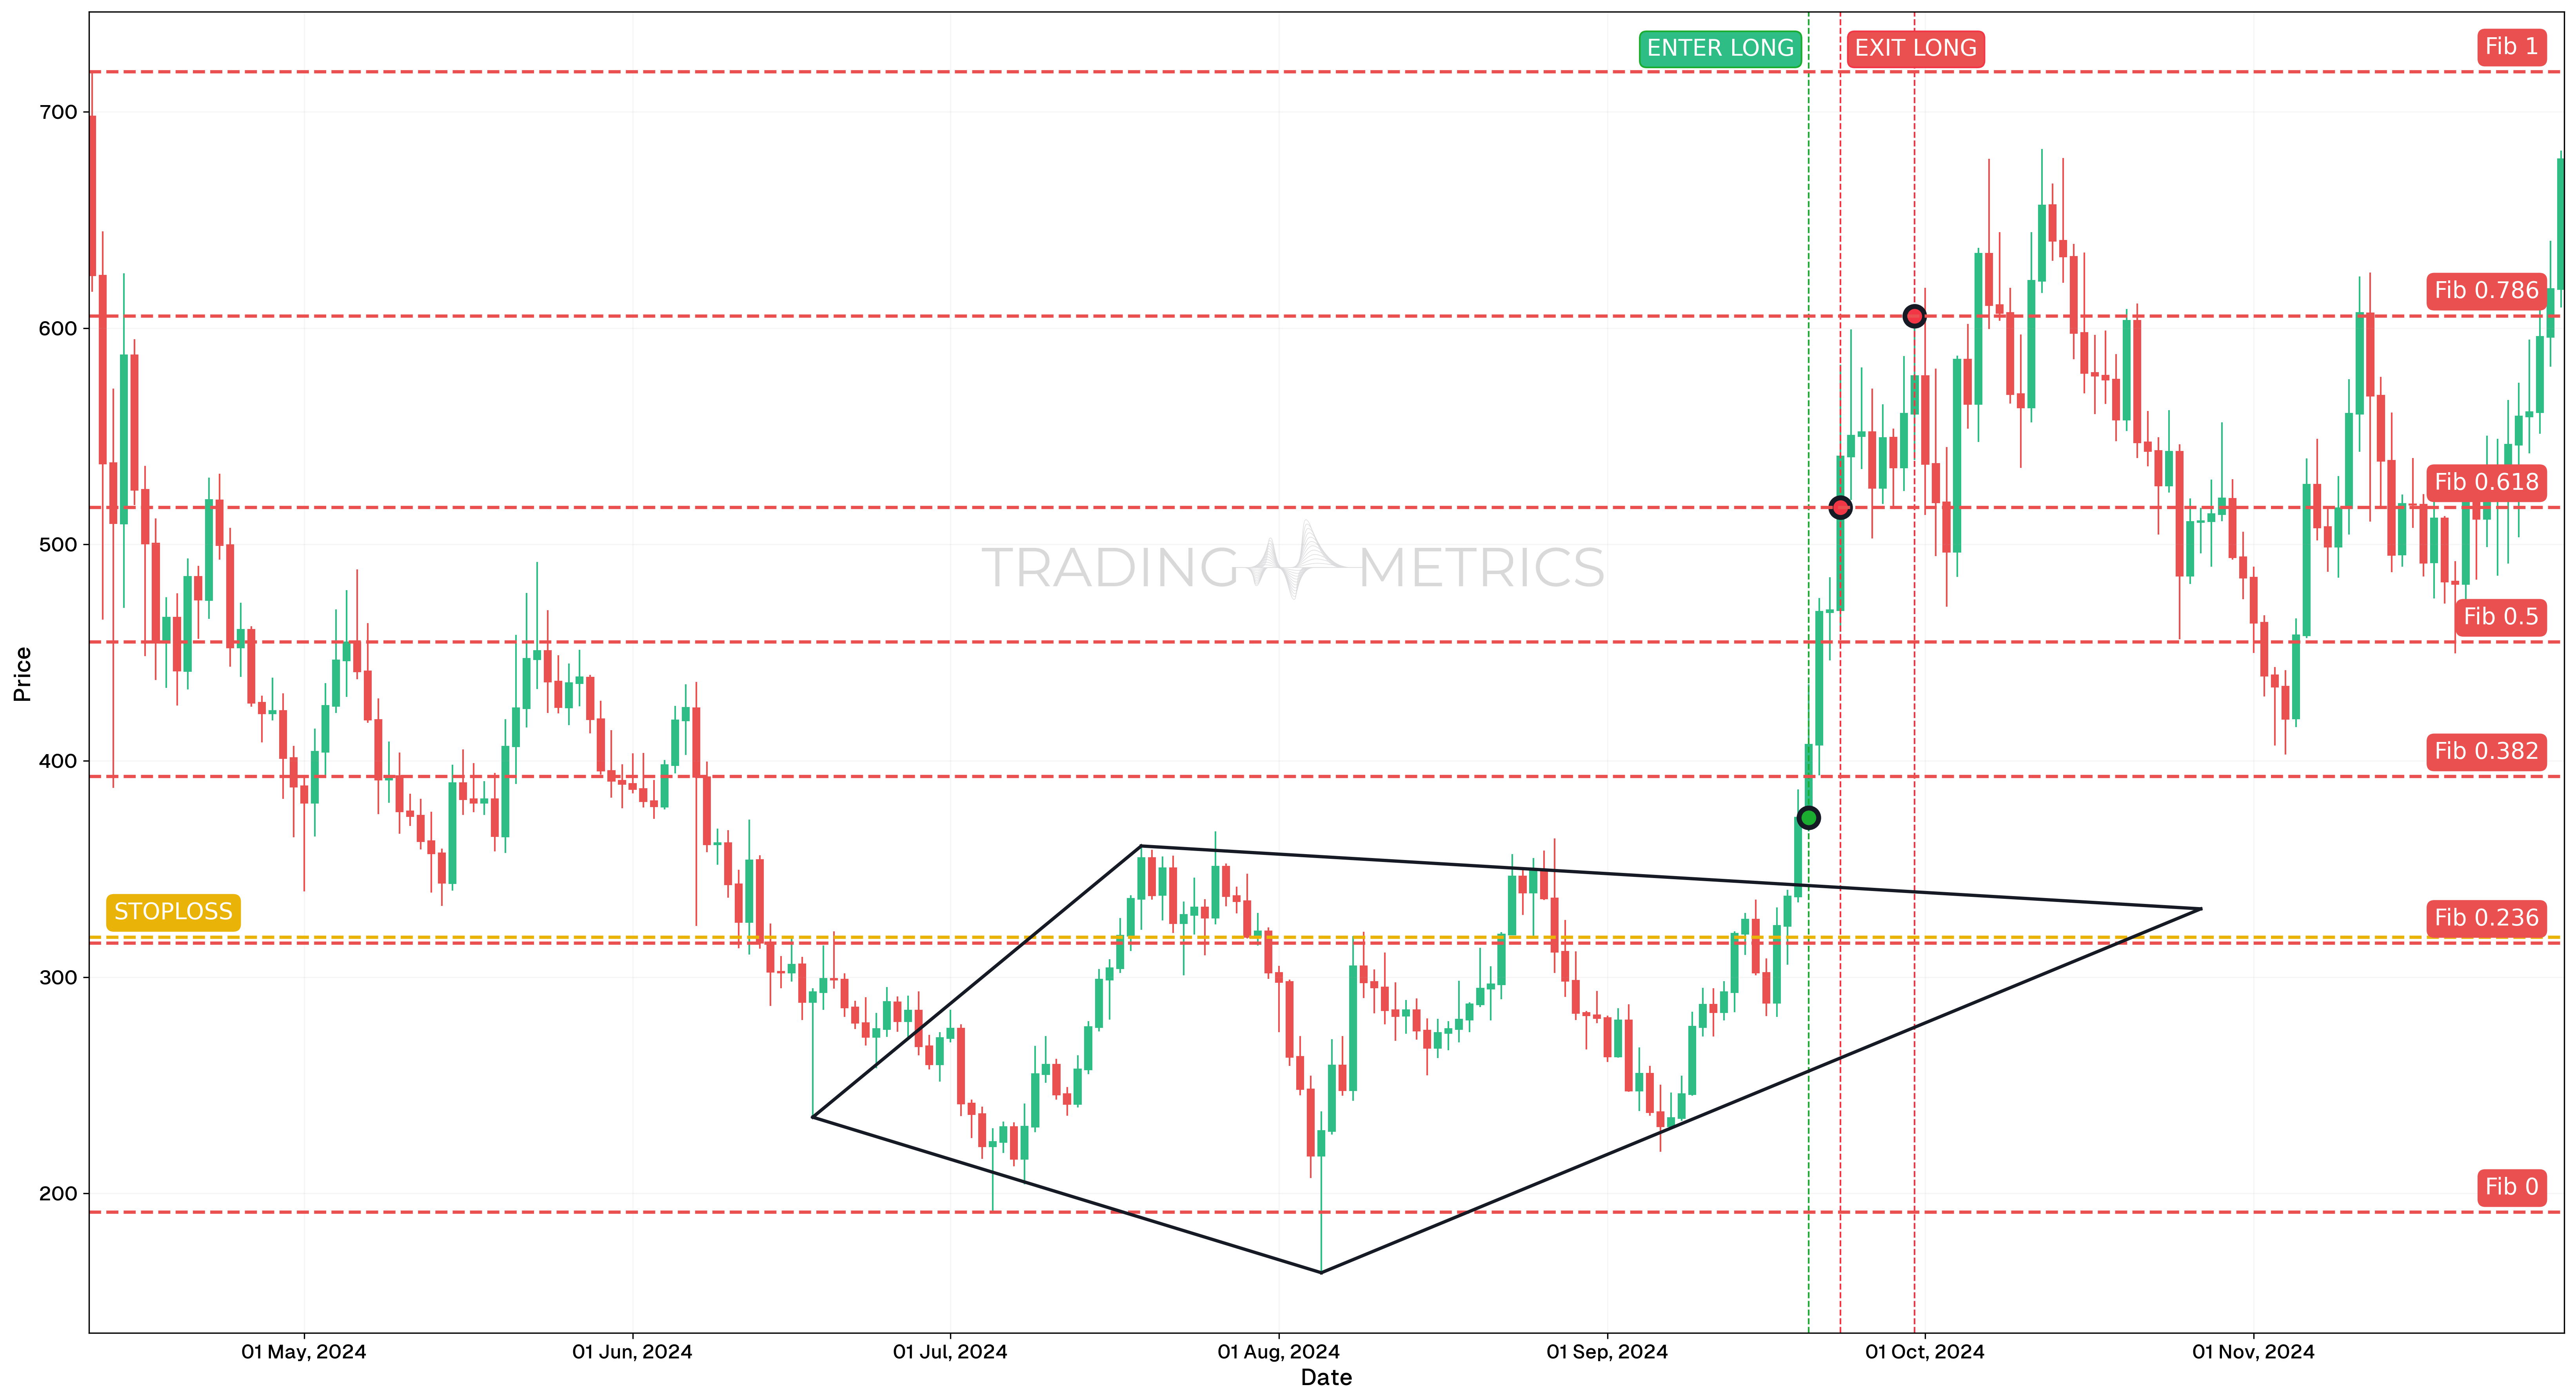
From April to September 2024, TAO/USDT Perp formed a well-defined Diamond Bottom pattern. This structure began with widening price action, followed by a narrowing consolidation phase. The shape reflected a shift from distribution to accumulation, and by late September, the pattern resolved to the upside with a strong breakout candle.
Trade Setup
-
Entry: The position was entered on September 20, 2024, at 02:00, at $318.51, following a breakout above the upper edge of the Diamond Bottom structure. Multiple technical signals confirmed the entry:
- RSI was above 50 and rising
- StochRSI had crossed bullish a few candles earlier
- MACD (Moving Average Convergence Divergence) was trending above the zero line, confirming upward momentum
-
Exit: The trade was exited in multiple stages as key Fibonacci Retracement levels from a previous leg were reached:
- September 23, 2024 (TP1): 0.618 retracement hit at $517.10.
- September 30, 2024 (TP2): 0.786 retracement hit at $605.66.
-
Outcome: The Diamond Bottom pattern completed successfully, with the breakout producing a strong impulsive leg. Splitting exits into structured levels allowed for systematic profit-taking as price approached exhaustion zones.
Risk Management
- Stop-Loss placement: The stop-loss was placed at $318.51, matching the entry candle’s low. This tight placement ensured minimal downside risk while allowing immediate validation of the breakout beyond the diamond structure.
- Position sizing: The position was calculated using a 2% capital risk model, depending on the distance from entry to the eventual stop-loss level.
- Volatility Consideration: During the formation, Volatility contracted and then expanded on breakout. Waiting for a confirmed bullish shift in both price and momentum indicators helped reduce risk of failure.
- Adaptive Exit Strategy: Taking profit at key Fibonacci levels allowed the trader to stay objective while managing upside efficiently. More aggressive exits could target full measured move projections if continuation follows.
Volume Sparkle: A volume surge on the resistance break turns the diamond into a bullish dazzler.
Pre-Trade Checklist
Polish the Gem: Match the pattern with volume flares and indicators like RSI to cut fakes and brighten your odds.
Key Points
- Shape Clarity: A clear widening-then-narrowing form is key - fuzzy edges dim it.
- Time Frame: Gleams brightest on daily or weekly charts.
- Combine with Indicators: Pair with moving averages or RSI for precision.
- Breakout Confirmation: The resistance break flips the switch - don’t jump too soon.
- Price Target: Measure from base to peak, project up from the break for your aim.
- Risk Management: Set a stop-loss below the base to limit losses if it dulls.
Wait for the Shine: Moving before the resistance break risks a rough cut - let the diamond polish up.
Conclusion
The Diamond Bottom pattern is a rare treasure for nabbing bullish reversals. Its unique shape, teamed with volume, RSI, and moving averages, can light up big wins. Whether in crypto, stocks, or forex, this pattern sharpens your edge. Be patient, manage your risk, and let the diamond form - that sparkling base could gleam into a profitable rise.
Frequently Asked Questions
Quick answers based on this page's topic.
The Diamond Bottom represents a complex transition from high-volatility panic (the broadening phase) to steady accumulation (the contracting phase). It shows the final 'shakeout' of sellers before buyers find a solid equilibrium and begin to drive the new uptrend.
Confirmation occurs when the price closes decisively above the upper right-hand resistance trendline of the diamond. A surge in volume during this breakout is a critical signal that the accumulation phase is complete and the market is ready to move higher.
Yes, though it is a rare pattern. Because it involves a significant shift in market psychology and volatility, it often marks a major macro cycle bottom on higher timeframes, making it highly valued by swing and position traders.