Rounding Top Pattern: A Slow Curve That Marks the Peak
The Rounding Top pattern is a subtle yet powerful bearish reversal signal in technical analysis, often creeping up after a steady uptrend. Imagine it as the market slowly losing steam, tracing a smooth, dome-like curve before rolling over into a downtrend. When this pattern takes shape, it’s a sign that bullish momentum is fizzling out, offering traders a heads-up to consider selling or shorting the asset.
How to Identify the Rounding Top Pattern in Trading
The Rounding Top is a bearish reversal formation. It develops slowly as an uptrend loses momentum, creating a dome-like curve before breaking lower. The pattern confirms once price falls through support. Here’s how to spot it:
Start with the Big Picture
This pattern appears after a sustained uptrend. Buyers begin to lose strength, and the gradual rounding action signals that control is shifting toward sellers.
Trace the Curve in Price Action
The Rounding Top unfolds step by step. Recognizing its slow transition is key.
- Initial Rise: Price climbs steadily, extending the uptrend.
- Peak Formation: Momentum fades and a rounded peak forms — the dome.
- Gradual Decline: Price eases lower, completing the curve.
Zero in on the Support Line
The support line (or neckline) is the horizontal floor at the base of the pattern. Once this level breaks, the Rounding Top is complete.
Watch the Breakdown
The bearish trigger comes when price closes below the support line.
- A decisive break under support or
- A strong bearish candle
Both confirm the reversal and set up the entry.
Check Volume for Additional Confirmation
Volume behavior helps confirm the shift.
- High during the uptrend as buyers dominate.
- Lighter near the peak as momentum fades.
- Spikes on the breakdown, confirming the bearish move.
Gauge the Drop: Measure the height from the peak to the support line and project it downward from the break for a realistic price target.
How to Trade the Rounding Top Pattern (Trading Example)
To illustrate how the Rounding Top pattern can be used to enter a trade, we will choose the SXPUSDT pair. This altcoin offered a well-formed top structure on the 4-hour chart, giving traders a chance to capitalize on a potential trend reversal.
Analysis
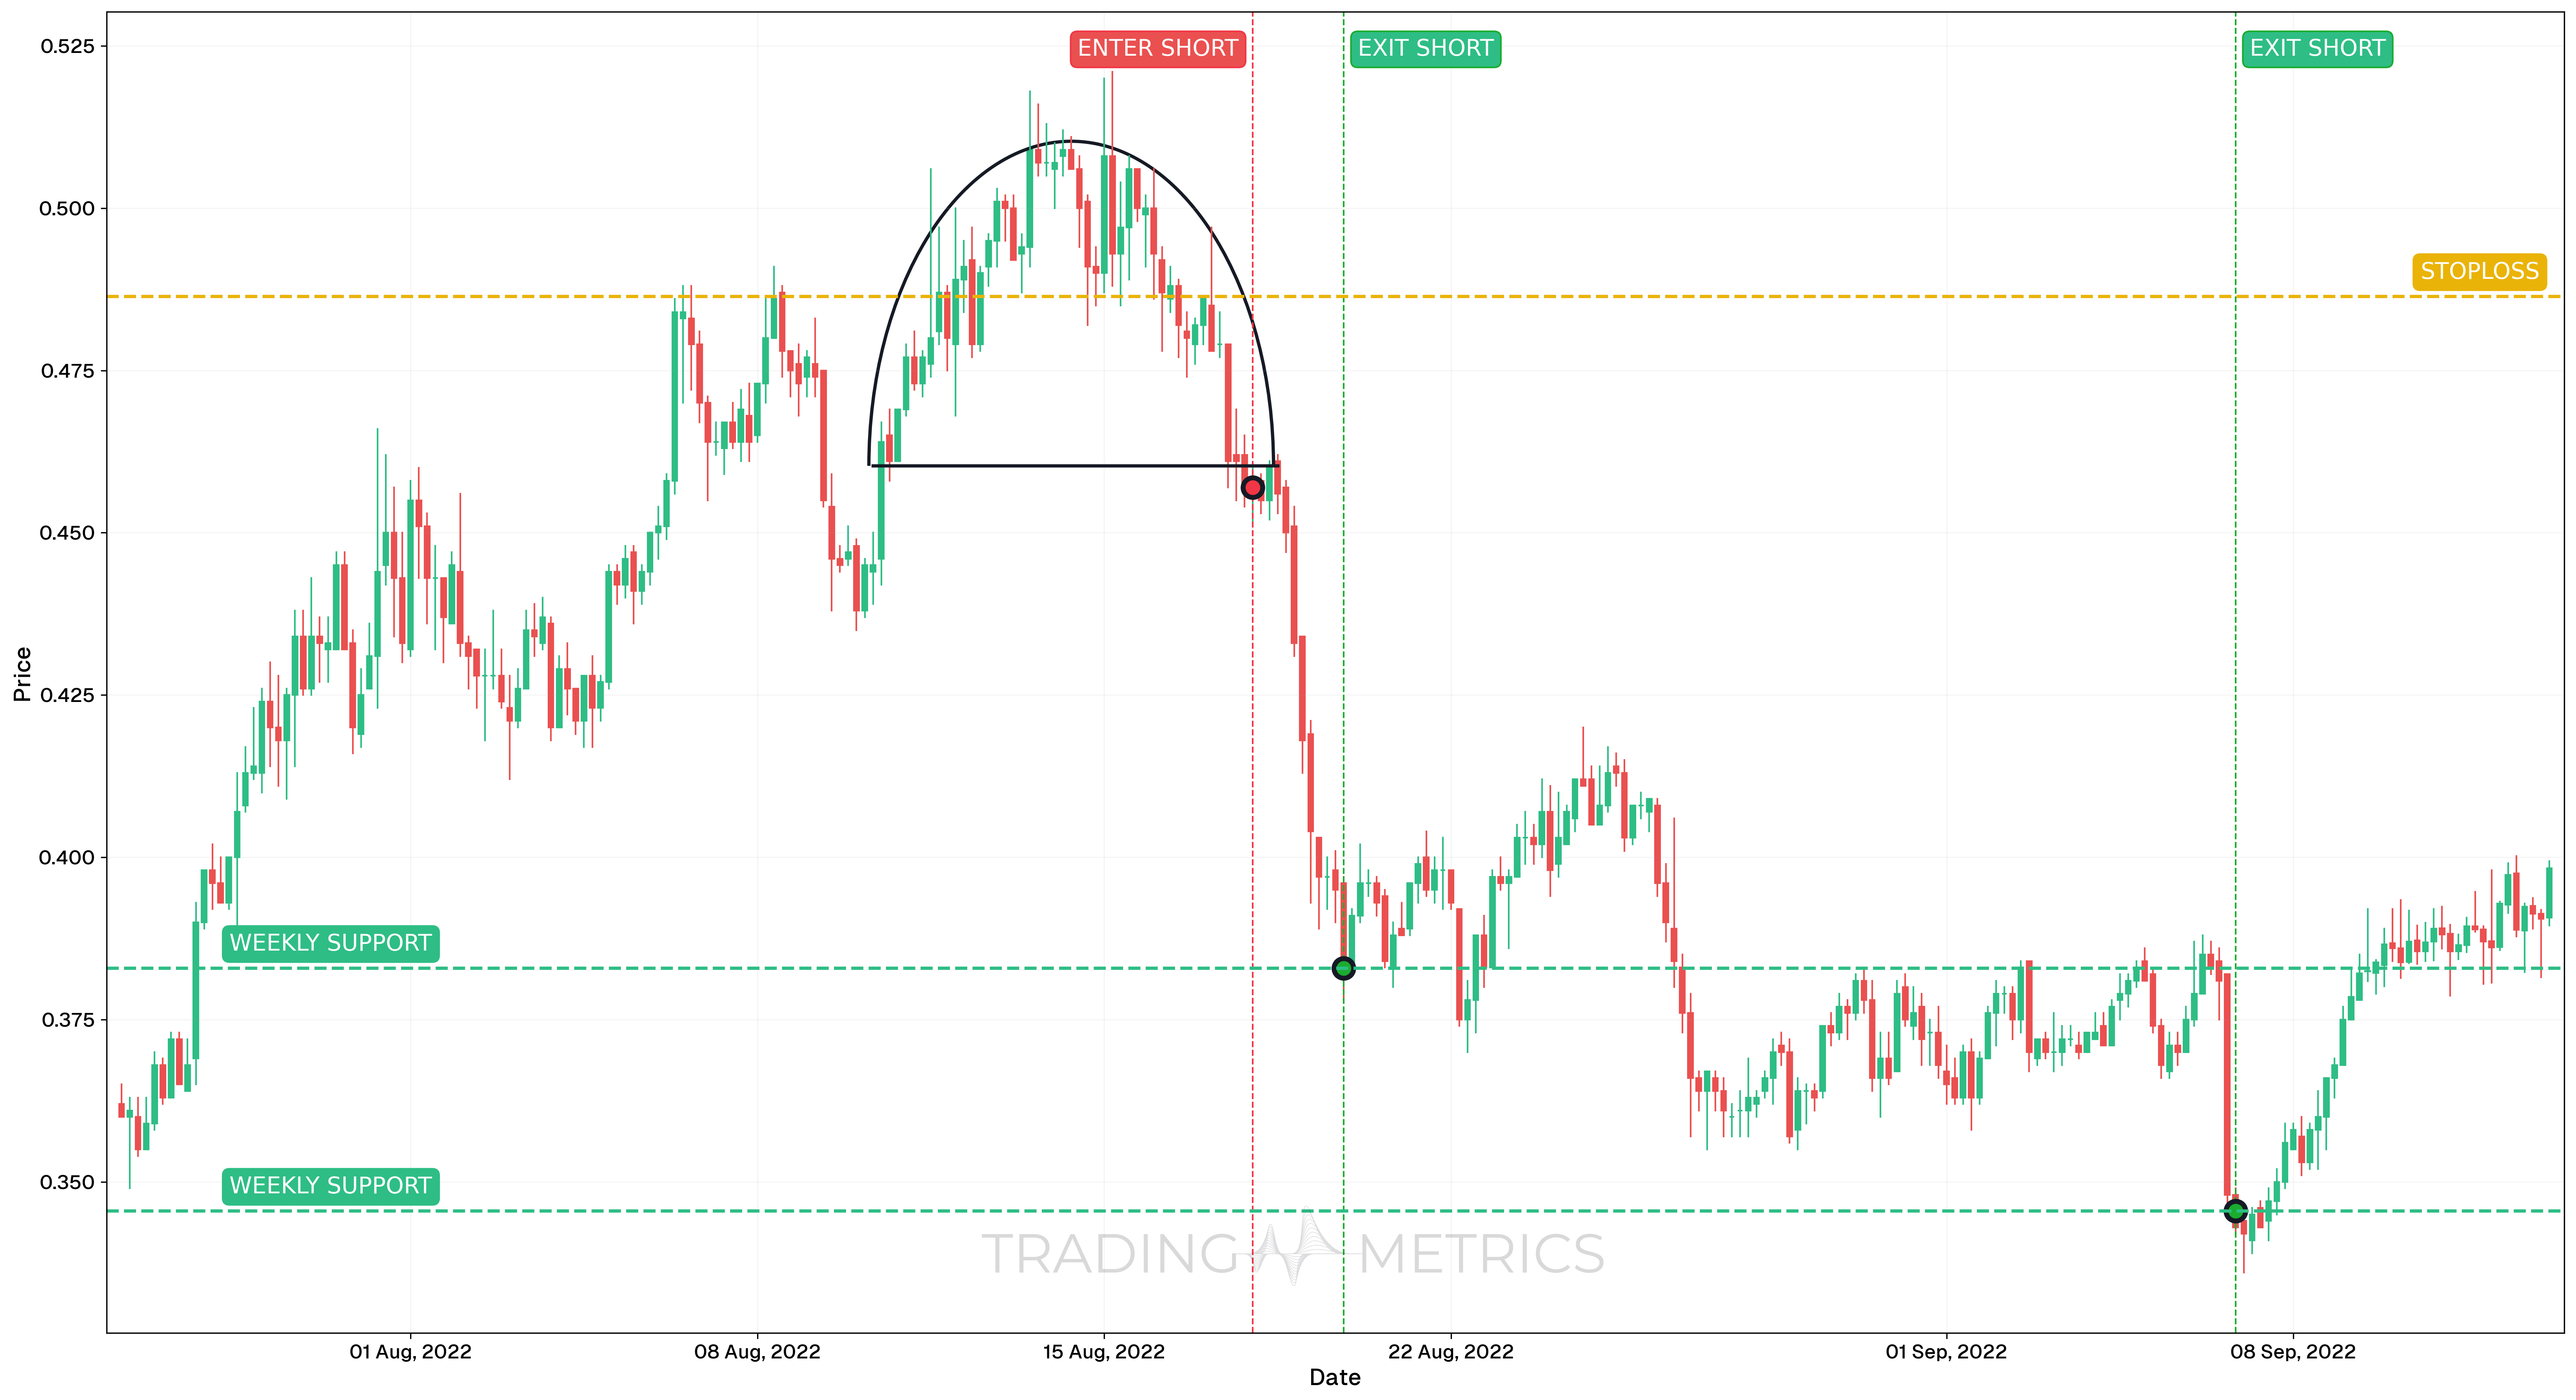
From late July to early September 2022, SXPUSDT developed a clear Rounding Top formation. The price curved gradually over time, showing declining momentum and distribution. The neckline was broken in mid-August, marking the completion of the pattern and confirming a potential bearish reversal.
Trade Setup
- Entry: The short position was opened on August 18, 2022, at 00:00, following a breakdown below the neckline. The setup was supported by a Common Doji that appeared a few candles before the entry, signaling indecision, followed by a strong bearish continuation. Additional confirmation came from the RSI falling below 50.
- Exit: This trade was managed using multiple exits. The first target (TP1) was hit on August 19, 2022, at 20:00, and the second target (TP2) was reached on September 6, 2022, at 20:00. Both levels aligned with previous support and resistance zones and were used to manage risk and lock in profits.
- Outcome: The pattern unfolded as anticipated, with price moving downward in stages. Splitting the position allowed the trader to reduce exposure gradually while capturing the bulk of the trend.
Risk Management
- Stop-Loss placement: The stop-loss was placed at $0.4864, just above the entry candle structure and outside the invalidation zone. This level was chosen to protect the trade if the breakout failed and the price reclaimed the neckline.
- Position sizing: The trade followed a 2% capital risk model, using the entry and stop-loss distance to calculate size and maintain consistent exposure.
- Volatility Consideration: During the pattern formation, Volatility was relatively low but expanded during the breakdown phase. Waiting for confirmation helped avoid early entries and improved timing.
- Adaptive Exit Strategy: Using two predefined exits at major structural levels (TP1 and TP2) allowed for staged profit-taking while staying aligned with technical targets.
Volume Matters: A volume surge on the support break turns the pattern from guesswork to gold.
Pre-Trade Checklist
Lock It In: Pair the pattern with volume spikes and indicators like RSI to cut through noise and boost accuracy.
Key Points
- Curve Shape: The smoother the dome, the stronger the signal - jagged moves weaken it.
- Time Frame: Best on daily or weekly charts for clearer trends.
- Combine with Indicators: Use moving averages or RSI to sharpen your entry.
- Breakout Confirmation: The support break is the flip - don’t move too soon.
- Price Target: Measure from peak to support, project down from the break for your goal.
- Risk Management: Set a stop-loss above the peak to cap losses if it fails.
Timing Is Everything: Acting before the support break can trap you in a false move - wait it out.
Conclusion
The Rounding Top pattern is a sneaky but effective way to catch bearish reversals. Its gradual curve, paired with volume, RSI, and moving averages, makes it a reliable tool. Whether you’re trading crypto, stocks, or forex, this pattern can tip you off to big shifts. Be patient, manage your risk, and let the dome fully form - that slow fade could lead to a fast win.
Frequently Asked Questions
Quick answers based on this page's topic.
The Rounding Top (or 'Inverted Saucer') represents a gradual shift in sentiment. Instead of a sharp rejection, buyers slowly lose interest as sellers gradually increase their pressure. This smooth transition creates a dome shape that signals a sustainable, long-term trend change.
The reversal is confirmed when the price breaks and closes below the 'neckline' support level at the base of the dome. Because the top took a long time to form, the resulting breakout is often the start of a prolonged downtrend.
Yes. Volume typically mirrors the price curve: rising during the initial rally, tapering off at the peak of the dome as conviction fades, and surging again as the price begins to accelerate downward toward the breakdown.