Ascending Broadening Wedge: A Top That Widens Before It Breaks
The Ascending Broadening Wedge pattern is an intriguing bearish reversal signal in technical analysis, often emerging during an uptrend. Visualize it as a widening fan - price swinging between diverging trendlines - before breaking downward. When this pattern takes hold, it’s a sly sign that bullish momentum is overstretching, setting traders up to sell or short the asset as a downtrend nears.
How to Identify the Ascending Broadening Wedge Pattern in Trading
The Ascending Broadening Wedge is a bearish reversal formation. It develops when price rises inside an expanding channel — higher highs and higher lows that grow increasingly unstable. Eventually, the widening swings give way to a breakdown. Here’s how to spot it:
Start with the Big Picture
This pattern forms during an uptrend. Bulls remain in control at first, but the expanding swings hint at instability and growing volatility. The widening channel shows enthusiasm turning erratic.
Trace the Diverging Trendlines
The wedge is defined by two spreading boundaries. Recognizing these lines is key to spotting the setup.
- Lower Trendline: Price makes higher lows, sloping upward.
- Upper Trendline: Price makes higher highs, but each peak stretches further, diverging from the lower line.
- Wedge Formation: The gap between the two lines widens, reflecting increased instability and rising volatility.
Zero in on the Support Line
The lower boundary is your support line. It’s where buyers have repeatedly defended price. When that line is tested, the wedge is on the verge of completion.
Watch the Breakdown
The bearish trigger comes when price breaks below support.
- A decisive close under the trendline or
- A strong bearish candle
Both confirm the wedge has resolved downward. That’s your entry trigger.
Check Volume for Additional Confirmation
Volume adds confidence to the signal.
- Builds during the uptrend.
- Peaks as swings widen.
- Spikes on the breakdown, confirming the bearish reversal.
When you see that surge, the wedge’s failure is real.
Size the Slide: Measure the height of the wedge at its widest point and project it downward from the break for a solid price target.
How to Trade the Ascending Broadening Wedge Pattern (Trading Example)
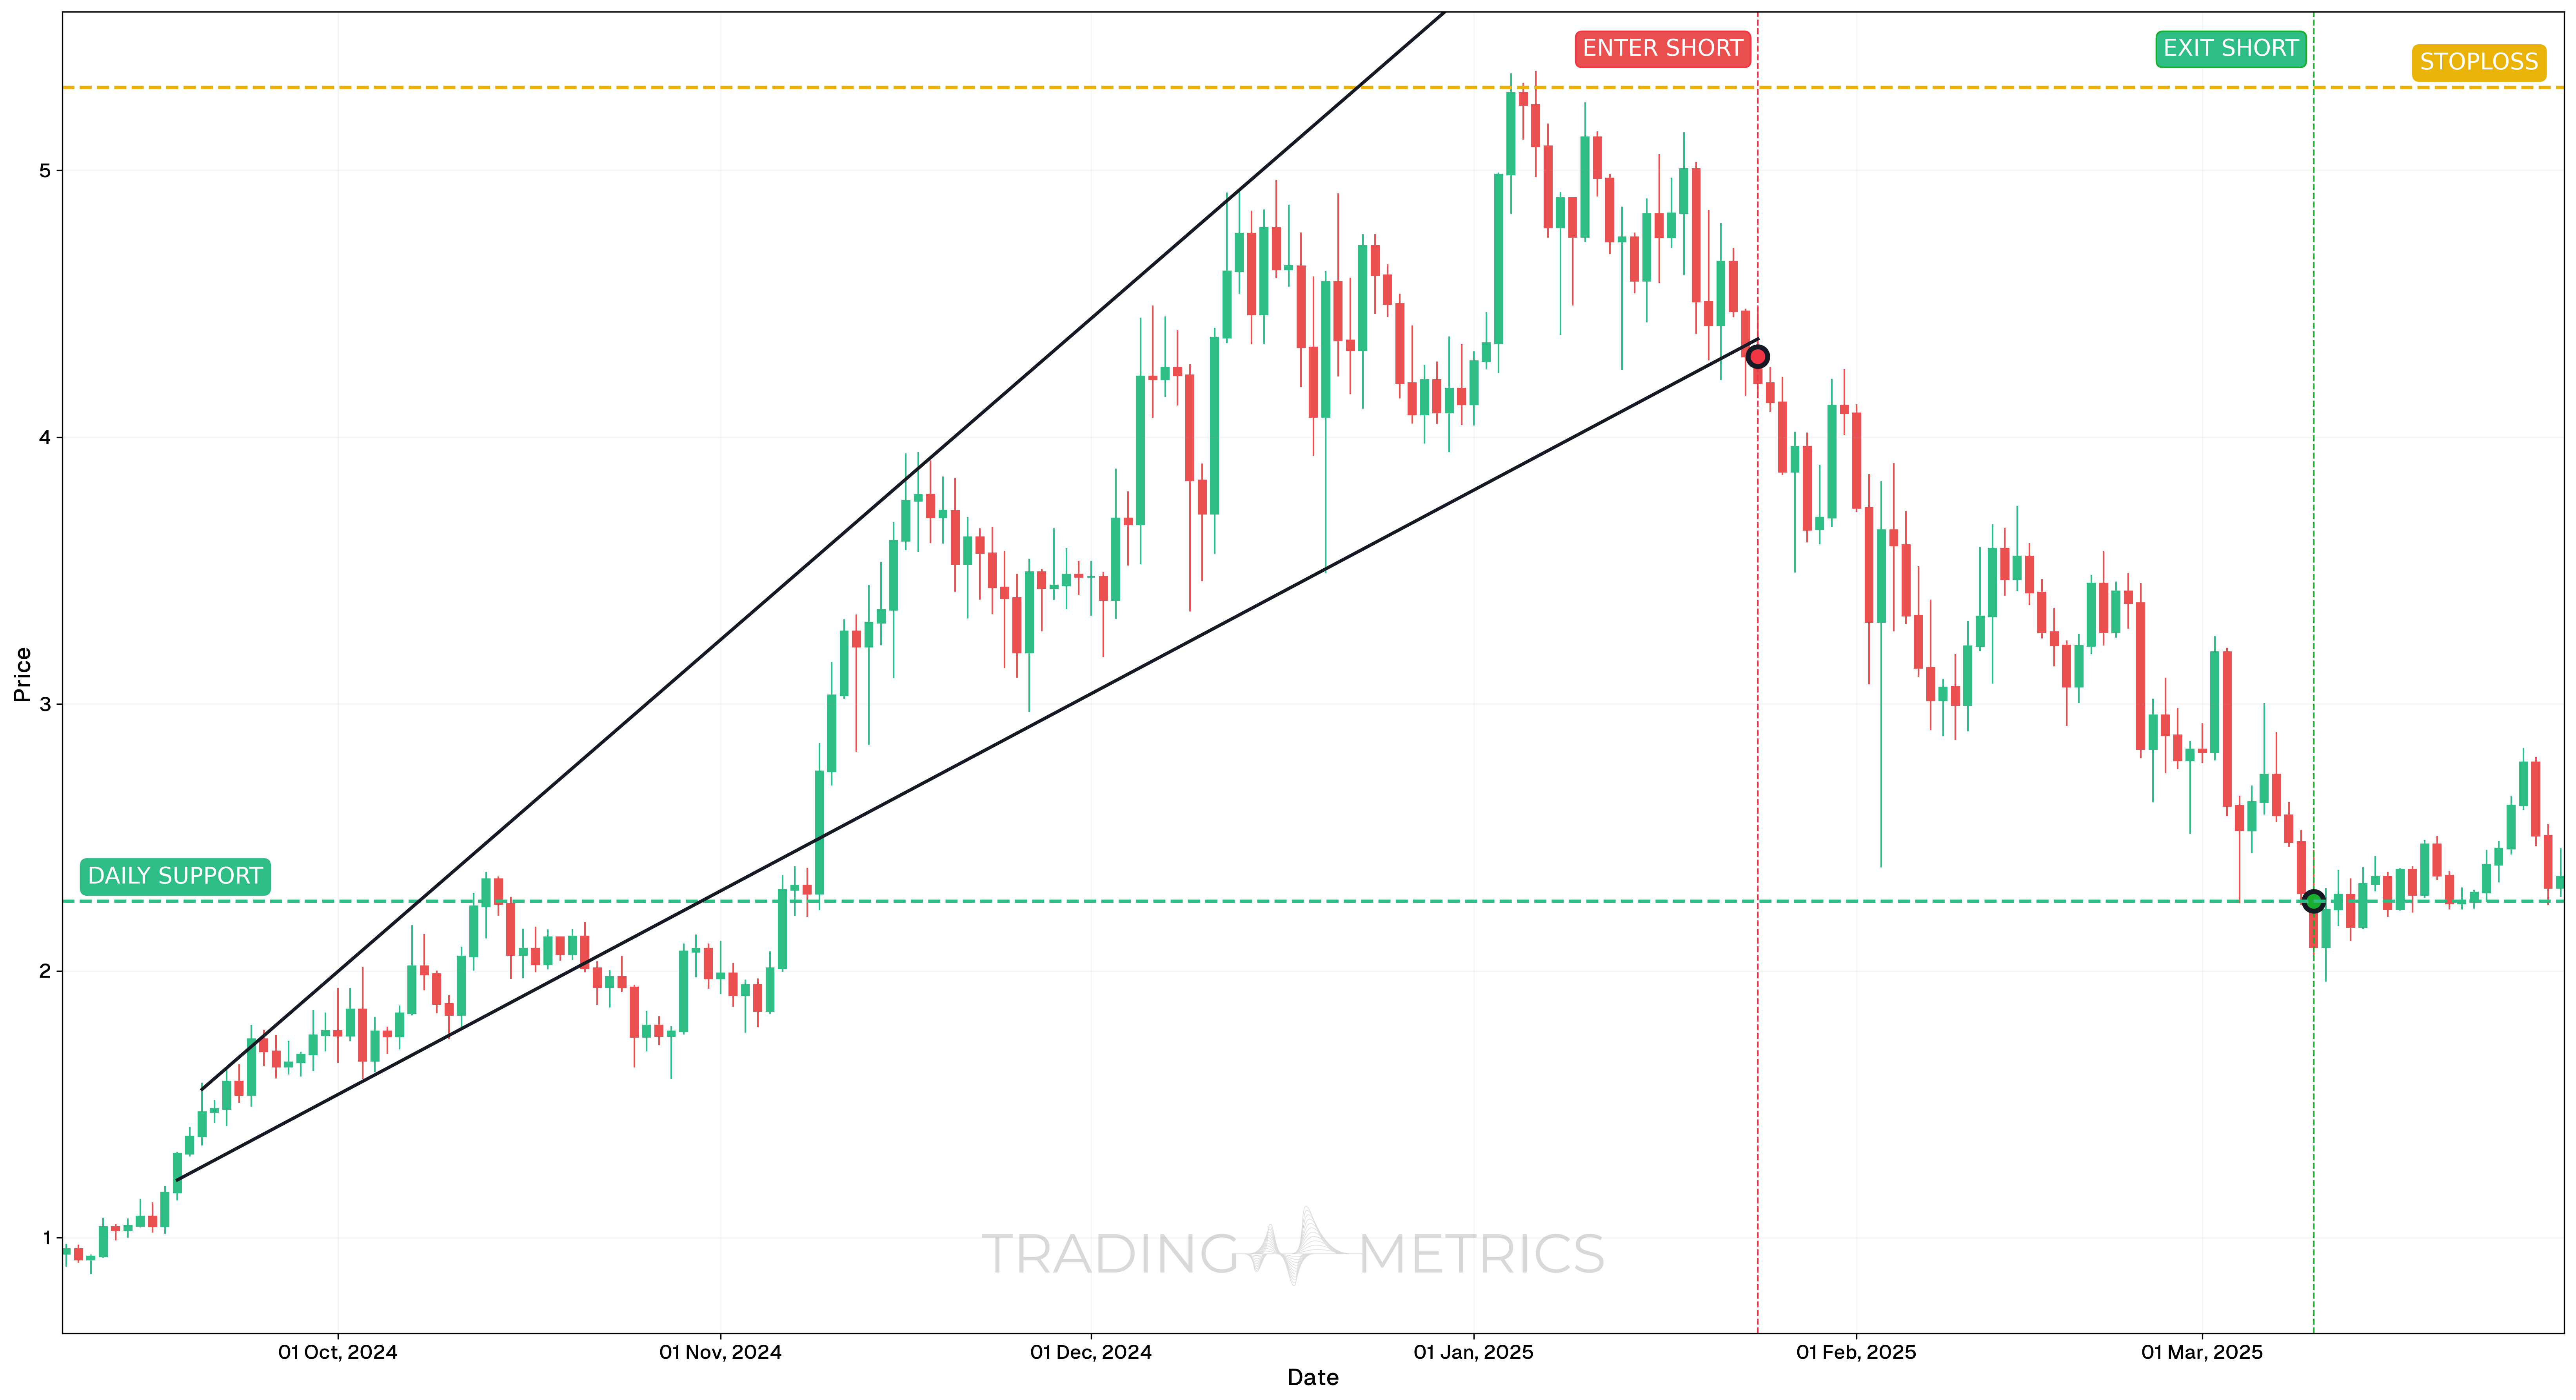
To illustrate how the Ascending Broadening Wedge pattern can be used to enter a trade, we will choose the SUIUSDT pair. This is a newer altcoin trading on the daily chart, where breakout setups can occur after prolonged volatility expansion.
Analysis
From September 2024 to early 2025, SUIUSDT formed an Ascending Broadening Wedge. The price moved within an expanding channel defined by higher highs and higher lows, but with increasingly unstable momentum. By late January, price action broke decisively below the rising support trendline, confirming a bearish breakout from the expanding structure.
Trade Setup
- Entry: The short position was entered on January 24, 2025, at $4.2023, after a clean breakdown from the Ascending Broadening Wedge. The breakdown was confirmed by several momentum signals: RSI had already fallen below 50, showing declining strength, and StochRSI had dropped below 20, signaling bearish momentum pressure.
- Exit: The trade was closed on March 10, 2025, at $2.2607, near a key support-turned-resistance zone. This level had previously acted as a reaction point and aligned with the measured move from the wedge structure.
- Outcome: The Ascending Broadening Wedge resulted in a 46.2% move from entry to exit. Momentum confirmation and pattern-based breakdown made this a high-conviction short setup.
Risk Management
- Stop-Loss placement: The stop-loss was placed at $5.3107, above the wedge highs. This level would invalidate the bearish setup if price made a new higher high beyond the wedge.
- Position sizing: The trade was sized using a 2% capital risk model, based on the distance between the entry and stop-loss levels.
- Risk-Reward Ratio: This setup produced a Risk-Reward Ratio of 1:1.75 - a solid tradeoff between risk and return for a pattern with strong breakdown conviction.
- Volatility Consideration: The expanding structure itself reflected rising Volatility. By waiting for a confirmed break below support, the trade avoided premature entries and minimized whipsaw risk.
- Adaptive Exit Strategy: The conservative exit captured the bulk of the move. More aggressive traders could have targeted deeper support zones near $2.00, but the risk of a bounce at structural support justified locking in profits early.
Volume Flare: A volume spike on the support break fans the pattern into a bearish blaze.
Pre-Trade Checklist
Fan the Proof: Pair the pattern with volume flares and indicators like RSI to dodge traps and sharpen your aim.
Key Points
- Line Divergence: The wider the fan, the stronger the signal - messy lines muddy it.
- Time Frame: Strikes best on daily or weekly charts.
- Combine with Indicators: Lean on moving averages or RSI for precision.
- Breakout Confirmation: The support break turns the tide - don’t rush it.
- Price Target: Measure the wedge’s widest height, project down from the break for your goal.
- Risk Management: Set a stop-loss above the peak to limit damage if it fails.
Wait for the Crack: Jumping before the support break risks a fan-flapping fakeout - hold steady.
Conclusion
The Ascending Broadening Wedge pattern is a slick pick for nabbing bearish reversals. Its widening sprawl, teamed with volume, RSI, and moving averages, can spotlight big shifts. Whether in crypto, stocks, or forex, this pattern hones your edge. Stay cool, manage your risk, and let the fan spread - that widening wedge could snap into a winning drop.
Frequently Asked Questions
Quick answers based on this page's topic.
While the price makes higher highs, the widening range shows that volatility and emotional instability are increasing. This 'out of control' expansion suggests that the bulls are losing their disciplined grip, often leading to a violent downward breakdown once support is lost.
Confirmation occurs when the price closes decisively below the lower ascending trendline. A high-probability short entry is usually supported by a spike in selling volume, proving that the period of market chaos has resolved in favor of the bears.
Measure the vertical distance between the highest peak and the lowest trough within the wedge structure. Project this same distance downward from the breakout point on the lower trendline to establish a mathematical take-profit goal.