Trading the Bullish Crab: Catching the Deepest Fib Reversals
The Bullish Crab Pattern is a precise bullish reversal formation in technical analysis, appearing after a strong downtrend. It follows an XABCD structure with extreme Fibonacci ratios. The defining feature is the D point, which completes at a 161.8% extension of XA, often aligned with a 224%–361.8% projection of BC. This extreme exhaustion zone signals that bearish momentum has overextended, giving traders a chance to enter long positions as a fresh uptrend takes shape.
How to Identify the Bullish Crab Pattern in Trading
The Bullish Crab Pattern is one of the sharpest harmonic reversal setups. Picture the market plunging lower and lower, stretching into extreme Fibonacci depths. At that exhaustion point, sellers lose steam and buyers seize the chance to reverse the trend. Here’s how to spot it:
Start with the Big Picture
This pattern develops after a clear downtrend. Sellers push aggressively, but the Bullish Crab shows when the decline has gone too far. Its extreme Fibonacci extension signals the point where a reversal is most likely.
Trace the XABCD Legs
The structure unfolds across five swings, each defined by precise Fibonacci ratios. Spotting these levels validates the setup.
- XA: The initial sharp decline that sets the base.
- AB: A rebound upward into 38.2%–61.8% of XA.
- BC: Another decline downward, retracing 38.2%–88.6% of AB but not breaking below X.
- CD: A deep extension downward, completing at the 161.8% extension of XA, often reaching into the 261.8%–361.8% projection of BC.
- D Point: The completion of the Bullish Crab, where buyers step in at the Potential Reversal Zone (PRZ).
Zero in on D (the Reversal Zone)
D is the critical area where exhaustion sets in. The PRZ forms at the overlap of the 161.8% extension of XA and the BC projection zone (261.8%–361.8%). If price stabilizes here, it signals strong potential for a bullish reversal.
Watch the Breakout
Confirmation comes when price rebounds at D and drives higher.
- A strong bullish candle or
- A close above B
Both confirm that buyers are stepping in and a reversal is underway. That’s your entry trigger.
Check Volume for Additional Confirmation
Volume gives the final piece of conviction.
- Heavy activity on XA (sellers dominating).
- Decline on AB and BC (momentum easing).
- Then a surge at D as buyers flood in.
When that spike appears, the Bullish Crab’s bullish reversal has real strength behind it.
Rise Claw: Measure the XA leg height and project it upward from D, or target the 38.2% or 61.8% retracement of XD for a realistic price target.
How to Trade the Bullish Crab Pattern (Trading Example)
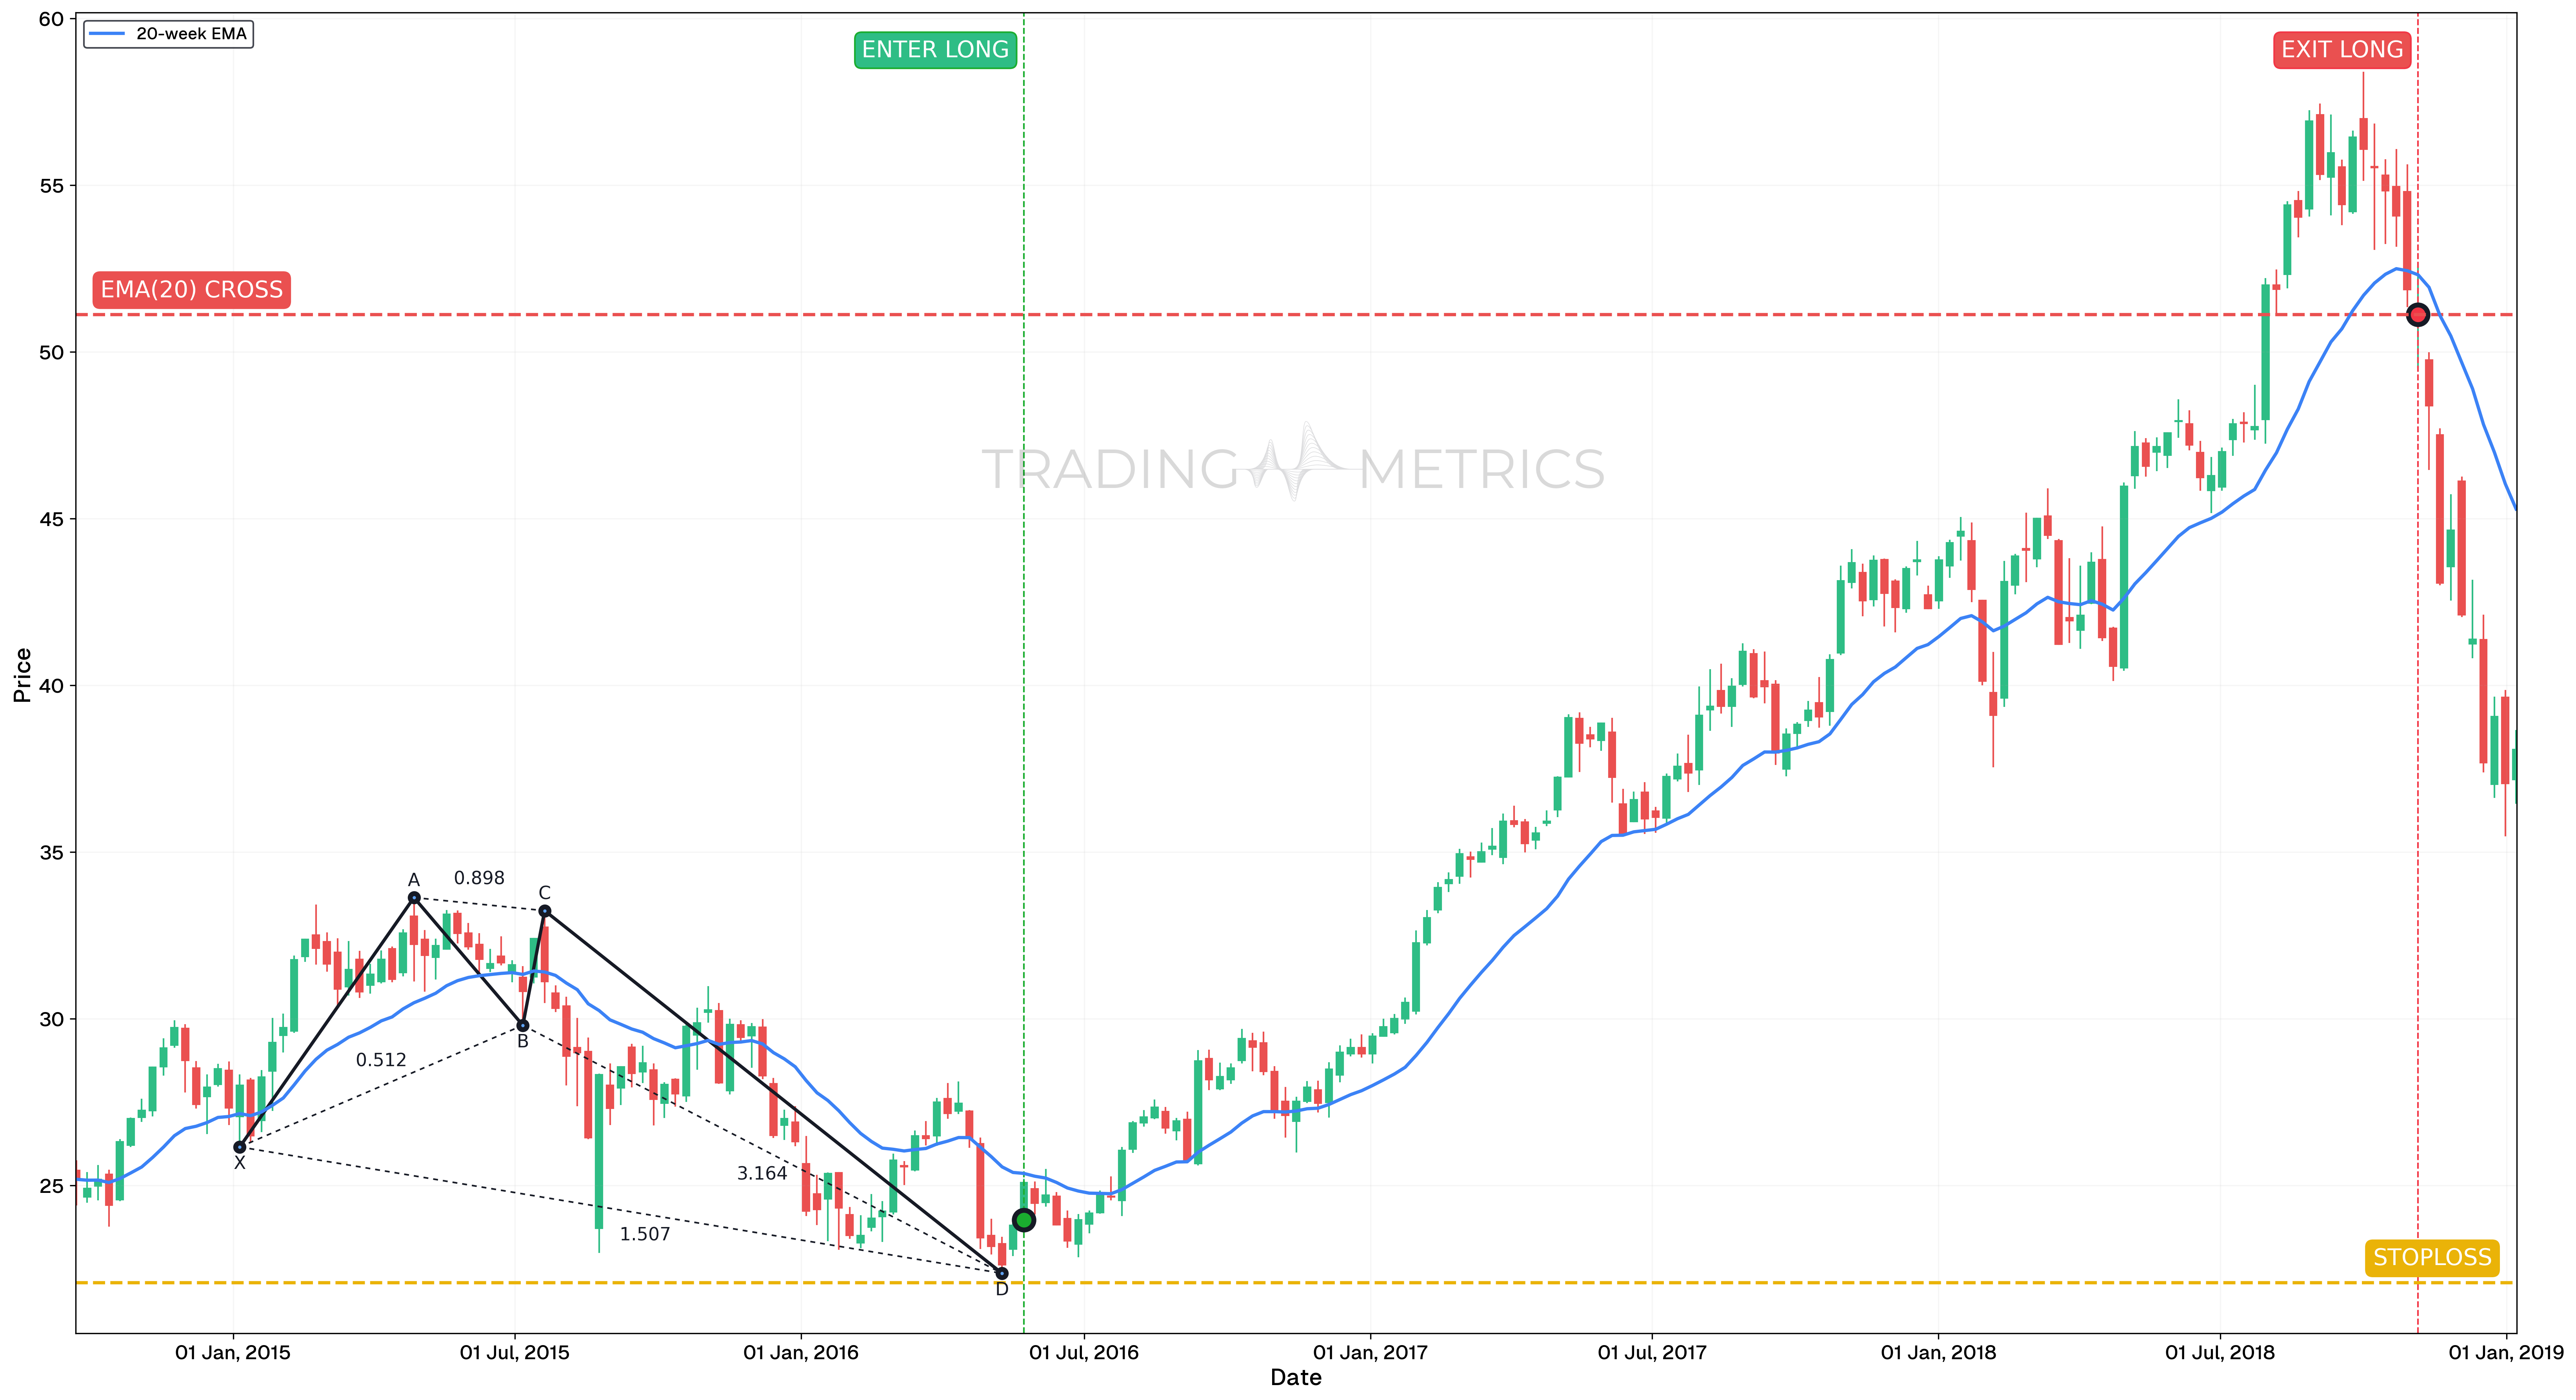
To demonstrate how the Bullish Crab harmonic pattern can be traded, we’ll analyze the AAPL chart on the weekly timeframe. This multi-year pattern offered a rare but powerful long-term reversal signal, forming during a broader macro correction.
Analysis
Between September 2014 and January 2019, AAPL formed a long-term Bullish Crab pattern. The final CD leg extended beyond the standard retracement zones, consistent with the deep structure typical of the Bullish Crab pattern.
At the PRZ (Potential Reversal Zone) near $25.45, several bullish confluences appeared:
- RSI started to rise
- StochRSI crossed bullish
- The price formed a recognizable harmonic structure supported by long-term volume stabilization
Trade Setup
-
Entry: The trade was initiated at $25.45 on May 23, 2016, following confirmation of:
-
Exit: The trade was exited at $51.12 on November 12, 2018, after:
- Multiple months of uptrend continuation
- EMA(20) weekly crossing above the candles, signaling loss of momentum and growing pullback risk
-
Outcome: The Bullish Crab pattern correctly anticipated a powerful uptrend. Holding through the weekly structure captured a large trend cycle, aligning with macro and technical confirmation.
Risk Management
- Stop-Loss placement: The stop-loss was placed below the PRZ, at $22.09, accounting for potential deep spikes without invalidating the structure.
- Risk-Reward Ratio: 1:7.64 this high ratio was achieved by entering close to structural completion and exiting after technical exhaustion.
- Position sizing: A 2% capital risk model was used to calculate position size based on the entry-stop distance.
- Volatility Consideration: The PRZ occurred after volatility expansion. Entry was delayed until volatility compressed and momentum turned.
- Adaptive Exit Strategy: A single exit was used at a key EMA-based resistance, but partial exits could have been applied at Fibonacci extension targets for refined risk control.
Volume Claw: A volume spike at D with confirmation claws the pattern into a bullish surge.
Pre-Trade Checklist
Claw the Proof: Pair the pattern with volume spikes and indicators like RSI to dodge fakes and boost your odds.
Key Points
- Fibonacci Precision: Extreme ratios (38.2%-61.8% AB, 38.2%-88.6% BC, 161.8% XA) boost reliability - loose fits dilute it.
- Time Frame: Claws deepest on daily or weekly charts after downtrends.
- Combine with Indicators: Use moving averages or RSI to confirm the reversal.
- Breakout Confirmation: A close above B sets the turn - don’t jump at D alone.
- Price Target: Measure the XA leg or use Fibonacci Retracements of XD for targets above the close.
- Risk Management: Set a stop-loss below D to limit losses if it fails.
Wait for the Claw: Acting before confirmation risks a Bullish Crab trap - let the reversal snap.
Conclusion
The Bullish Crab Pattern is a trader’s meticulous tool for catching bullish reversals. Its XABCD stretch, paired with volume, RSI, and moving averages, can claw into big gains. Whether in crypto, stocks, or forex, this pattern sharpens your edge. Stay precise, manage your risk, and let the Bullish Crab strike - that deep harmonic snap could surge into a winning trade.
Frequently Asked Questions
Quick answers based on this page's topic.
The Bullish Crab represents a 'Final Flush.' It identifies a downtrend that has reached an extreme mathematical limit at the 161.8% extension of XA. This extreme level is where the last remaining shorts are squeezed and buyers step in to capitalize on a severely undervalued price.
The Potential Reversal Zone (PRZ) is found at the convergence of three levels: the 161.8% extension of the XA leg, a 224% to 361.8% extension of the BC leg, and the 1.618 projection of the AB=CD move. This confluence creates a very strong 'mathematical floor' for price action.
While the geometry remains the same, the Crab is most powerful on Daily and 4-hour charts. On lower timeframes, 'extreme extensions' can be easily exceeded by minor news events, whereas on higher timeframes, they represent major cycle exhaustion points for smart money.