Ladder Bottom Pattern: When a Downtrend Quietly Breaks
The Ladder Bottom pattern is a rare but powerful bullish reversal signal in technical analysis, usually forming at the end of a downtrend. It’s a five-candle formation that visually resembles steps on a ladder descending before a sharp reversal. This structure reflects diminishing bearish momentum followed by a strong bullish breakout, offering a strategic entry point for traders eyeing the turn.
How to Identify the Ladder Bottom Pattern in Trading
The Ladder Bottom is a bullish reversal candlestick formation. It develops after a downtrend when sellers push persistently lower but then stall, giving buyers room to take over. Confirmation comes with the final bullish surge. Here’s the step-by-step guide.
Start with the Big Picture
This pattern shows up after a downtrend. Sellers remain dominant, but the Ladder Bottom signals that their strength is fading and buyers are preparing for a reversal.
Trace the Candle Sequence
The setup is defined by five candles:
- First Three Candles: Consecutive bearish candles with progressively lower closes.
- Fourth Candle: A small bearish candle or a doji, showing hesitation and loss of momentum.
- Fifth Candle: A strong bullish candle closing above the fourth candle’s high, confirming the shift in control.
Zero in on the Confirmation Level
The confirmation level is the high of the fourth candle. A close above this level flips the bias to bullish.
Watch the Breakout
The bullish trigger comes when the fifth candle closes above the fourth candle’s high. That’s your entry point, signaling that buyers are in charge.
Check Volume for Additional Confirmation
Volume behavior can reinforce the pattern:
- Light or fading volume on the first four candles shows seller exhaustion.
- A surge in volume on the fifth candle strengthens the bullish reversal.
Step Measure: Use the height of the final bullish candle or nearby resistance to estimate a realistic upside target after confirmation.
How to Trade the Ladder Bottom Pattern (Trading Example)
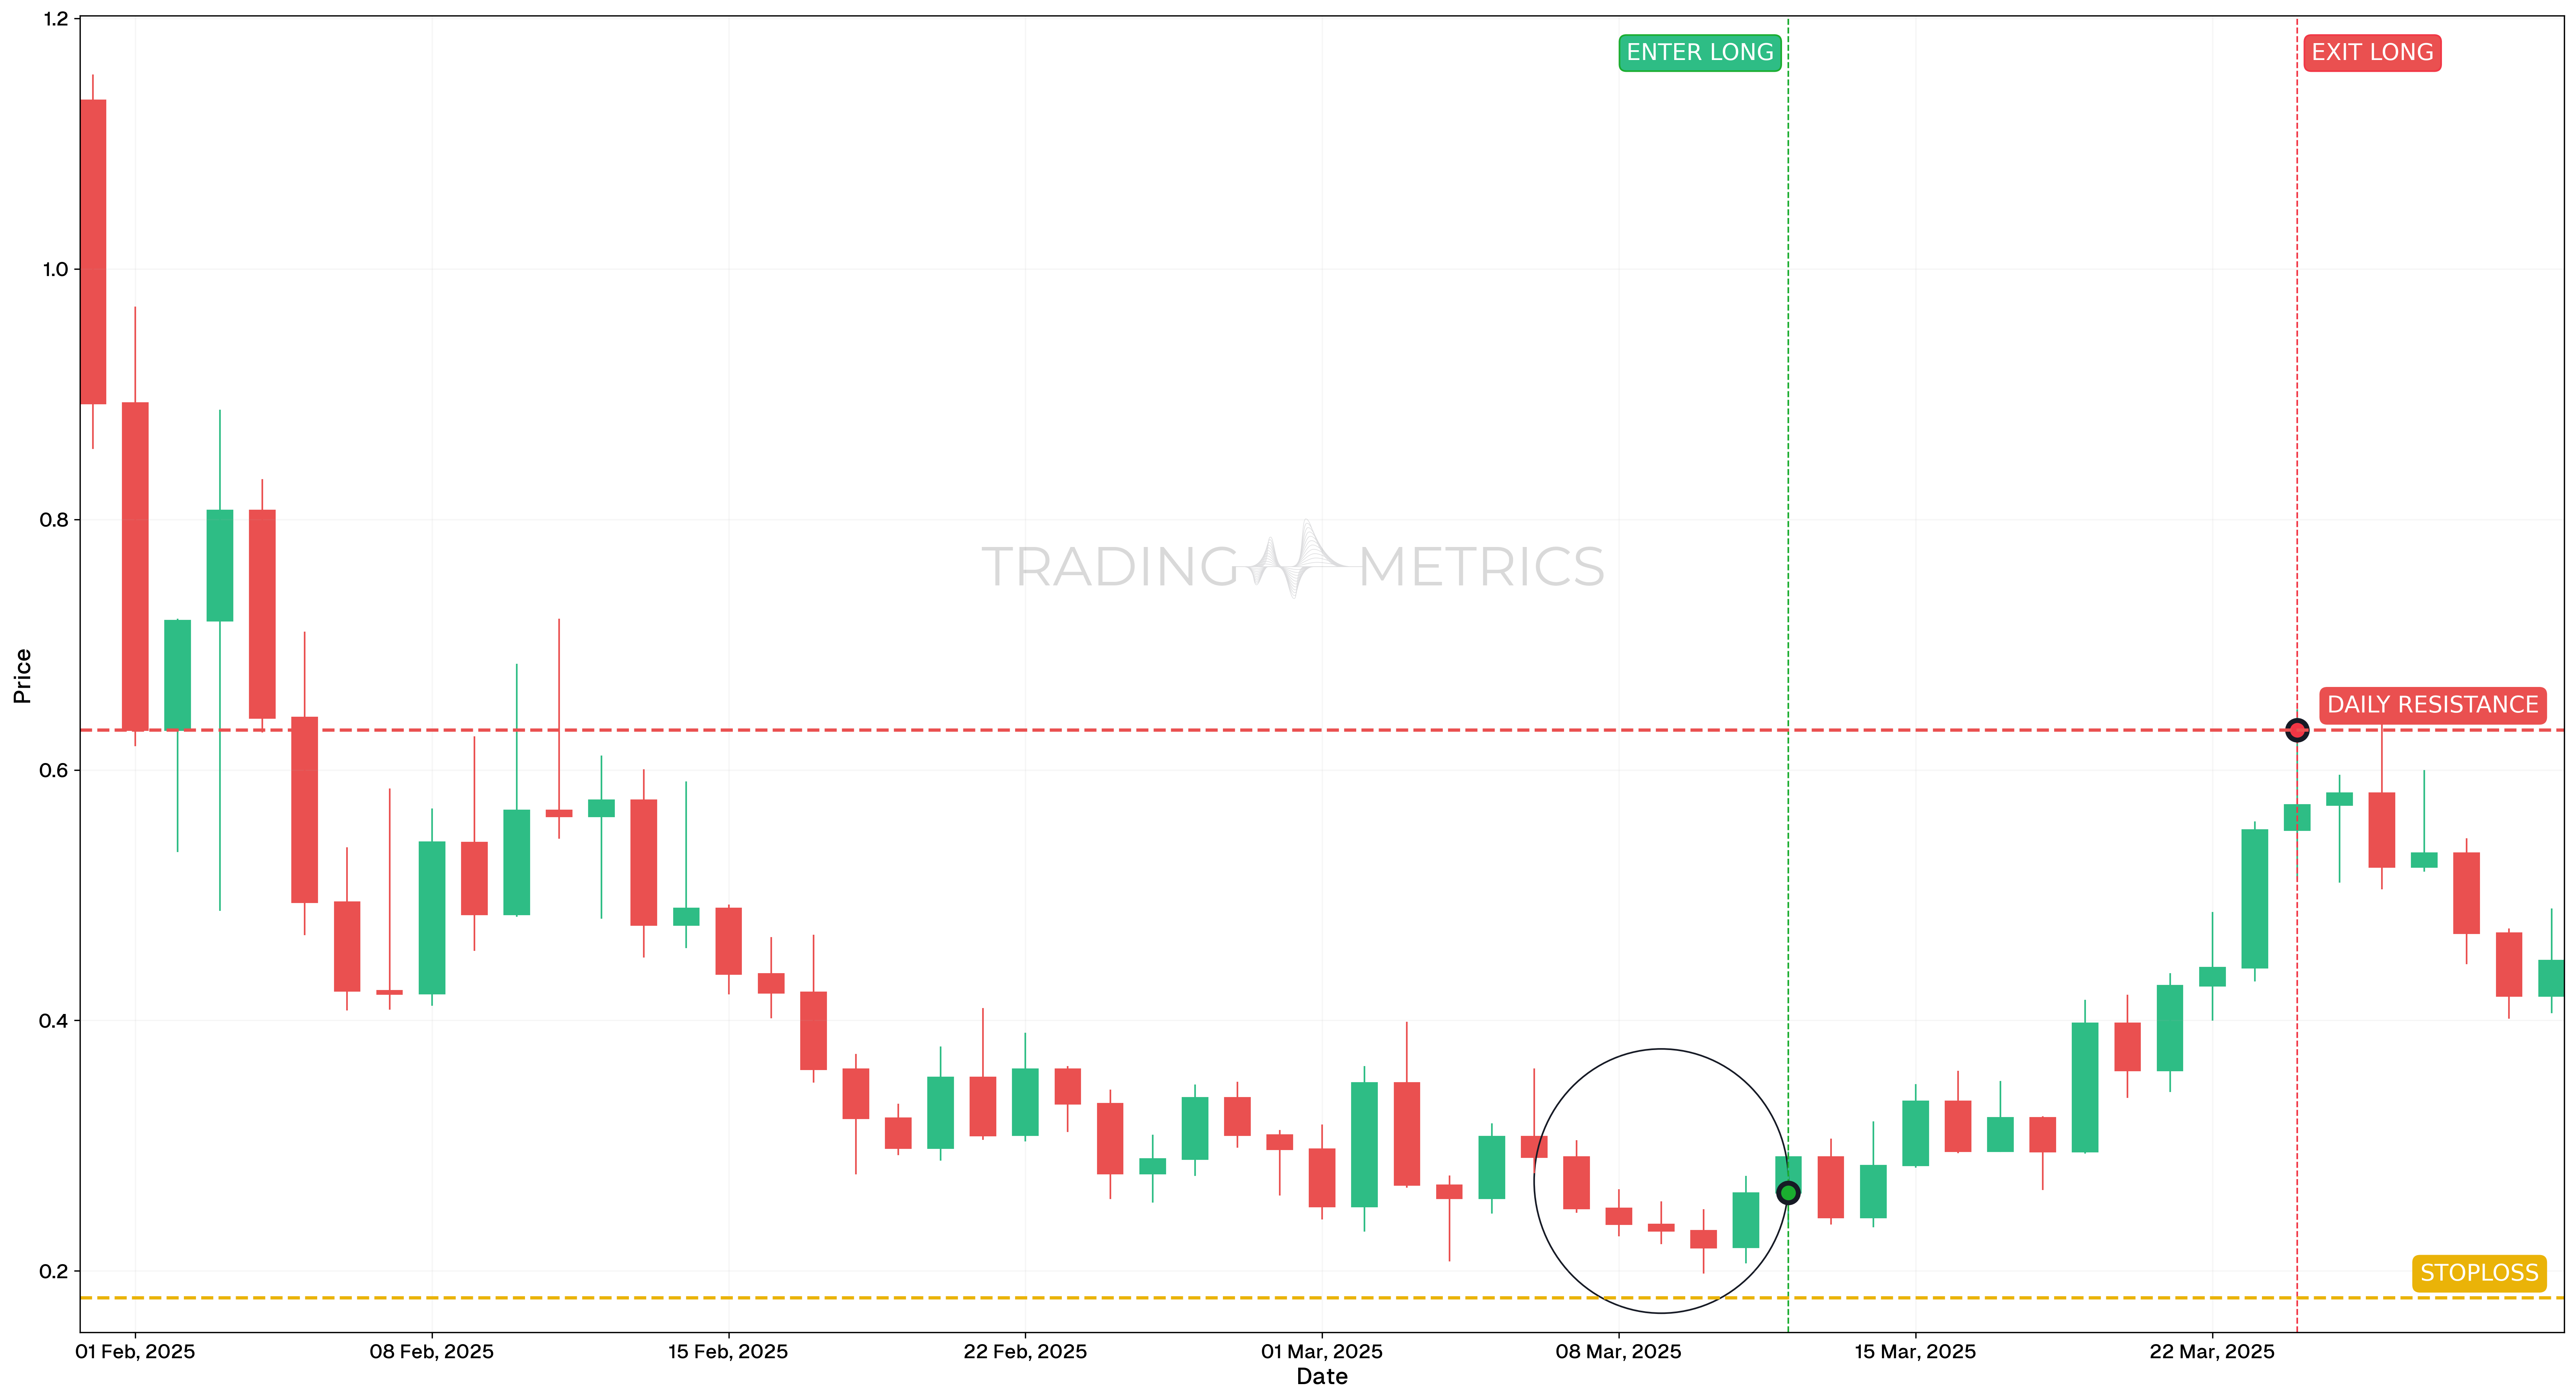
This trade demonstrates the Ladder Bottom pattern using the FARTCOINUSDT PERP pair on the daily timeframe. This bullish reversal formed after a persistent downtrend, indicating a shift in sentiment and momentum.
Analysis
On March 12, 2025, the Ladder Bottom pattern was completed on the daily chart after a steady decline. The last candle closed strong, confirming bullish intent. The reversal was also supported by rising Momentum Indicators, which aligned with the price structure.
Trade Setup
-
Entry: The long trade was entered on March 12, 2025, at $0.2624, immediately after the Ladder Bottom pattern completed. Entry was confirmed by:
-
Exit: The position was closed at $0.6318 on March 24, 2025, as price reached a daily resistance zone.
-
Outcome: This was a clean reversal trade with momentum confirmation, capturing a strong breakout leg after the bottom structure.
Risk Management
- Stop-Loss Placement: The stop-loss was set at $0.1784, just below the final support wick of the pattern.
- Risk-Reward Ratio: 1:4.40 – a strong Risk-Reward Ratio indicating high potential reward with relatively defined risk.
- Position sizing: Position size was calculated using a 2% capital risk model, based on the distance between entry and stop.
- Volatility Consideration: volatility contracted during the bottom formation and expanded on breakout, allowing for a favorable entry without excessive downside noise.
- Momentum Confirmation: Both RSI and StochRSI gave early bullish signals, reducing uncertainty and improving entry confidence.
Volume Shift: A volume surge on the final candle validates the bullish breakout and boosts the setup’s strength.
Pre-Trade Checklist
Bullish Boost: Validate the pattern with indicators like RSI and volume to avoid traps and improve success rates.
Key Points
- Structure Integrity: A clear 5-candle structure is key - rushed or incomplete setups lack conviction.
- Best on Daily/Weekly: The pattern shines on higher timeframes after downtrends.
- Pair with Indicators: Use EMAs, MACD, or RSI for confirmation.
- Volume Spike: A surge in volume on the final candle validates the breakout.
- Target Setting: Use the height of the bullish candle or next resistance to set exit zones.
- Risk Control: A stop-loss below the pattern’s low helps cap downside risk.
Don’t Jump the Ladder: Wait for the fifth candle confirmation before acting - premature entries weaken risk/reward.
Conclusion
The Ladder Bottom pattern is a high-conviction reversal setup that marks the end of a downtrend with precision. With its five-step structure, volume confirmation, and momentum shift, it’s a solid ally for spotting early bullish reversals. In stocks, crypto, or forex, the Ladder Bottom gives patient traders a tactical edge. Wait for structure, seek confirmation, and trade the breakout with a plan.
Frequently Asked Questions
Quick answers based on this page's topic.
The Ladder Bottom is a rare, five-candle sequence that marks the end of a downtrend with precision. It features three progressively lower red candles (the ladder), followed by a candle with a long upper wick, and finally a large green breakout candle that confirms a total regime change in favor of buyers.
It represents 'Seller Exhaustion and Capitulation.' After a relentless sell-off, the fourth candle shows buyers attempting to push up (the upper wick). The fifth day's surge is the final proof that sellers have completely run out of supply, forcing a rapid trend reversal as buyers take control.
Yes, but only upon the close of the fifth (bullish) candle. Because the pattern is rare and complex, premature entries can be dangerous. Waiting for the final green candle ensures that the momentum shift is real and that the 'ladder' of selling has officially been broken.