Three Inside Down Pattern: A Three-Candle Top Confirmation
The Three Inside Down pattern is a structured bearish reversal signal in technical analysis, typically appearing near the peak of an uptrend. It consists of three candles that illustrate the transition from bullish control to bearish pressure. The first candle is a strong bullish advance, the second is a smaller retracement that forms within the prior body, and the third is a decisive bearish candle that closes below the first candle’s midpoint. When this pattern develops, it highlights fading bullish momentum and growing seller strength, signaling traders to consider short opportunities as a potential downtrend begins.
How to Identify the Three Inside Down Pattern in Trading
The Three Inside Down is a bearish reversal candlestick formation. It develops over three candles at the crest of an uptrend, starting with bullish strength, followed by hesitation, and then a decisive bearish move. The setup signals that sellers have outmaneuvered buyers. Here’s how to spot it:
Start with the Big Picture
This pattern forms after an uptrend. The market shows strong buying momentum at first, but the inside bar and bearish follow-through reveal a momentum shift.
Trace the Three-Candle Sequence
The structure unfolds in three steps:
- First Candle: A long bullish candle, closing near its high and extending the uptrend.
- Second Candle: A small bearish candle, fully contained within the first candle’s body (an inside bar), showing hesitation.
- Third Candle: A long bearish candle, closing below the second candle’s low and ideally below the first candle’s open, confirming the shift in control.
Zero in on the Confirmation Level
The confirmation level is the low of the second candle. A close below this level by the third candle validates the reversal. For stronger conviction, traders also look for a close below the first candle’s open, which signals a more decisive shift in control.
Watch the Breakdown
The bearish trigger comes when the third candle closes below the second candle’s low.
- This is the entry point for traders.
- A deeper close below the first candle’s open strengthens the bearish case.
Check Volume for Additional Confirmation
Volume adds credibility to the pattern.
- Rises on the first candle as buyers dominate.
- Dips on the second candle as indecision creeps in.
- Spikes on the third candle, showing bears have taken full control.
Drop Crush: Measure the first candle’s body or use nearby support levels to project a realistic price target downward from the third candle’s close.
How to Trade the Three Inside Down Pattern (Trading Example)
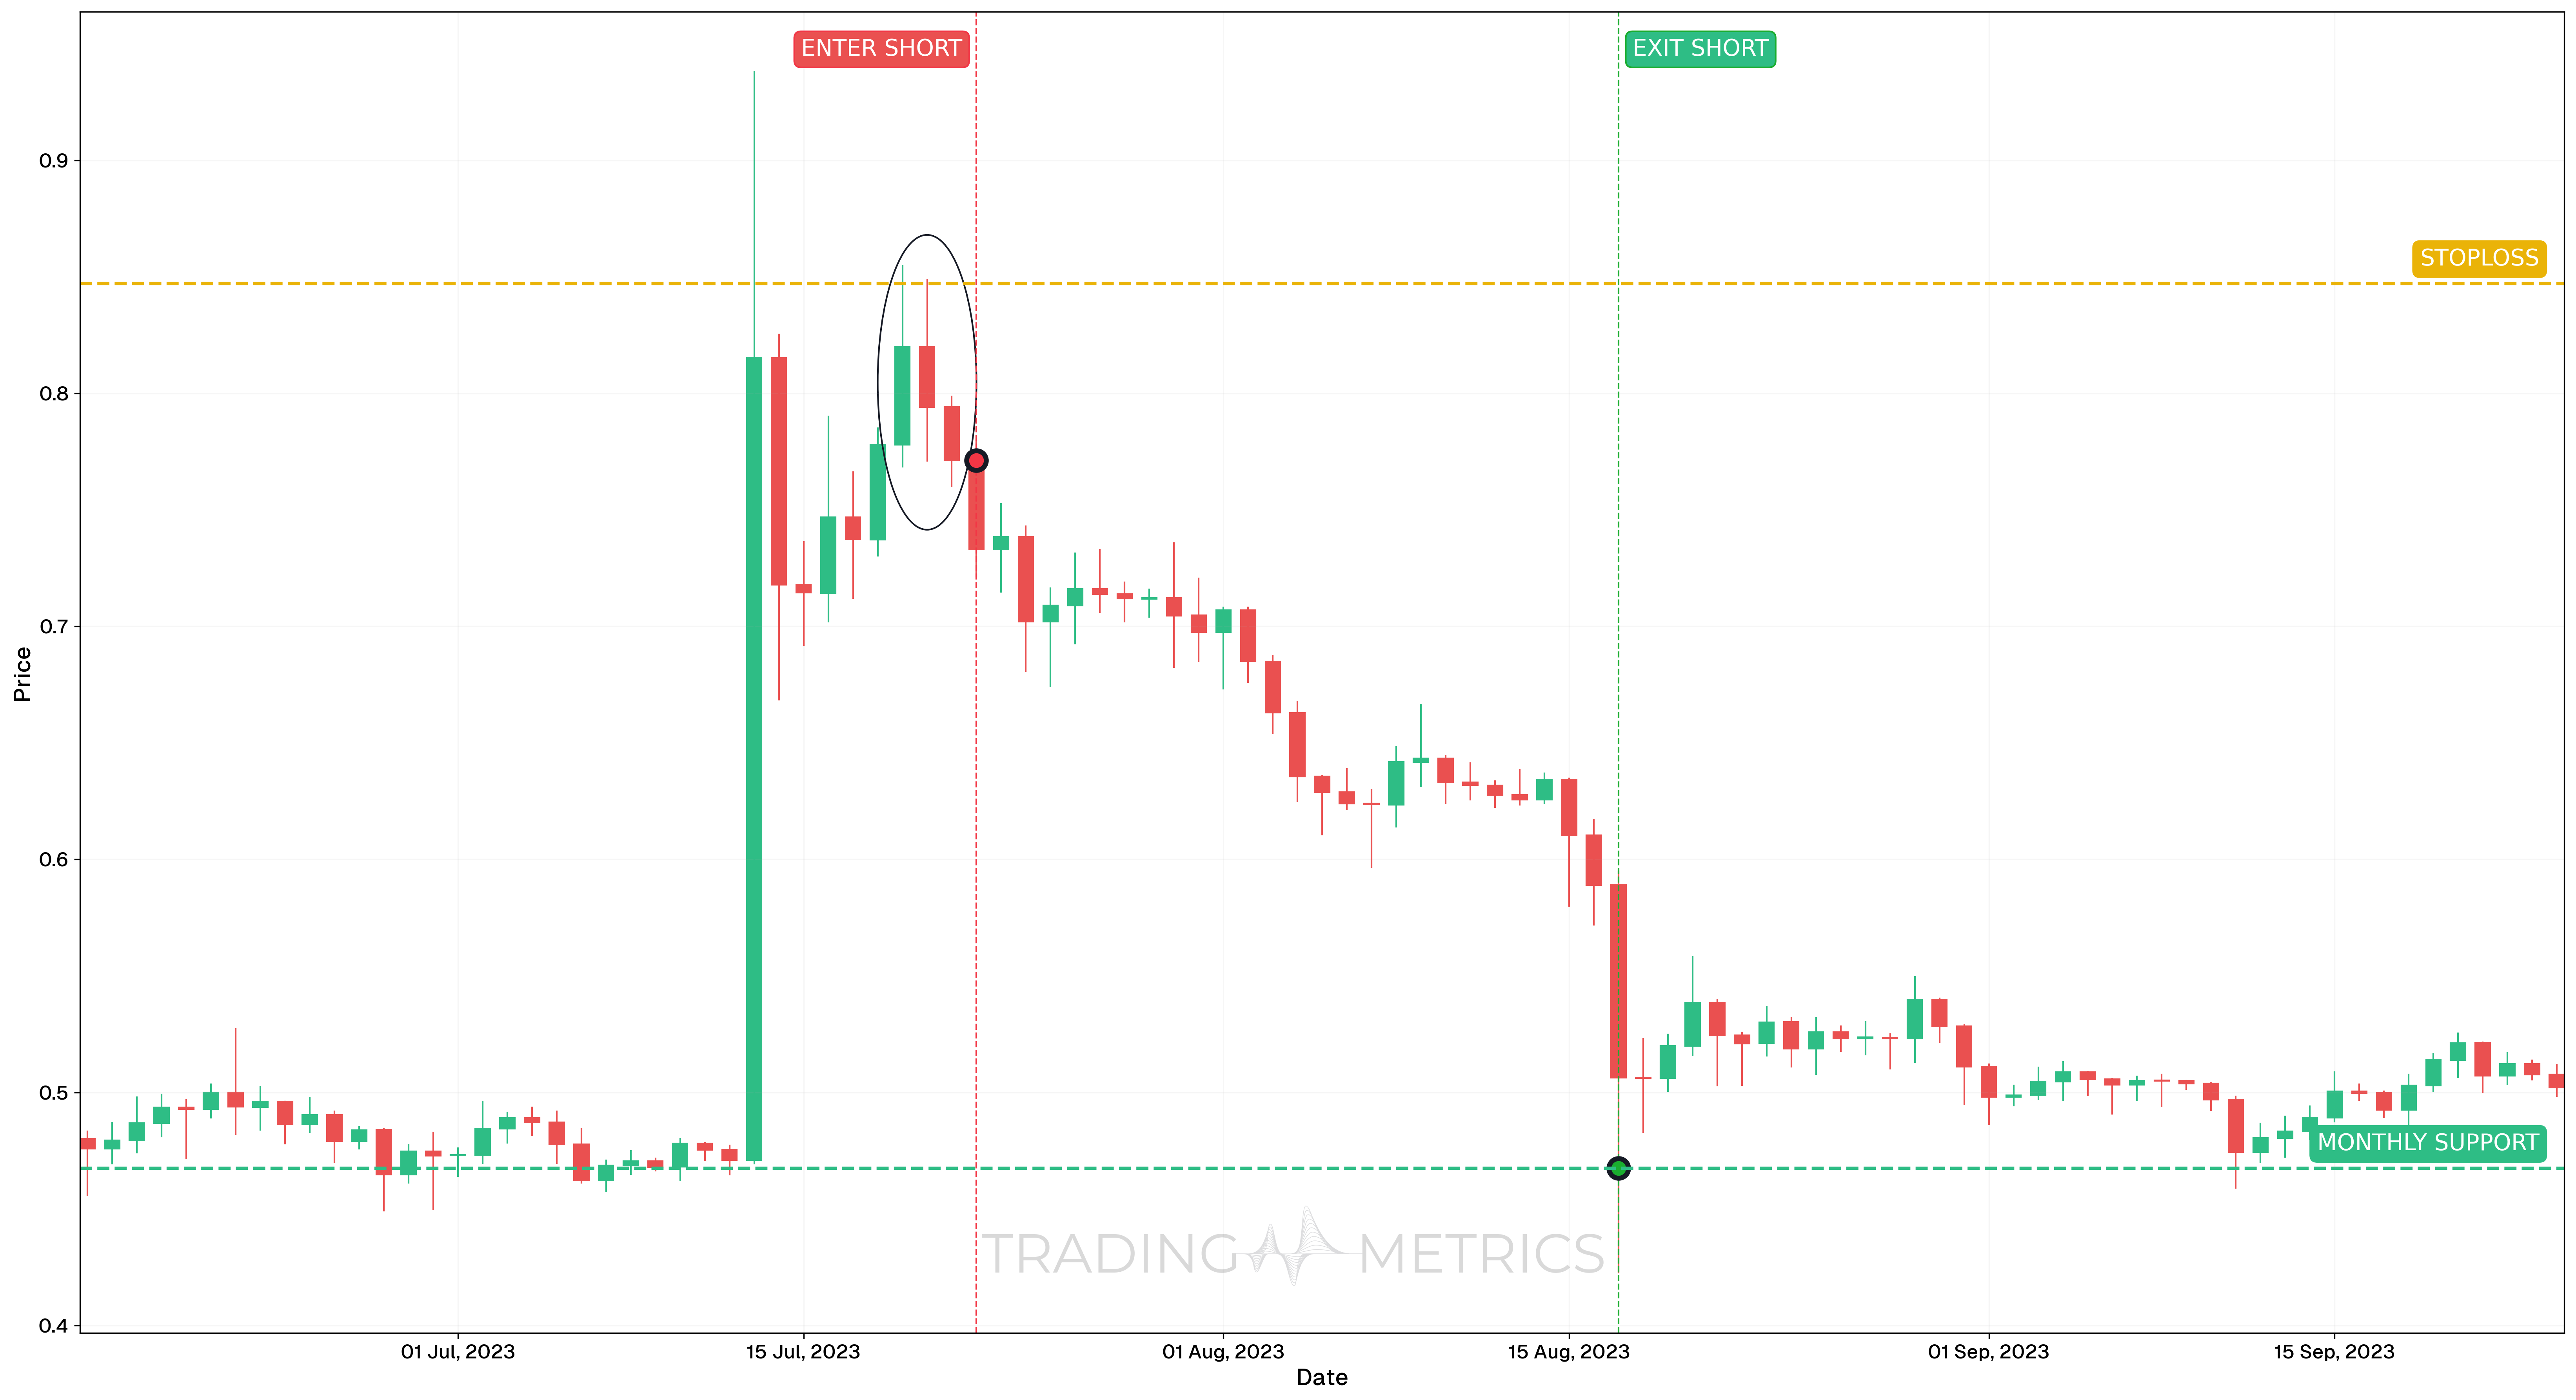
To illustrate how the Three Inside Down pattern can be used to enter a trade, we will choose the XRPUSDT pair. This bearish reversal signal formed on the daily chart, following a period of upside exhaustion and setting up for a downside move.
Analysis
On July 22, 2023, XRPUSDT formed a clean Three Inside Down pattern. This structure started with a large bullish candle, followed by a smaller bearish candle fully contained within the first candle’s body, and then a third strong bearish candle that confirmed the reversal by closing below the first candle’s low. The pattern formed after an extended rally, giving it strong bearish significance.
Trade Setup
-
Entry: The trade was entered on July 22, 2023, at $0.7713, immediately after the third candle confirmed the pattern. Additional confirmation came from:
-
Exit: The trade was exited on August 17, 2023, at $0.4675, near a major previous support/resistance zone, where price had reacted multiple times in the past.
-
Outcome: The Three Inside Down short captured a 39.4% decline, taking advantage of a swift reversal with a clean candlestick pattern and momentum confirmation.
Risk Management
- Stop-Loss placement: The stop-loss was placed at $0.8472, just above the swing high before the pattern, where bullish continuation would invalidate the setup.
- Position sizing: Trade size was determined using a 2% capital risk model, based on the difference between entry and stop.
- Risk-Reward Ratio: The trade delivered a solid Risk-Reward Ratio of 1:4.00, reflecting efficient downside capture with limited risk.
- Volatility Consideration: This breakdown followed increasing Volatility after a tightening range, helping accelerate the move.
- Adaptive Exit Strategy: Traders preferring dynamic management could have used lower high trailing stops or scaled out at support zones using Fibonacci Retracement levels.
Volume Drop: A volume spike on the third candle crushes the pattern into a bearish plunge, sealing the reversal’s force.
Pre-Trade Checklist
Crush the Proof: Pair the pattern with volume surges and indicators like RSI to dodge fakes and boost your odds.
Key Points
- Inside Precision: A long first candle, a contained second candle, and a decisive third candle boost reliability - loose structures weaken the signal.
- Time Frame: Most effective on daily or weekly charts following strong uptrends.
- Combine with Indicators: Use moving averages or RSI to confirm the reversal.
- Breakout Confirmation: A close below the second candle’s low sets the turn - third candle depth is key.
- Price Target: Measure the first candle’s body or use support levels for a target below the close.
- Risk Management: Set a stop-loss above the first candle’s high to limit losses if it fails.
Wait for the Crush: Acting before the third candle confirms risks an inside trap - let the reversal clamp down.
Conclusion
The Three Inside Down pattern is a trader’s calculated tool for catching bearish reversals. Its ambush trio, paired with volume, RSI, and moving averages, can crush into big gains. Whether in crypto, stocks, or forex, this pattern sharpens your edge. Stay precise, manage your risk, and wait for confirmation - a completed setup could turn into a powerful winning trade.
Frequently Asked Questions
Quick answers based on this page's topic.
A Bearish Harami is a two-candle 'warning' signal of a stall. Three Inside Down adds a third bearish candle that closes below the second's low. This extra layer of data provides the 'confirmed exhaustion' needed to turn a subtle warning into a high-conviction trade entry.
The most objective entry is at the close of the third candle. This close confirms that the buyers who were defending the Harami range have finally given up, allowing the price to 'break down' out of the consolidation and begin a new bearish leg.
Traders typically target the nearest major support zone or use the height of the first bullish candle as a measured move target. Because it stems from a Harami, the resulting move is often a steady, structured decline rather than a chaotic crash.