Trading the Breakaway Gap: Master the Start of New Trends
The Breakaway Gap pattern is a powerful continuation signal in technical analysis, appearing when price suddenly leaps away from a prior consolidation or trading range. It represents a decisive shift in supply and demand, with strong momentum carrying price into a fresh trend leg.
-
In a bullish breakaway gap, price gaps upward from the previous close, breaking out of consolidation and signaling strong buying pressure. This often confirms that bullish momentum is surging, offering traders a chance to buy or go long as the uptrend accelerates.
-
In a bearish breakaway gap, price gaps downward from the prior close, breaking lower from consolidation and showing aggressive selling pressure. This confirms that bearish momentum is taking control, offering traders a chance to sell or go short as the downtrend extends.
When a Breakaway Gap forms, it’s a clear sign that momentum has shifted decisively, providing traders with an early entry into strong trend continuation.
How to Identify the Breakaway Gap Pattern in Trading
The Breakaway Gap is a powerful continuation candlestick pattern. It typically appears after a consolidation phase, when price gaps sharply away from the prior range and signals renewed momentum. Depending on direction, the gap may confirm bullish continuation (uptrend) or bearish continuation (downtrend).
Here’s how to spot and trade it:
Start with the Big Picture
This pattern shows up after a trend pauses in consolidation.
- Bullish Case: Appears during an uptrend, marking the end of consolidation and the return of strong buying pressure.
- Bearish Case: Appears during a downtrend, ending a pause and confirming renewed selling pressure.
Trace the Price Movement
The setup unfolds in two phases:
- Pre-Gap Phase: Price consolidates within a structure such as a triangle, rectangle, or flag, showing hesitation and tightening range.
- Gap: Price opens significantly beyond the consolidation zone.
- Bullish: Gaps above prior highs, signaling aggressive demand.
- Bearish: Gaps below prior lows, signaling aggressive supply.
Zero in on the Confirmation Level
The confirmation level is the extreme of the pre-gap consolidation.
- Bullish: Clearing the prior high with a gap validates continuation upward, and the gap zone often becomes new support.
- Bearish: Breaking the prior low with a gap validates continuation downward, and the gap zone often becomes new resistance.
Watch the Breakout
The trigger comes when price holds beyond the gap zone and continues in the trend’s direction.
- Bullish: Holding above the gap with follow-through candles confirms upside continuation and provides an entry point.
- Bearish: Holding below the gap with follow-through candles confirms downside continuation and signals entry short.
Check Volume for Additional Confirmation
Volume behavior strengthens the setup:
- Bullish: Volume often declines during consolidation, then spikes higher during the gap session, confirming strong buying momentum.
- Bearish: Volume often dries up before the break, then surges lower during the gap session, confirming strong selling momentum.
Gap Projection: Measure the height of the consolidation range before the gap forms and project it upward from the gap’s high for a bullish price target, or downward from the gap’s low for a bearish price target.
How to Trade the Bullish Breakaway Gap Pattern (Trading Example)
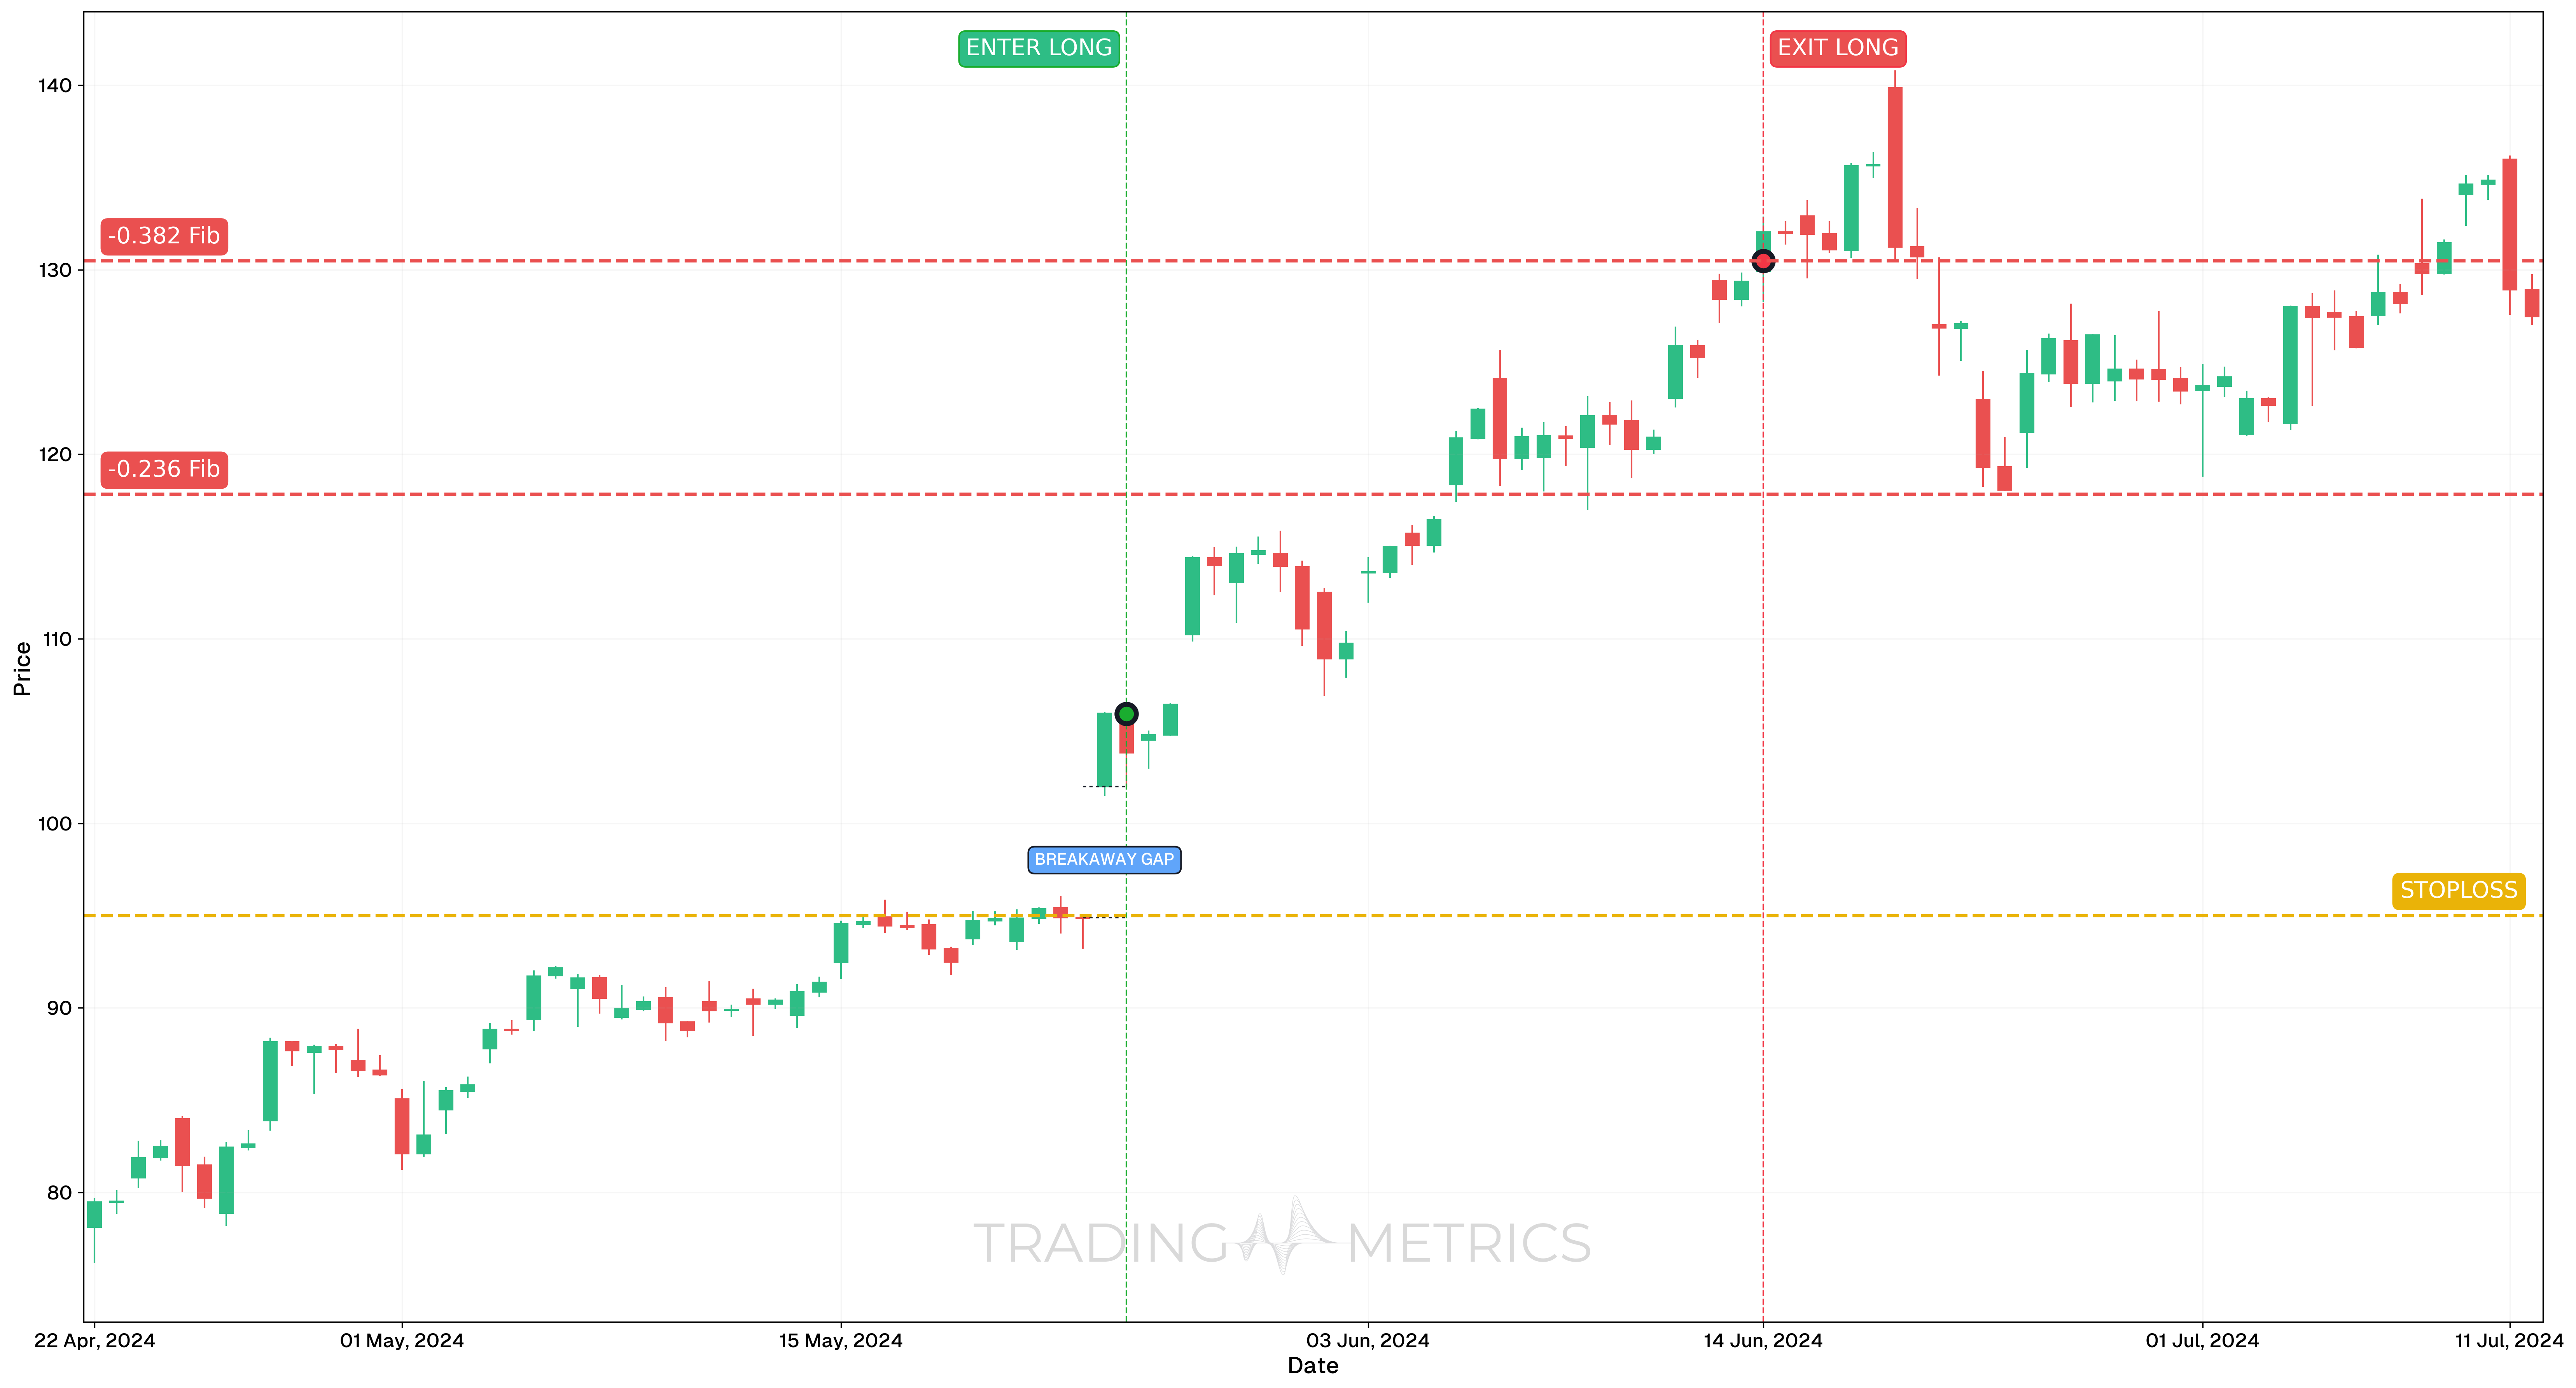
This example features a Breakaway Gap trade on the 4-hour chart, supported by long-term Fibonacci Retracement analysis from the weekly timeframe. The move came after a large trend leg, followed by a price gap and continuation confirmed by technical structure.
Analysis
Using a Fibonacci Retracement drawn from the October 10, 2022 low at $10.81 to the March 4, 2024 high at $97.40, the price created a strong Breakaway Gap during a continuation phase.
The setup was confirmed as the gap did not fill, which suggested strong bullish momentum. The entry opportunity aligned with a clean bullish structure and favorable momentum indicators.
Trade Setup
-
Entry: Entered long on May 23, 2024, at 19:30, at $105.95, once the breakout held above the gap level and retraced lightly without filling the gap.
- Gap confirmation: Price failed to close the gap during several attempts.
- Momentum confirmation: RSI and StochRSI were both showing strength on lower timeframes.
- The pattern supported a continuation leg toward Fibonacci Negative Mirror Levels.
-
Exit: Position exited in multiple take profits based on Fibonacci Negative Mirror Levels:
- June 5, 2024 (TP1): -0.236 Fib level hit at $117.83.
- June 14, 2024 (TP2): -0.382 Fib level hit at $130.48.
-
Outcome: The Breakaway Gap signaled strong continuation momentum. Both profit targets were hit cleanly using Fibonacci-based exits, showing the effectiveness of this structured approach.
Risk Management
- Stop-Loss Placement: Stop-Loss was placed at $95.00, slightly below the breakout zone and unfilled gap area.
- Risk-Reward Ratio:
- TP1: 1:1.08 – Risk per share was $10.95 reward to TP1 was $11.88.
- TP2: 1:2.24 – Same risk, with extended reward to TP2 of $24.53.
- Position Sizing: Trade size was determined using a 2% capital risk model, based on the defined stop-loss distance.
- Volatility Consideration: Volatility expanded as price gapped out of consolidation. Entry was delayed until the gap held structure, minimizing risk of fakeouts.
- Technical Confluence: Entry was supported by multi-timeframe alignment, structure holding above the gap, and Fibonacci-based target planning.
Volume Leap: A volume spike on the gap day propels the pattern into a bullish or bearish surge.
Pre-Trade Checklist
Leap the Proof: Pair the pattern with volume spikes and indicators like RSI to dodge fakes and boost your odds — in both directions.
Key Points
- Gap Size: A significant gap boosts reliability — small gaps dilute it.
- Time Frame: Leaps strongest on daily or weekly charts in both uptrends (bullish) and downtrends (bearish).
- Combine with Indicators: Use moving averages or RSI to confirm the direction.
- Breakout Confirmation: The gap holding without filling sets the surge — watch for sustained momentum.
- Price Target: Measure the consolidation range height, project up (bullish) or down (bearish) from the gap for your target.
- Risk Management: Set a stop-loss just inside the gap zone to limit losses if it fills.
Wait for the Leap: Acting before post-gap momentum risks a gap-fill trap — let it break away first.
Conclusion
The Breakaway Gap pattern is a dynamic tool for catching trend initiations — whether bullish or bearish. Its sudden leap, paired with volume, RSI, and moving averages, can propel strong moves. Whether in crypto, stocks, or forex, this pattern sharpens your edge. Stay alert, manage your risk, and let the gap break — the explosive surge could leap into a winning trade.
Frequently Asked Questions
Quick answers based on this page's topic.
A Breakaway Gap occurs when price decisively 'leaps' over a major support or resistance level after a period of consolidation. It marks the end of a range-bound market and signals the 1:1 birth of a new, powerful trend supported by institutional participation.
A valid breakaway must be accompanied by a massive spike in trading volume. High volume proves that the gap wasn't a fluke, but rather a significant influx of capital that has enough conviction to sustain the trend beyond the initial breakout point.
True Breakaway Gaps are rarely filled immediately. In fact, if the price returns to fill the gap shortly after it forms, it is often a warning sign of a 'fakeout.' In a strong trend, these gaps remain open for a long time, acting as a new floor or ceiling for future price action.