Trading the Downside Tasuki Gap: Bearish Continuation Strategy
The Downside Tasuki Gap is a bearish continuation pattern that forms during a downtrend, signaling persistent selling momentum. It consists of three candles: two bearish candles where the second gaps down from the first, followed by a bullish candle that retraces into but does not fully close the gap. The unfilled gap confirms that sellers remain in control, reinforcing the ongoing downward move. If the bullish candle closes the gap completely, the pattern is invalidated.
How to Identify the Downside Tasuki Gap Pattern in Trading
The Downside Tasuki Gap is a bearish continuation candlestick pattern. It develops during a downtrend, where a failed bullish attempt cannot close the gap, reinforcing ongoing selling pressure. Here’s the step-by-step guide.
Start with the Big Picture
This pattern shows up in a downtrend. Bears remain in control, and the gap acts as a barrier that buyers fail to overcome, signaling continuation.
Trace the Three-Candle Sequence
The pattern unfolds in three parts:
- First Candle: A long bearish candle, driving the downtrend further.
- Second Candle: Another bearish candle, gapping down from the first candle with no overlap.
- Third Candle: A bullish candle that rises into the second candle’s body but does not fill the gap, showing failed recovery.
Zero in on the Confirmation Level
The second candle’s low acts as confirmation, while a subsequent close below strengthens the signal, the third candle’s inability to close the gap already validates continuation.
Watch the Follow-Up
The pattern gains extra confirmation if the next candle closes below the second candle’s low, but the third candle’s failed gap close is already a strong continuation signal.
Check Volume for Additional Confirmation
Volume behavior typically supports the continuation:
- Rises on the first and second bearish candles, confirming selling pressure.
- Dips on the third bullish candle, reflecting weak recovery.
- Increases again on the continuation move, reinforcing the bearish control.
Drop Slash: Measure the gap size or use nearby support levels to project a realistic price target downward from the third candle’s close.
How to Trade the Downside Tasuki Gap Pattern (Trading Example)
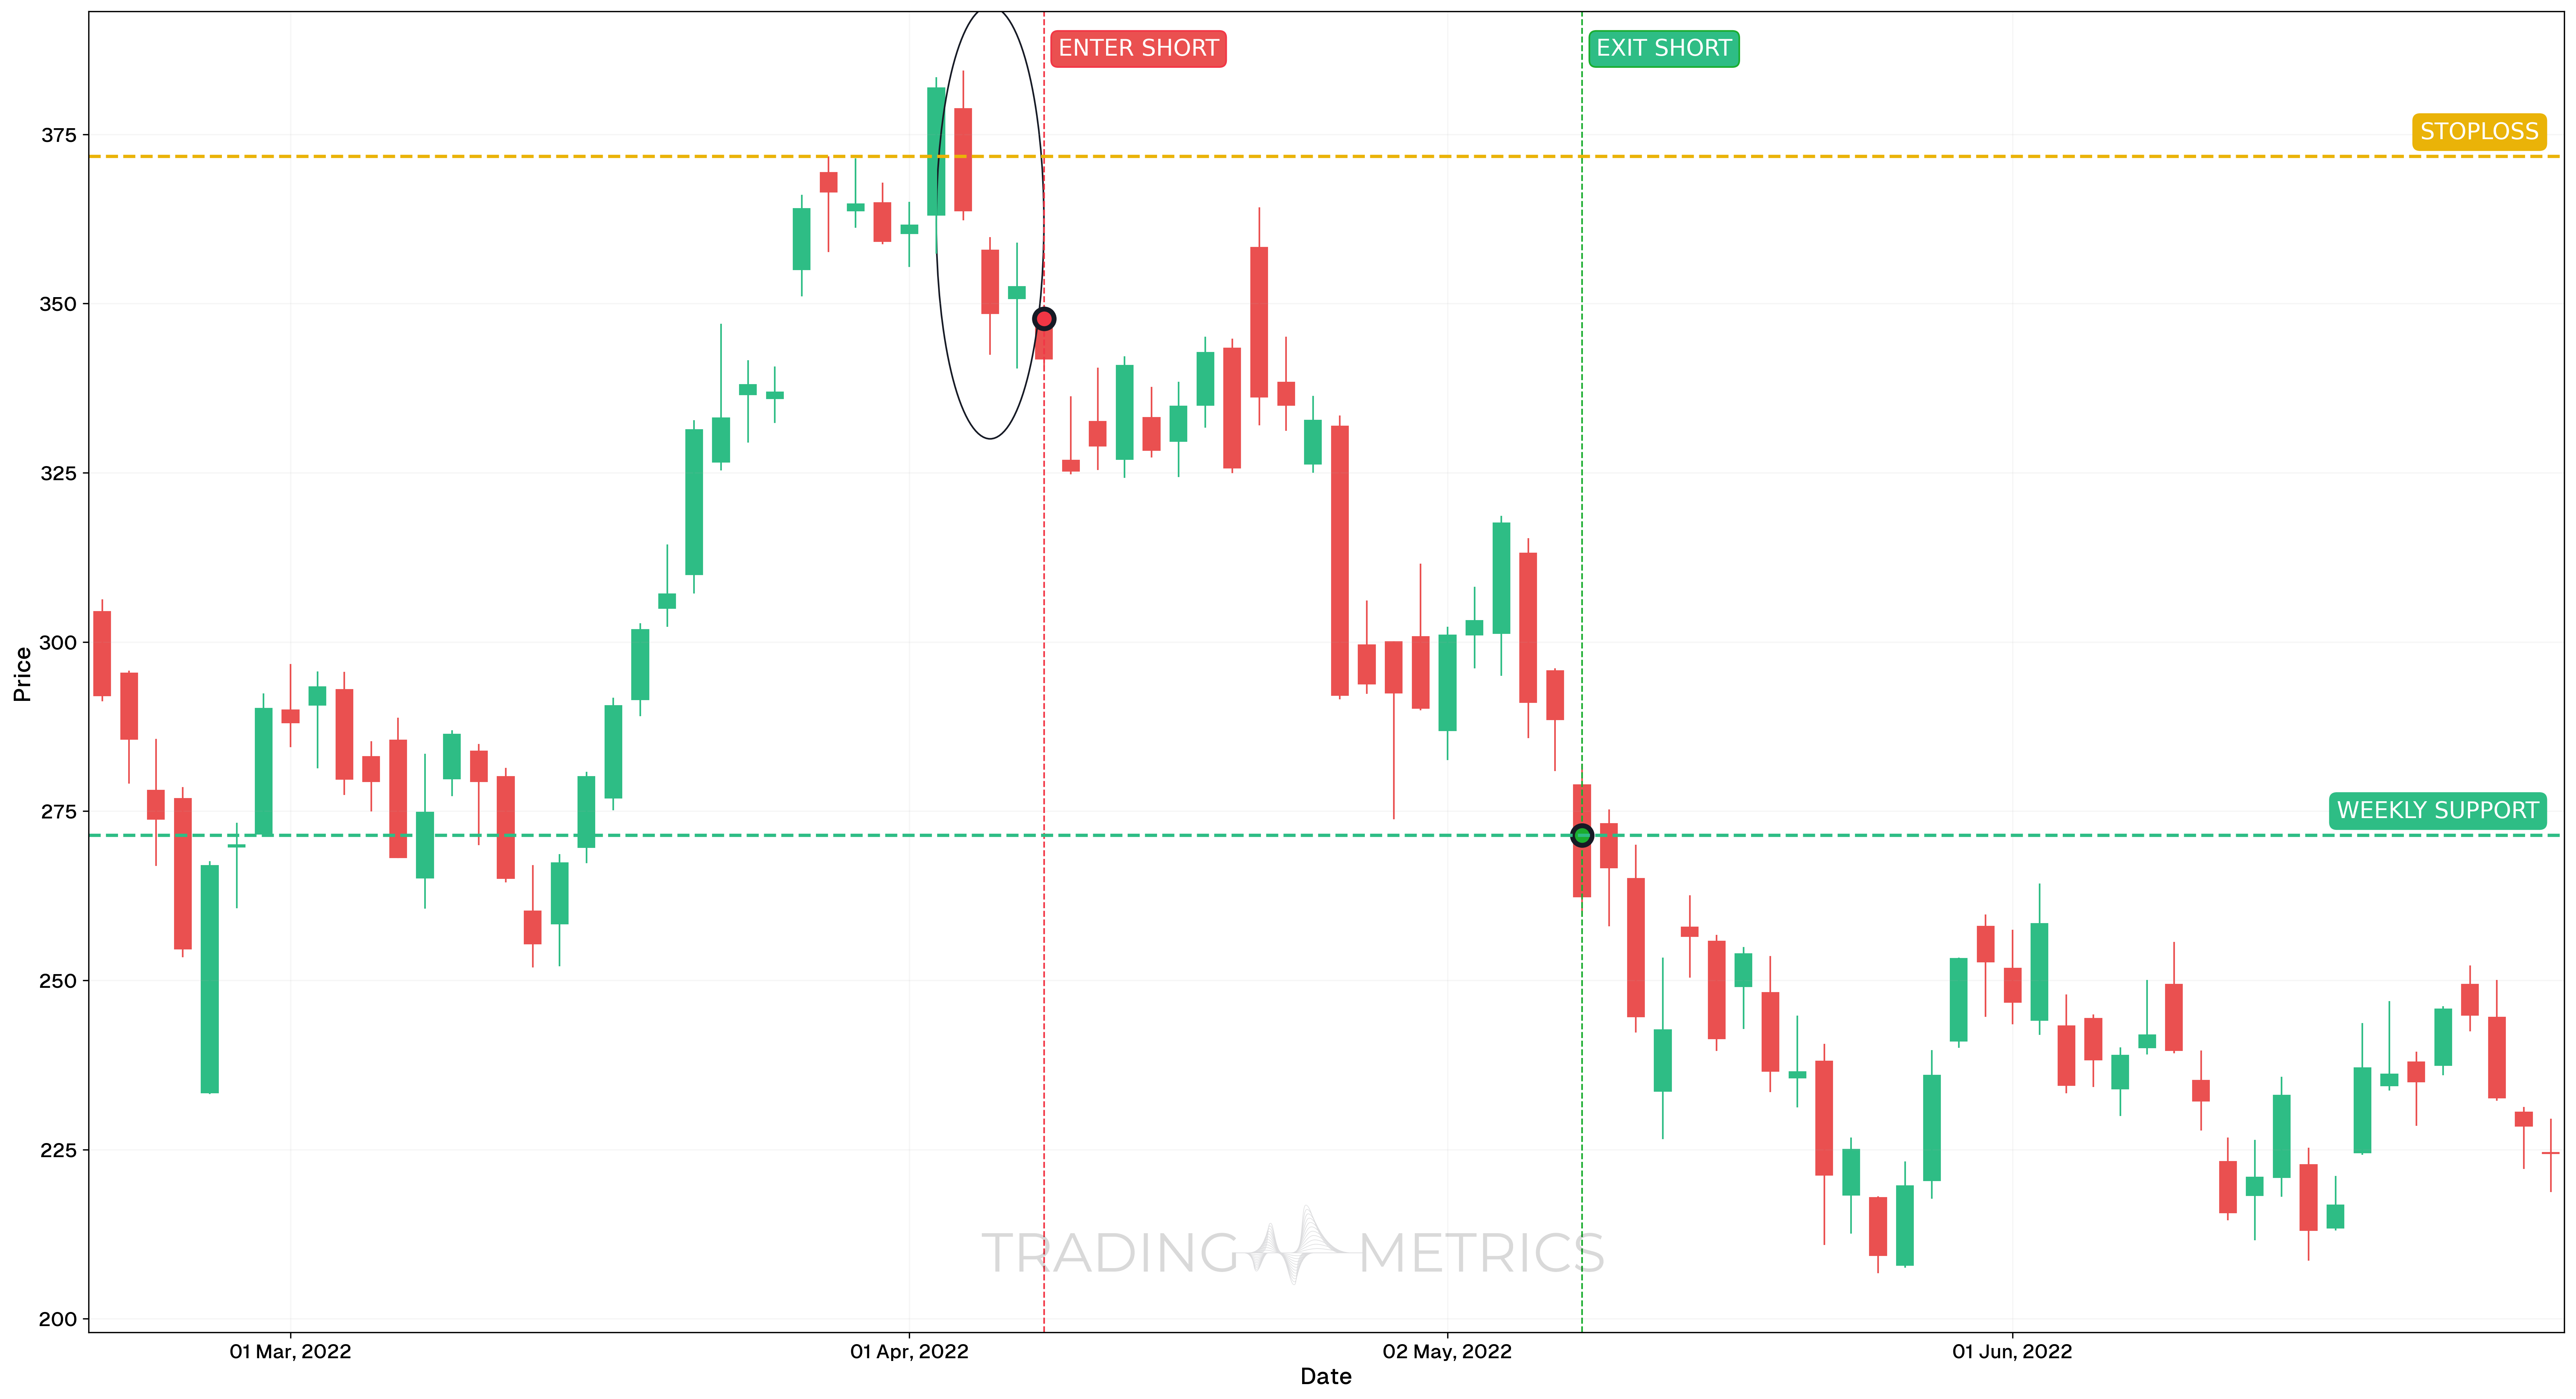
This trade example highlights the Downside Tasuki Gap pattern on TSLA using the daily chart. The pattern served as a strong bearish continuation signal during an ongoing downtrend.
Analysis
On April 8, 2022, TSLA printed a clean Downside Tasuki Gap pattern during a short consolidation inside a bearish trend. The gap and continuation candle confirmed that sellers were still in control. This setup offered a high-conviction continuation opportunity.
Trade Setup
-
Entry: Entered short on April 8, 2022, at $347.74, immediately after the Downside Tasuki Gap formed and bearish momentum resumed. Confluence signals included:
-
Exit: The trade was closed at $271.43 on May 9, 2022, near a major weekly support zone.
-
Outcome: The Downside Tasuki Gap successfully anticipated the next bearish leg, yielding a clean continuation into the next structural support.
Risk Management
- Stop-Loss placement: The stop was placed above the pattern at $371.74, which would invalidate the setup if breached.
- Risk-Reward Ratio: 1:3.18 - a favorable return considering the pattern’s continuation nature and market context.
- Position sizing: Trade sizing followed a 2% capital risk model, aligned with the entry-to-stop distance.
- Volatility Consideration: Volatility began expanding after the gap, signaling renewed momentum that supported the downside thesis.
- Momentum Confirmation: Bearish alignment between RSI and StochRSI added strength to the conviction behind the entry.
Volume Slash: A volume spike on confirmation slashes the pattern into a bearish plunge, locking in the continuation’s force.
Pre-Trade Checklist
Slash the Proof: Pair the pattern with volume surges and indicators like RSI to dodge fakes and boost your odds.
Key Points
- Gap Resistance: A clear gap with a failed bullish close boosts reliability - gap fills dilute it.
- Time Frame: Slashes deepest on daily or weekly charts in downtrends.
- Combine with Indicators: Use moving averages or RSI to confirm the continuation.
- Breakout Confirmation: A close below the second candle’s low or sustained drop sets the plunge - third candle resistance is key.
- Price Target: Measure the gap size or use support levels for a target below the close.
- Risk Management: Set a stop-loss above the third candle’s high to limit losses if it reverses.
Wait for the Slash: Acting before the third candle resists risks a Tasuki trap - let the continuation cut through.
Conclusion
The Downside Tasuki Gap pattern is a trader’s relentless tool for riding bearish continuations. Its gapped resistance, paired with volume, RSI, and moving averages, can slash into big gains. Whether in crypto, stocks, or forex, this pattern sharpens your edge. Stay alert, manage your risk, and let the Tasuki gap hold - that persistent plunge could drop into a winning trade.
Frequently Asked Questions
Quick answers based on this page's topic.
The Downside Tasuki Gap is a bearish continuation pattern signaling that a downtrend is maintaining its momentum. It features a temporary 'failed counter-offensive' where buyers attempt to fill a previous gap but fail to close above the first candle's low, proving that sellers remain in complete control.
The key identifier is the gap integrity. In a valid Downside Tasuki Gap, the third bullish candle must not close the gap entirely. If the price closes above the first bearish candle's low, the bearish continuation is invalidated, suggesting the trend may be shifting toward a bullish reversal.
The most objective entry occurs at the close of the third (bullish) candle, provided the gap remains partially open. This confirms that the buyers' attempt to reverse the trend has failed, allowing traders to enter short in anticipation of the next impulsive leg down.