Pivot Points: How Day Traders Define Daily Reversal Zones
Imagine you’re hiking through the mountains, and you need landmarks to help navigate your way. In the trading world, pivot points serve a similar purpose. Pivot points are technical analysis indicators used to determine the overall trend of the market across different time frames. They are particularly popular among day traders, as they can predict potential support and resistance levels in the market. Essentially, pivot points help traders identify where the market might turn or continue its trend.
In trading, knowing where the market may pause or reverse is power. Pivot points give you that edge.
- Anonymous
How to Use Pivot Points?
Here’s a guide on how to use pivot points effectively in trading:
Identify the Pivot Point Levels
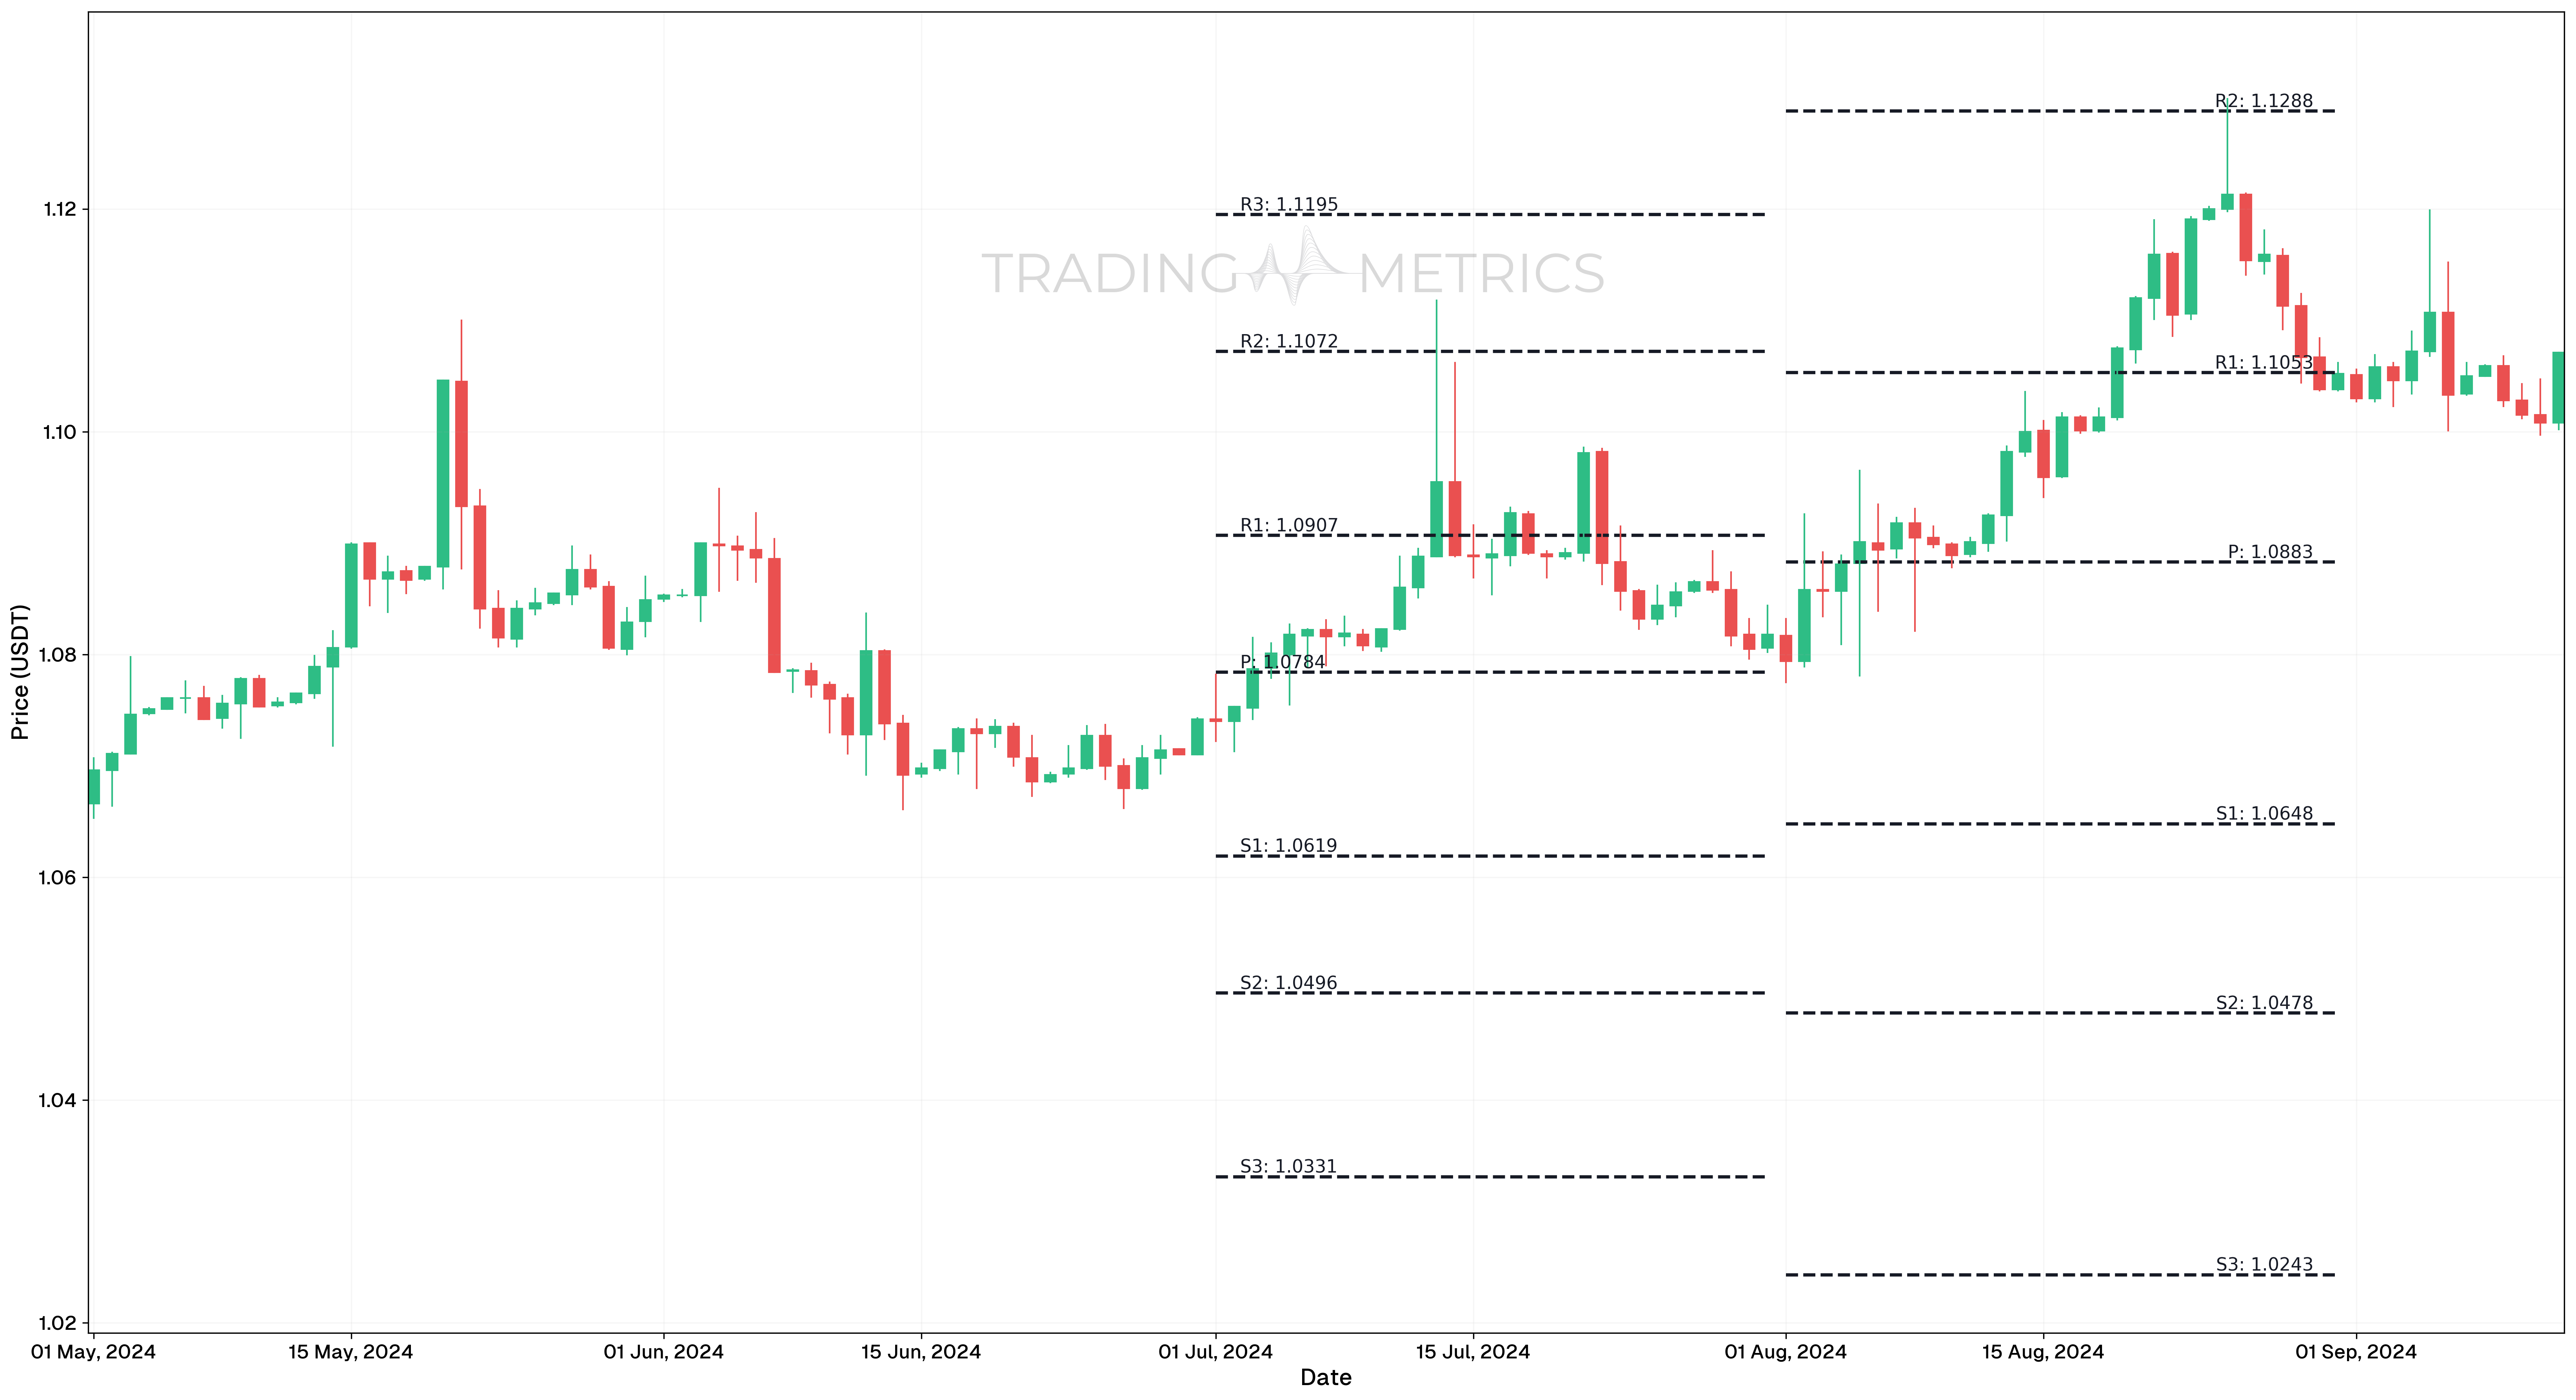
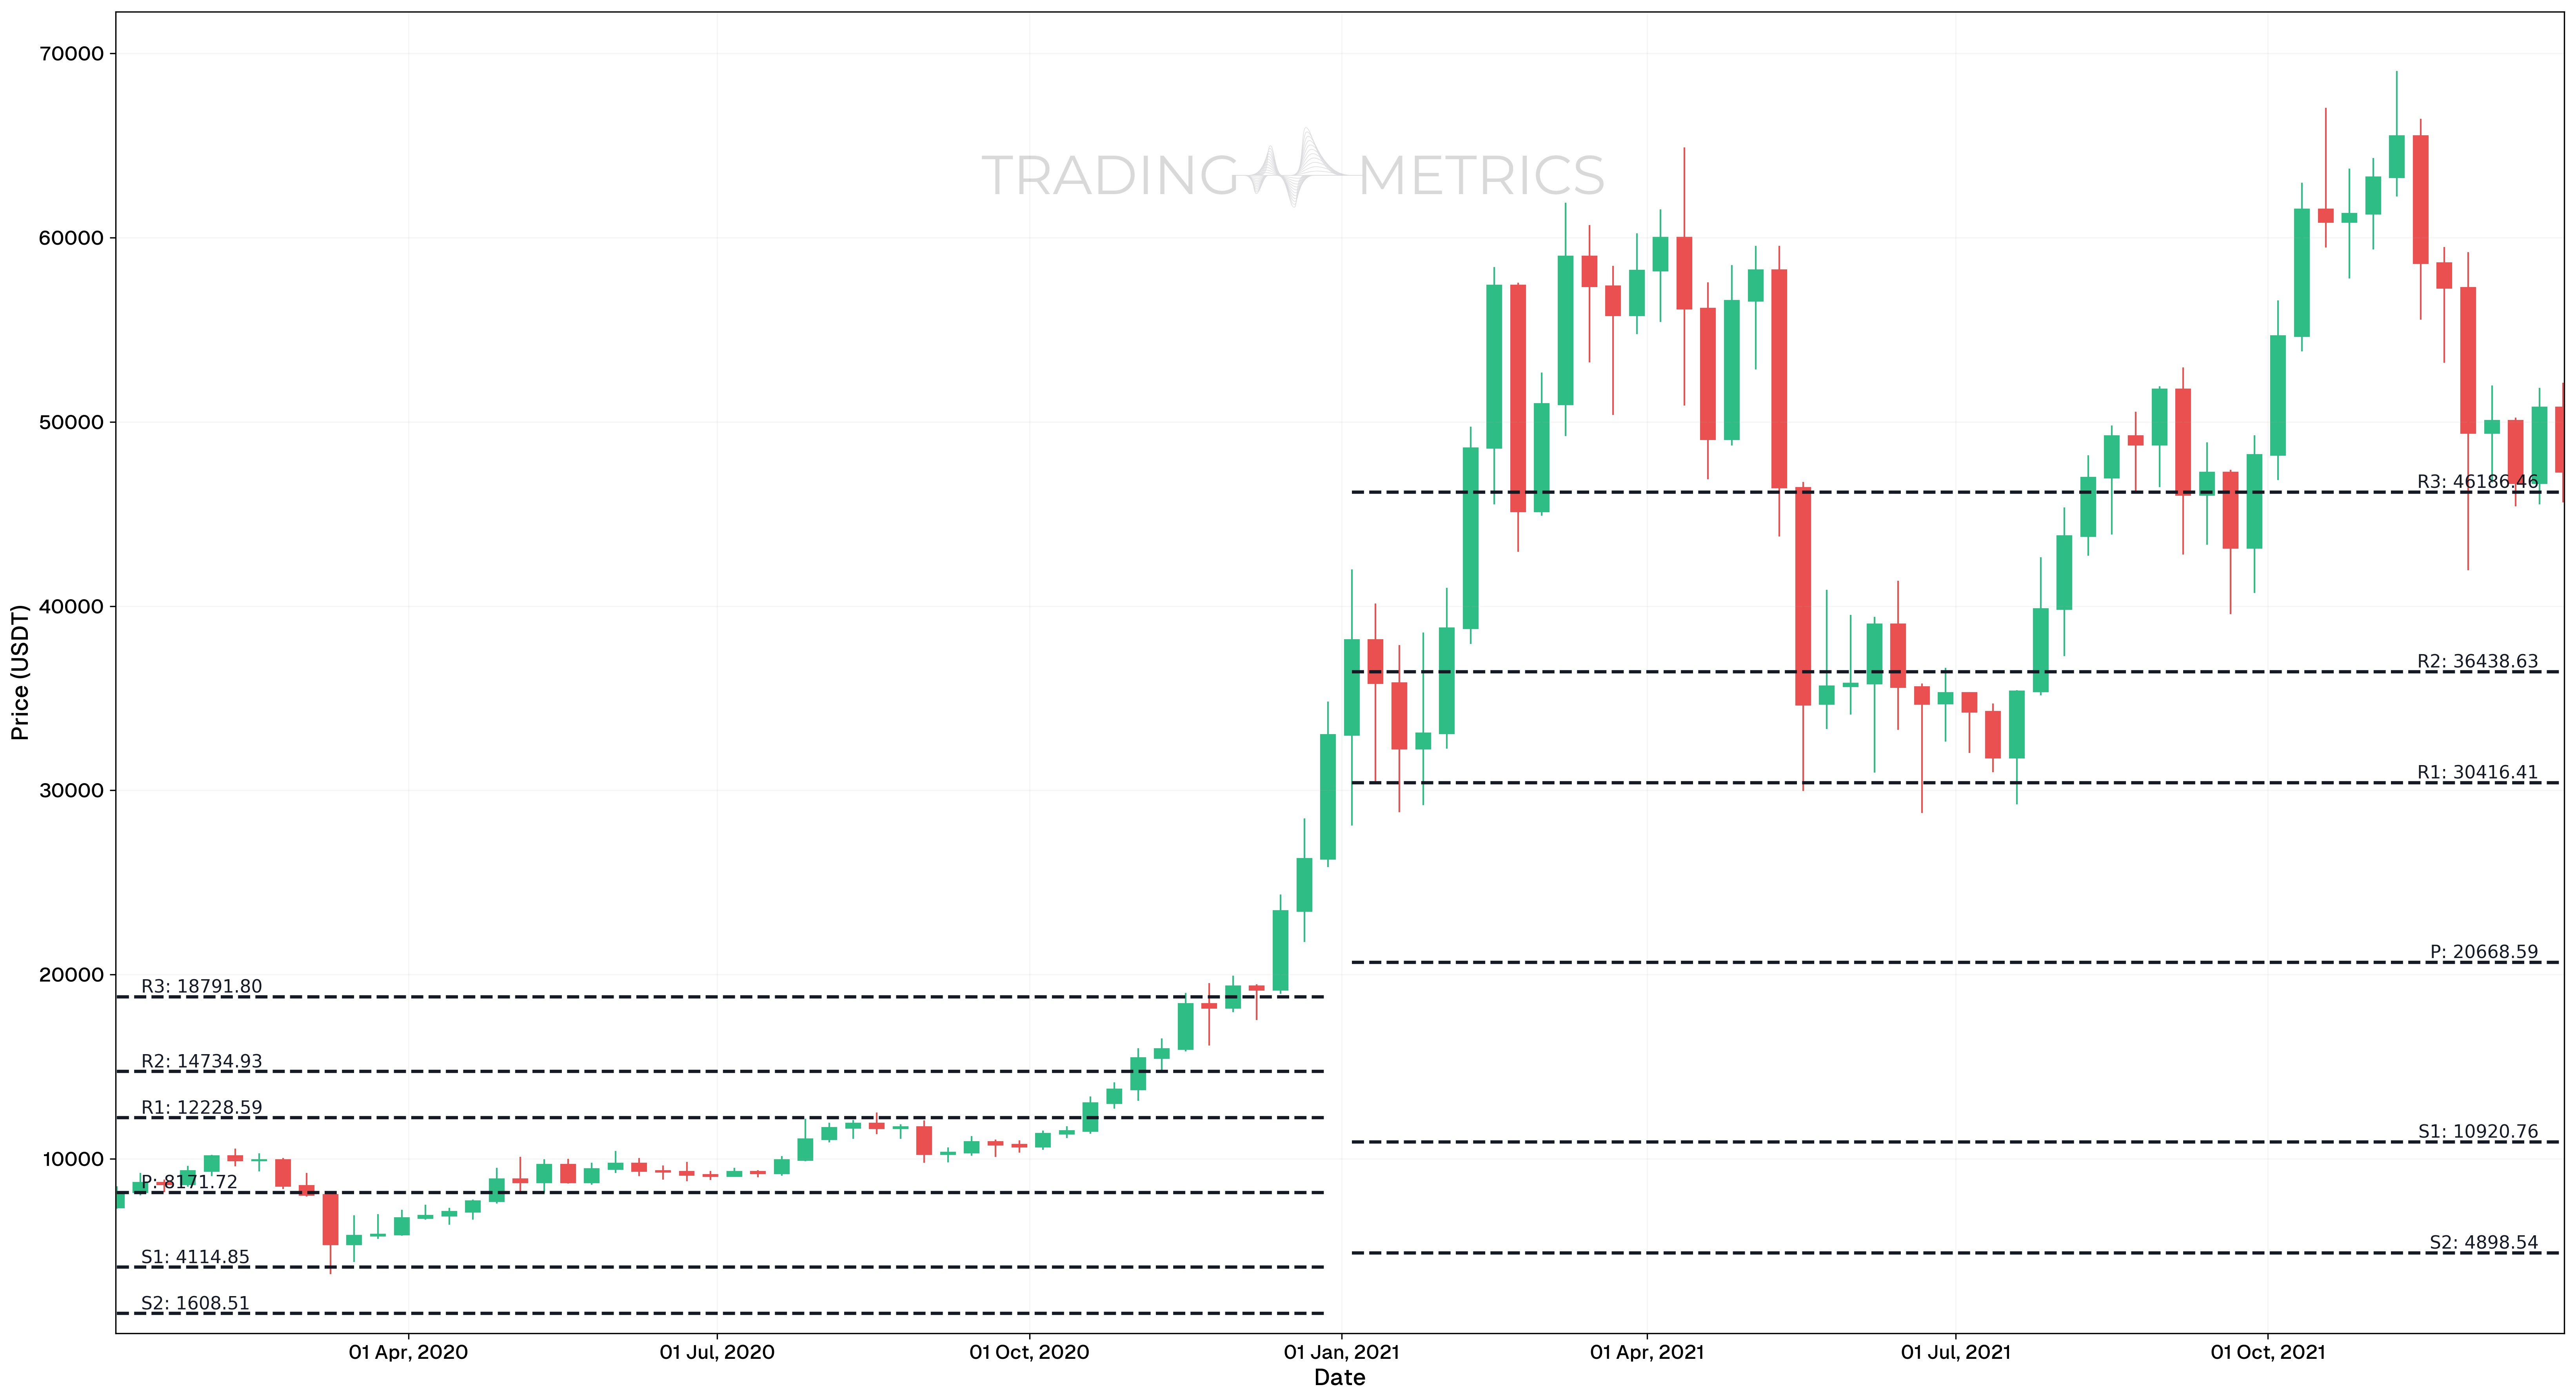
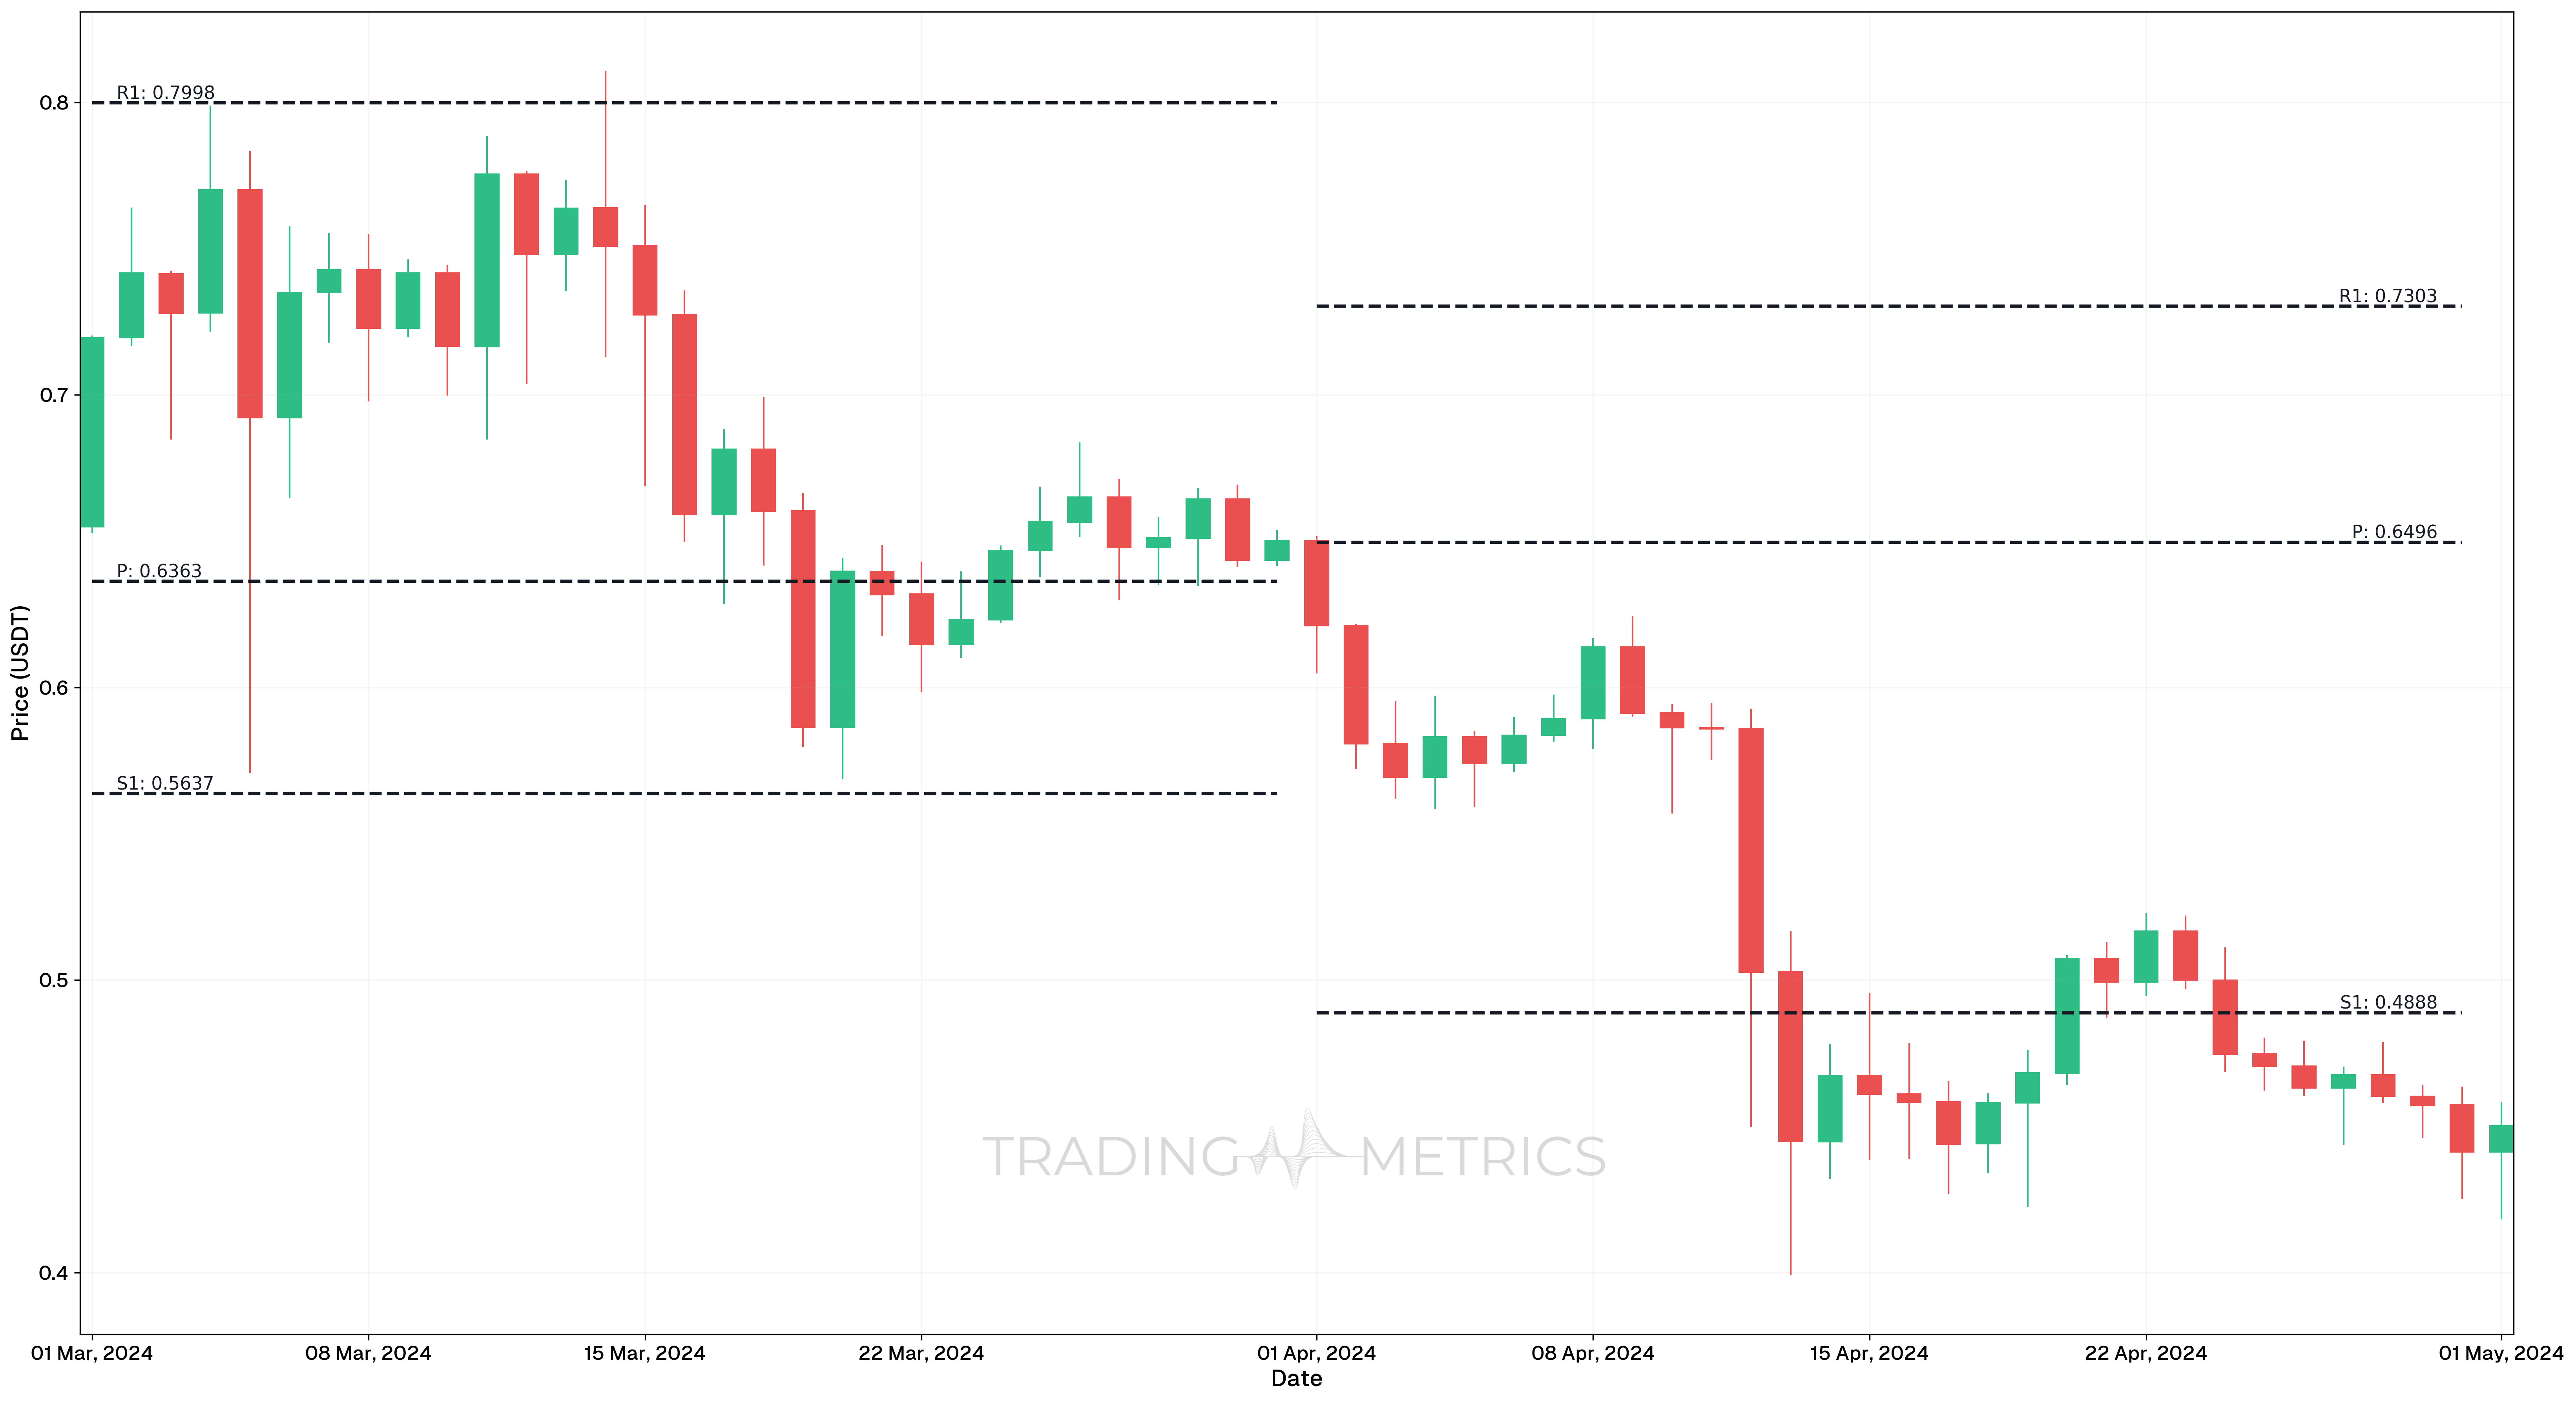
Before using pivot points in your strategy, you need to calculate them (or use a charting platform that automatically plots them). Pivot points provide the main pivot level (P), which is the equilibrium point, along with support (S1, S2, S3) and resistance (R1, R2, R3) levels.
Understand the Market Context
- Bullish Bias: If the price is above the main pivot point (P), it generally signals a bullish sentiment.
- Bearish Bias: If the price is below the pivot point, the market is often considered bearish.
Use for Entry and Exit Points
Entry Strategy
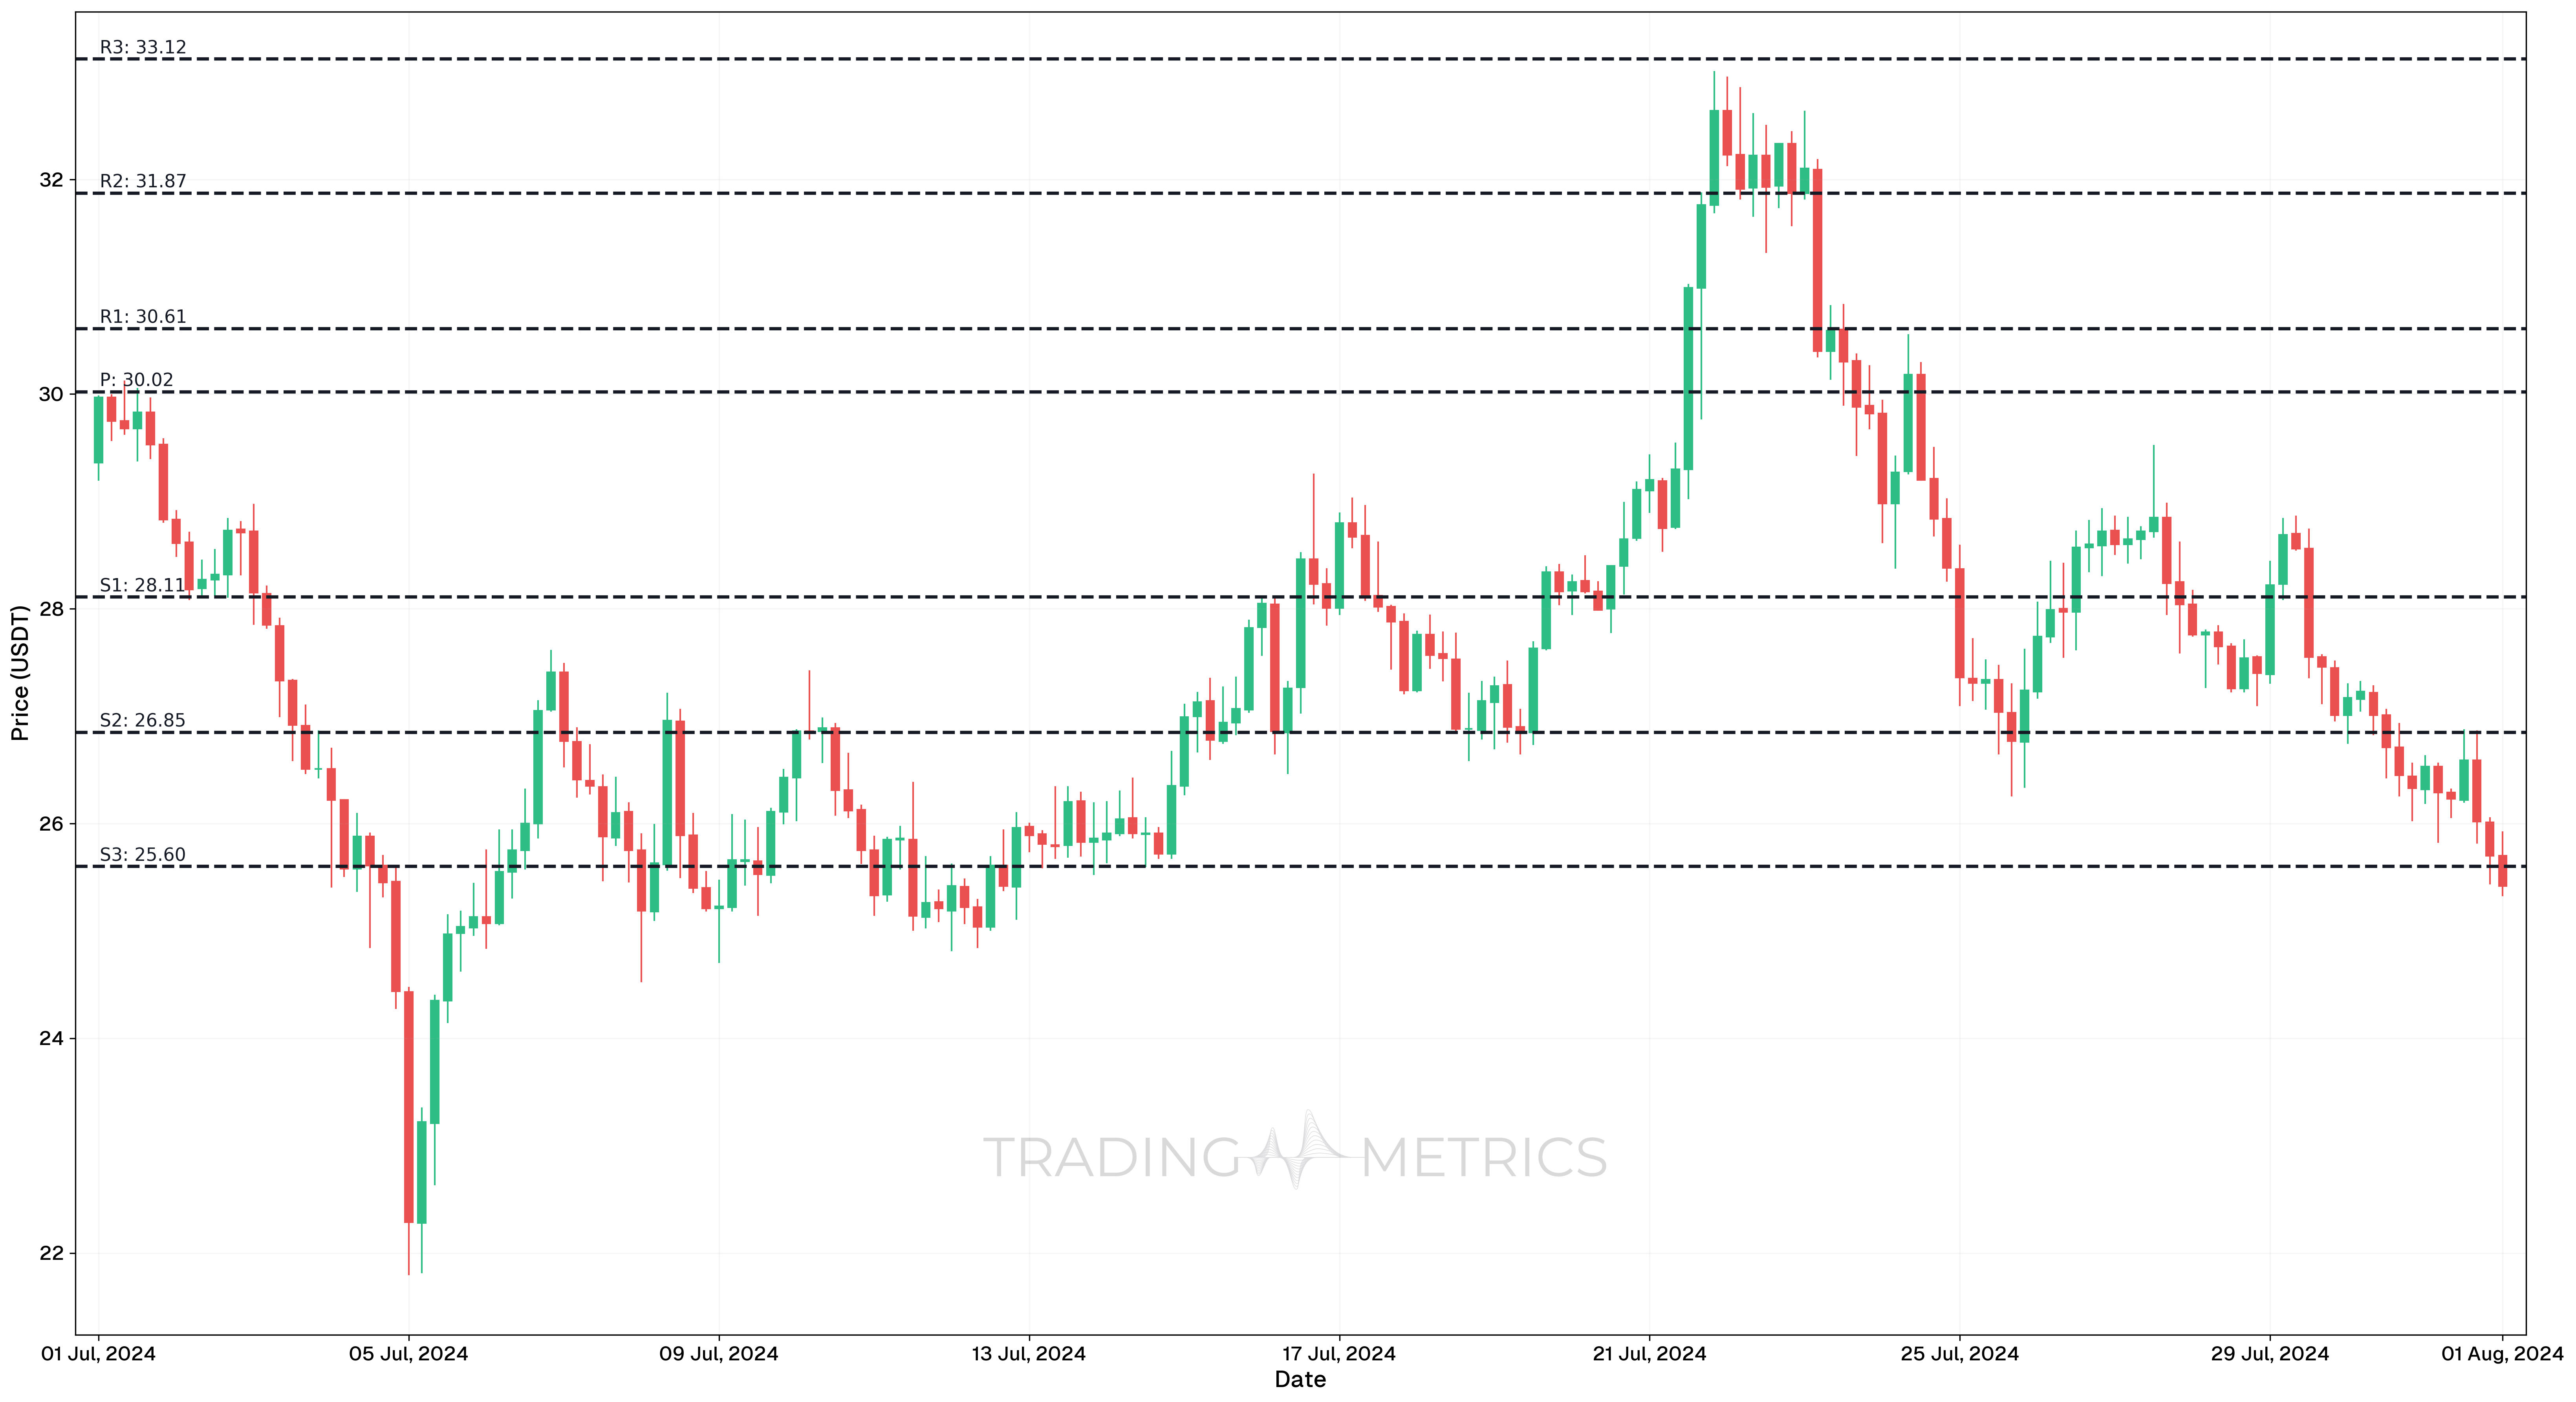
- Buying at Support: If the price reaches a support level (S1, S2, or S3) and starts to reverse, it can be a signal to go long (buy).
- Selling at Resistance: If the price hits a resistance level (R1, R2, or R3) and shows signs of reversal, it might be a good time to go short (sell).
Exit Strategy
- Take Profit at Resistance: When going long, consider setting your take-profit target at the next resistance level (e.g., if you buy at S1, aim to take profit near R1).
- Take Profit at Support: When going short, aim to take profit at the next support level (e.g., if you sell at R1, aim to take profit near S1).
Breakout Trades
Pivot points can also help you identify breakouts:
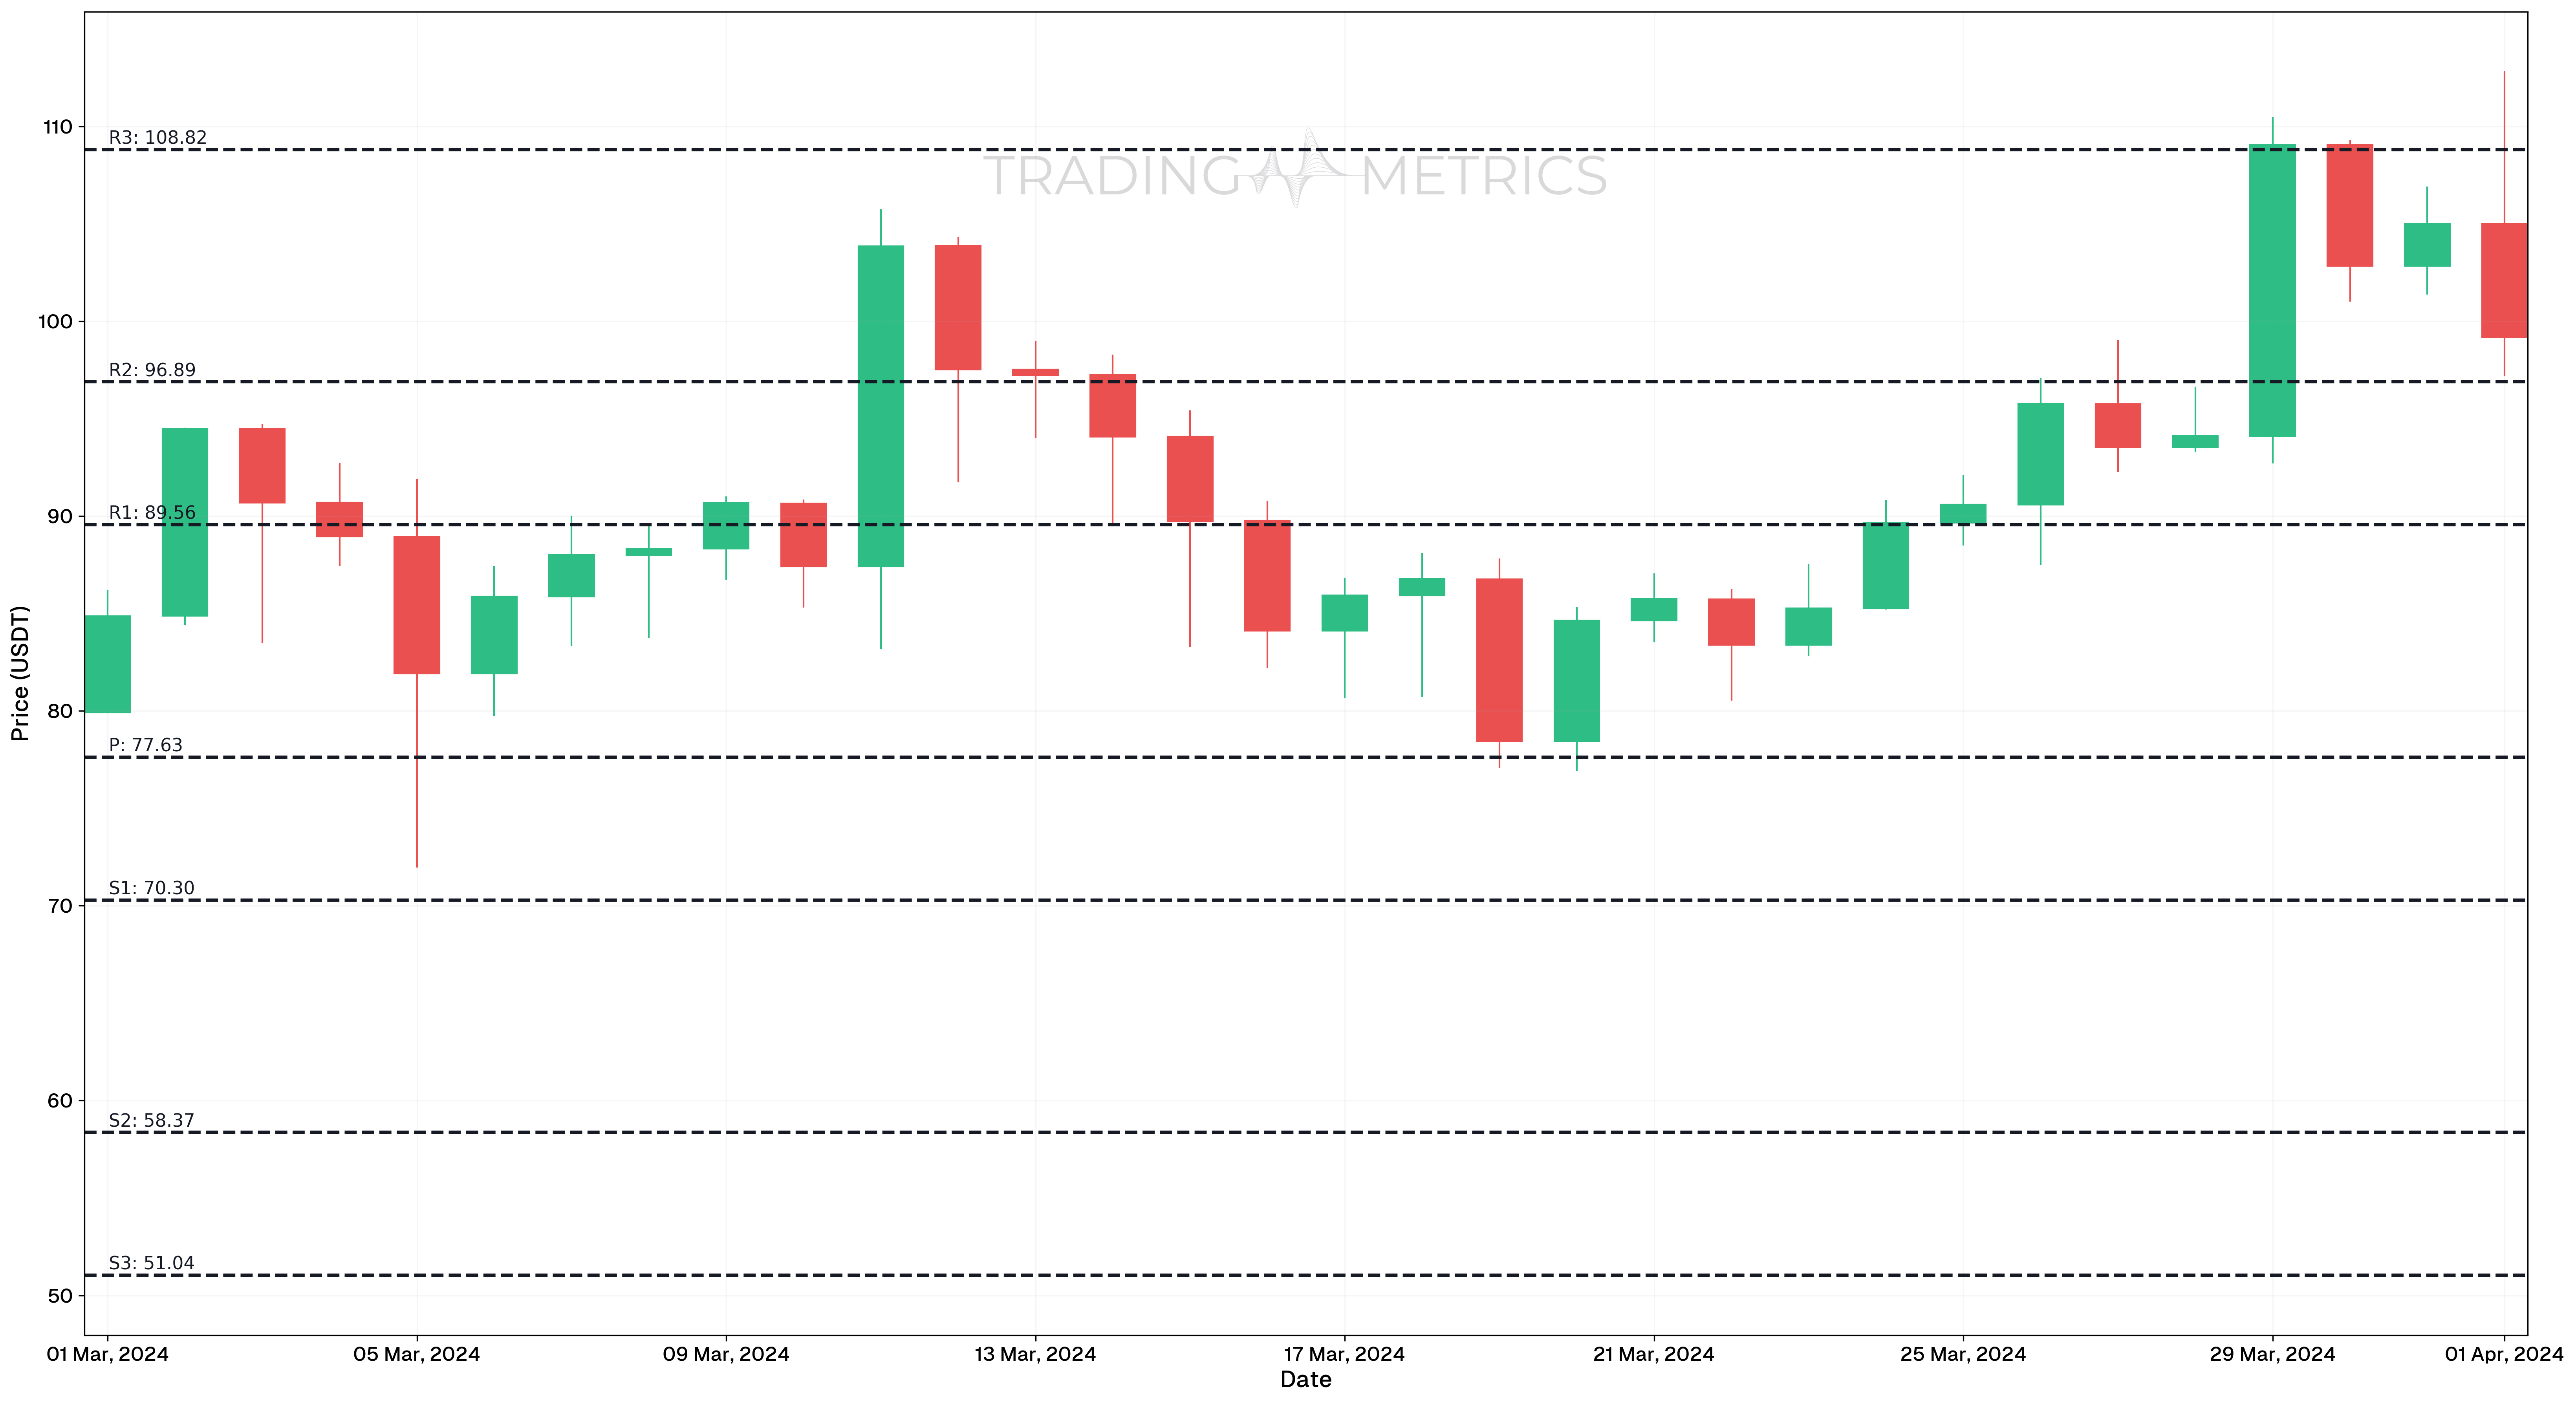
- Bullish Breakout: If the price breaks above a resistance level (e.g., R1) and continues upward with volume, it could indicate a bullish breakout. In this case, traders might enter long positions with a stop below the breakout level.
- Bearish Breakout: If the price breaks below a support level (e.g., S1), it might signal a bearish breakout. Traders could enter short positions with a stop above the breakout level.
Time Frame Considerations
-
Intraday Traders: Pivot points are widely used in intraday trading to determine short-term price movements and reversals. For example, a trader could use daily pivot points for scalping or day trading.
-
Swing Traders: Pivot points can also be used for longer time frames (e.g., weekly or monthly pivots) to identify key levels of support and resistance for swing trades.
Risk Management
-
Stop-loss Placement: Place your stop-loss order just below the support level (for long trades) or just above the resistance level (for short trades) to protect against false breakouts.
-
Position sizing: Make sure to size your position based on the distance between your entry point and stop-loss level to maintain appropriate risk-to-reward ratios.
Use Multiple Time Frames: Check pivot points on daily, weekly, and monthly charts for stronger signals.
The Importance of Pivot Points in Trading
Pivot points are important because they provide objective, calculated levels that help traders identify key areas of market interest, such as potential support and resistance zones. These levels offer insights into market sentiment and potential price reversals, enabling traders to make more informed decisions. By using pivot points, traders can enhance their strategy with a structured approach to entry, exit, and stop-loss placement, improving consistency and risk management.
Be Mindful of News: Major news events can cause significant price movements, potentially invalidating pivot point predictions.
Pivot Point Types
Pivot Point provide traders with distinct methods to calculate and interpret key market levels, helping to adapt strategies to various market conditions. Below, we break down the five main types of pivot points: Standard, Fibonacci, Camarilla, Woodie’s, and DeMark’s to understand their unique applications and benefits.
Standard (Classic) Pivot Points
| Level | Formula |
|---|---|
Pivot Point (P) | |
Resistance 1 (R1) | |
Support 1 (S1) | |
Resistance 2 (R2) | |
Support 2 (S2) | |
Resistance 3 (R3) | |
Support 3 (S3) |
When to use:
- Best for short-term trading in highly liquid markets such as forex or stocks.
- Ideal for day traders who want to quickly determine potential support and resistance levels.
Specific Use:
- Identifying intraday price movements, short-term trends, and reversals.
- Works well in ranging markets where prices oscillate between support and resistance.
Fibonacci Pivot Points
| Level | Formula |
|---|---|
Pivot Point (P) | |
Resistance 1 (R1) | |
Support 1 (S1) | |
Resistance 2 (R2) | |
Support 2 (S2) | |
Resistance 3 (R3) | |
Support 3 (S3) |
When to use:
- Useful when the market follows a clear uptrend or downtrend.
- Can be applied by traders familiar with Fibonacci Retracement levels who want to add another layer of confluence to their analysis.
Specific Use:
- Suitable for forecasting key levels where retracements or pullbacks are likely to occur.
- Often used by swing traders to identify reversal zones in trending markets.
Camarilla Pivot Points
| Level | Formula |
|---|---|
Pivot Point (P) | |
Resistance 1 (R1) | |
Support 1 (S1) | |
Resistance 2 (R2) | |
Support 2 (S2) |
When to use:
- Best suited for markets with strong volatility.
- Popular among day traders focusing on intraday price action.
Specific Use:
- Primarily used for intraday reversals and identifying breakout opportunities.
- Excellent for scalpers who trade based on price action at key intraday levels.
Woodie’s Pivot Points
| Level | Formula |
|---|---|
Pivot Point (P) | |
Resistance 1 (R1) | |
Support 1 (S1) | |
Resistance 2 (R2) | |
Support 2 (S2) |
When to use:
- Ideal for traders who prefer a formula that gives more weight to the closing price.
- Best for short-term traders who look for momentum shifts.
Specific Use:
- Useful for identifying immediate momentum shifts, particularly for short-term trades.
- Often used by momentum traders for confirmation of market direction.
DeMark’s Pivot Points
| Level | Formula |
|---|---|
Pivot Point (P) | Varies based on conditions: |
Resistance (R1) | |
Support (S1) |
When to use:
- Suitable for traders who prefer dynamic calculations that change based on market conditions.
- Often used in fast-moving markets or high volatility environments.
Specific Use:
- Helps capture key price levels in fast-changing or uncertain market conditions.
- Useful for traders who want an adaptive approach to identifying support and resistance levels.
Using Timeframes with Pivot Points
A timeframe represents the length of time during which price movements are observed on a chart. Traders utilize various timeframes to analyze trends, identify support and resistance levels, and develop trade strategies. Below is a table summarizing common timeframes:
| Timeframe | Description | Common Use |
|---|---|---|
1-minute (1m) | Very short-term analysis focusing on rapid price movements. | Scalping trades. |
5-minute (5m) | Short-term insights, slightly broader than the 1-minute timeframe. | Scalpers and day traders. |
15-minute (15m) | Captures short-term trends, providing more stability compared to 1m and 5m. | Short-term trading. |
1-hour (1h) | Offers a view of the daily price action while filtering out noise from smaller timeframes. | Day traders. |
4-hour (4h) | Tracks significant market movements over an extended intra-day period. | Swing traders and day traders. |
Daily (1D) | Displays the bigger picture of market behavior within a single day. | Swing traders and long-term investors. |
Weekly (1W) | Highlights long-term trends across weeks. | Long-term traders and investors. |
Monthly (1M) | Shows macroeconomic trends and major price cycles spanning months. | Long-term investors. |
Selecting the appropriate timeframe and pivot points depends on your trading style:
- Scalpers: Use 1m to 15m charts with daily pivot points to exploit rapid price movements.
- Day Traders: Combine 15m to 1h charts with daily pivot points to track intraday trends.
- Swing Traders: Rely on 4h to 1d charts with weekly pivot points for multi-day trades.
- Position Traders/Investors: Focus on 1d to 1w charts with monthly pivot points for long-term opportunities.
Combining Pivot Points with Other Tools
Pivot points are powerful on their own, but when combined with other tools, their effectiveness can skyrocket. Here are a few combinations:
- Moving Averages: These can help confirm the trend direction indicated by pivot points.
- Relative Strength Index (RSI): This momentum oscillator can indicate overbought or oversold conditions, adding weight to pivot point signals.
- Candlestick Patterns: Identifying patterns near pivot points can give more reliable trade signals.
Stay Disciplined: Set clear entry and exit points and adhere to your trading plan to avoid emotional decisions.
Key Points
- Key Price Levels: Pivot points are calculated support and resistance levels based on the previous period’s high, low, and close, providing key areas for potential price reactions.
- Levels Breakdown:
- Pivot Point (PP): The central level, acting as a potential reversal or consolidation point.
- Support Levels (S1, S2, S3): Below the pivot, indicating potential price floors.
- Resistance Levels (R1, R2, R3): Above the pivot, indicating potential price ceilings.
- Trend Confirmation: Price above the pivot point suggests bullish sentiment while price below the pivot point suggests bearish sentiment.
- Intraday and Short-Term Use: Pivot points are widely used by day and swing traders for intraday or short-term trading strategies.
- Breakout Signals: Breaks above resistance levels or below support levels can signal strong momentum and potential trend continuation.
- Combines with Other Indicators: Use pivot points with momentum indicators or trend indicators like MACD, RSI, or Bollinger Bands to confirm signals.
- Effective in Range-Bound Markets: Pivot points work well in sideways markets, providing clear entry and exit points based on price reversals at support or resistance.
- Customizable Time Frames: Pivot points can be calculated on daily, weekly, or monthly time frames, depending on the trader’s strategy and market.
- Visual Simplicity: Their clear levels make pivot points easy to use, especially for traders seeking straightforward support and resistance zones.
- Backtesting and Adaptation: Test pivot point strategies in historical data to refine their effectiveness and adjust parameters for specific trading styles.
Conclusion
Pivot points are a simple yet powerful tool in a trader’s arsenal. They provide crucial levels to watch for potential reversals and continuations, helping to make informed trading decisions. However, they are not foolproof and should be used in conjunction with other indicators and analysis methods.
Frequently Asked Questions
Quick answers based on this page's topic.
Pivot Points act as a primary barometer for intraday sentiment. When price stays above the main pivot (P), the market is considered bullish, signaling that traders should look for long opportunities toward resistance levels. Conversely, trading below the pivot indicates bearish control and a search for support.
Floor Pivot Points focus on broader support and resistance zones based on the previous day's high, low, and close. Camarilla Pivot Points are more specialized for range-trading and scalping, placing extra emphasis on the L3/H3 levels for reversals and L4/H4 for breakout momentum.
Yes, Pivot Points are excellent tools for defining objective take-profit zones. Traders often exit portions of a trade at R1 or R2 in an uptrend, as these levels represent mathematical areas where selling pressure typically increases, helping to secure gains before a potential retracement.