Risk-Reward Ratio: Why 2:1 Beats a 60% Win Rate
Every trade is a balance of gain versus loss. This relationship is defined by Risk-Reward, one of the most basic principles in trading. Whether you’re swing trading crypto or scalping intraday moves, understanding Risk-Reward helps you filter better setups, manage losses, and target profits rationally.
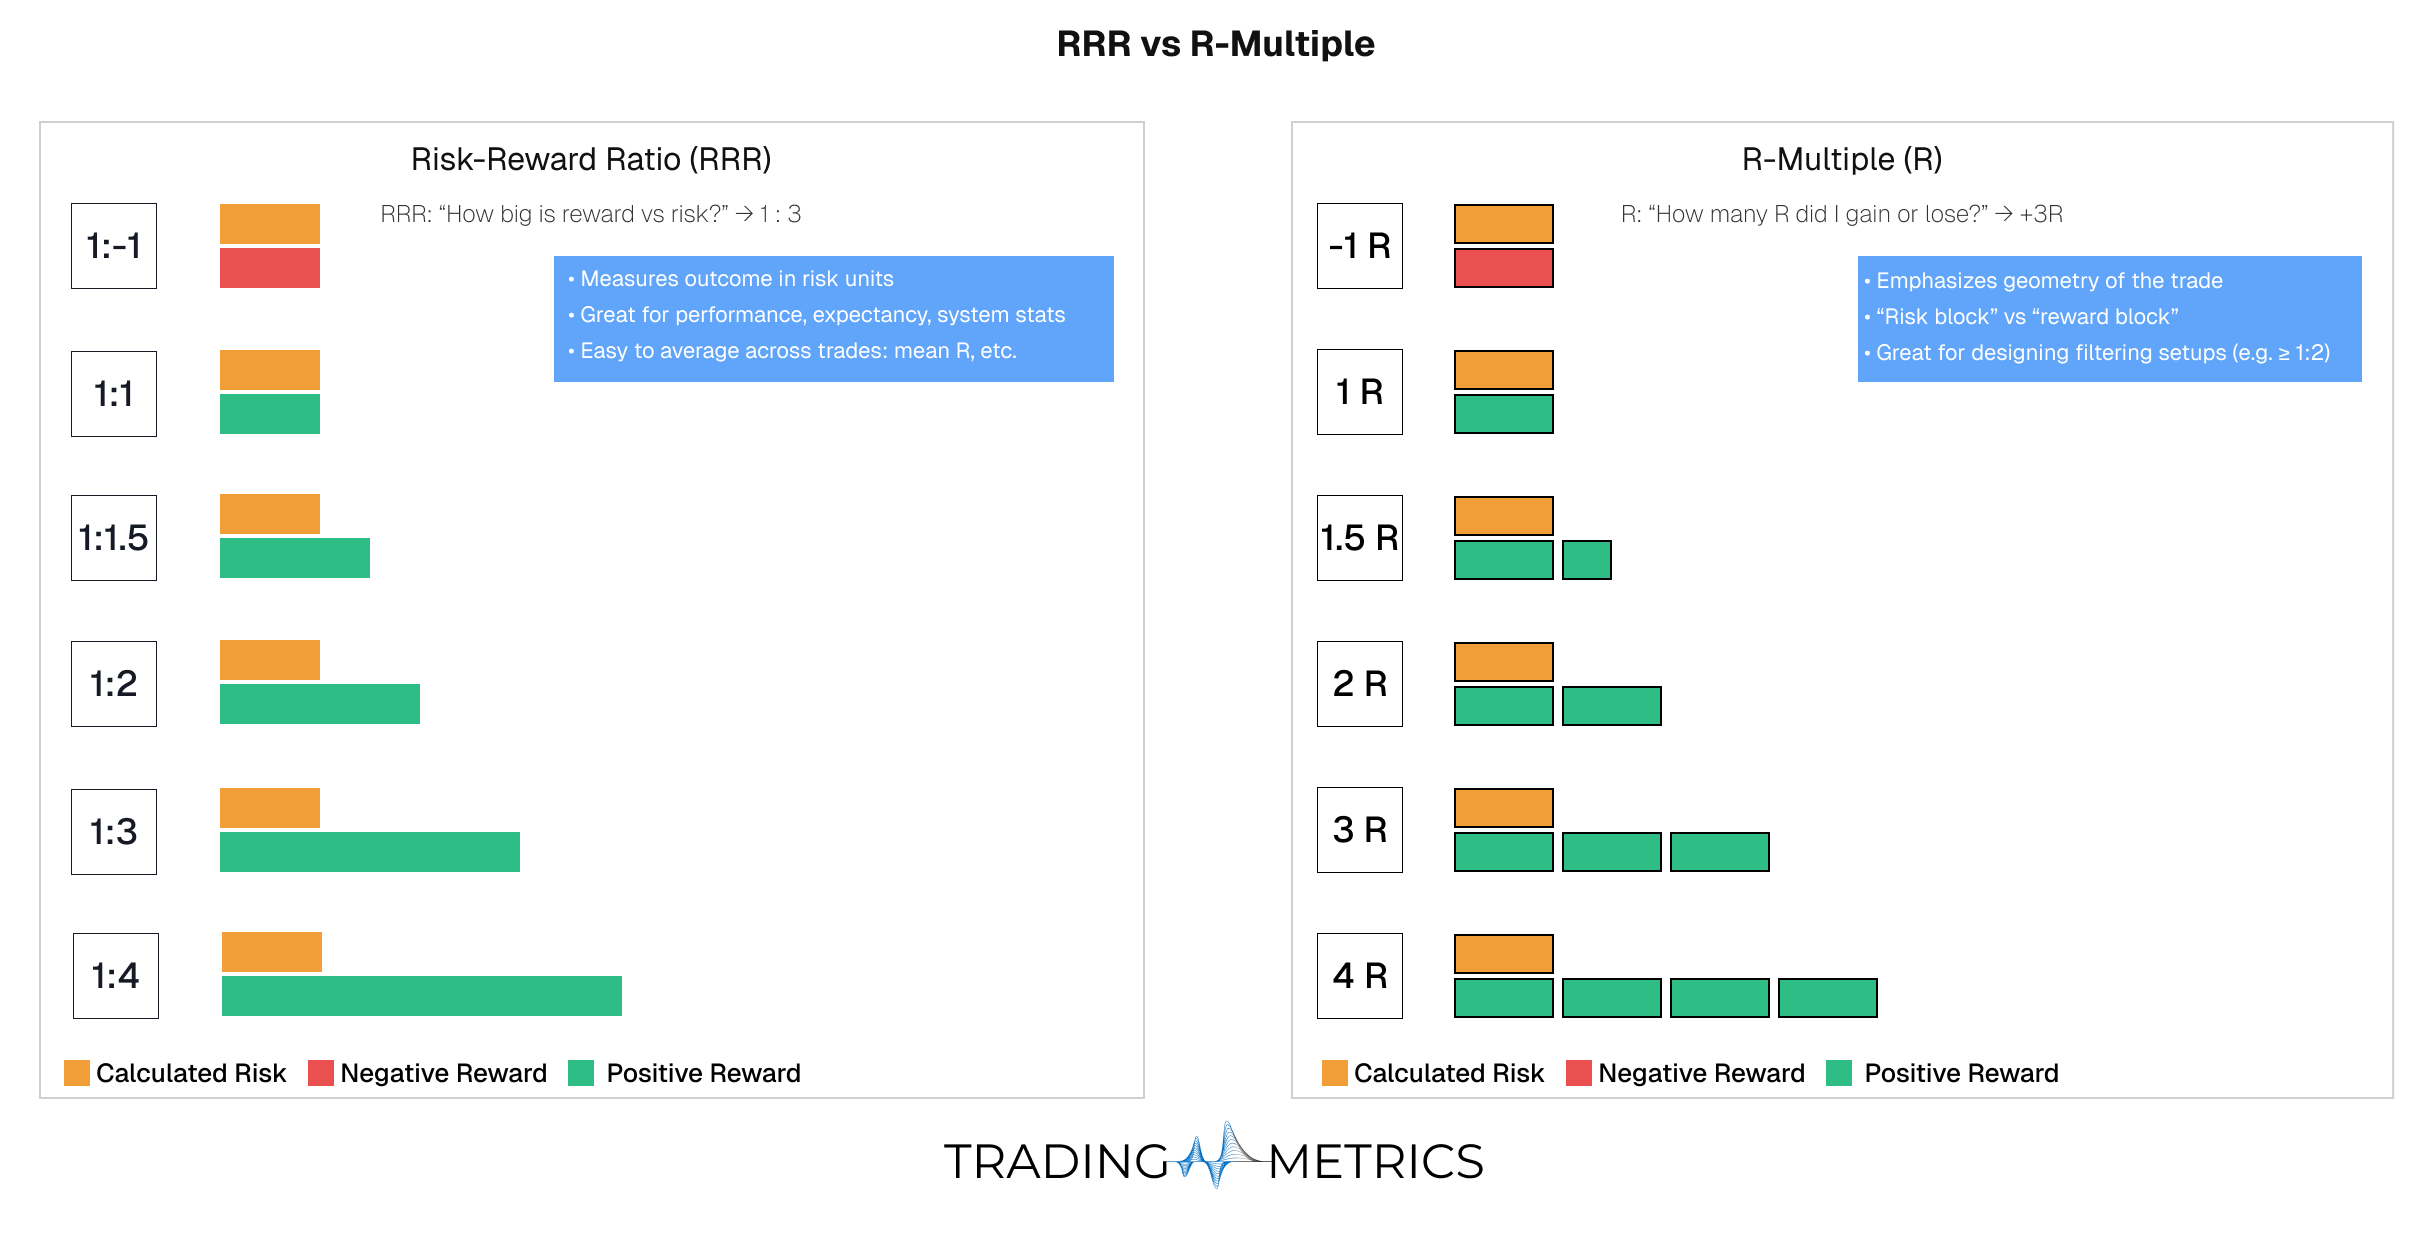
But Risk-Reward is not just one number - it’s a concept that combines two different tools: the Risk-Reward Ratio and the R-Multiple.
- Risk-Reward Ratio (RRR potential): the ratio you plan before entering a trade.
- Risk-Reward Ratio (RRR actual): the ratio that results after the trade closes.
- R-Multiple (potential): the planned outcome in R units at entry (e.g., target = +3R, risk = 1R).
- R-Multiple (actual): the realized outcome in R units after the trade closes (e.g., +2.4R or −0.6R).
What is Risk-Reward?
Risk-Reward refers to the relationship between how much a trader risks (the loss) and how much they aim to gain (the reward).
- RRR potential shows the planned reward versus risk when setting up a trade.
- RRR actual shows the realized reward versus risk after the trade ends.
- R-Multiple (potential) translates that plan into R units (e.g., aiming for +2R with a 1R risk).
- R-Multiple (actual) expresses the final result in the same R units for clear comparison across trades.
Think of it this way: RRR potential = plan, RRR actual = result. In parallel, R-Multiple (potential) = planned performance in R, and R-Multiple (actual) = realized performance in R.
Risk-Reward Ratio vs. R-Multiple
R-Multiple (potential) = planned outcome in R at entry;
R-Multiple (actual) = realized outcome in R at exit.
The Psychology of Risk-Reward Optimization
While Risk-Reward Ratios seem purely mathematical, the psychology behind how traders set and use them is where most problems arise. Understanding the mental traps around RRR can prevent costly mistakes.
The most dangerous belief in trading: “If I just aim for higher risk-reward ratios, I’ll make more money.” Higher RRR without considering win rate is a recipe for failure.
Why Traders Misuse Risk-Reward Ratios
Here are the most common psychological traps that lead to poor RRR decisions:
1. The “High RRR” Fallacy
Chasing huge risk-reward ratios while ignoring win rate and expectancy, leading to a strategy that looks good on paper but bleeds in practice.
- What it sounds like: “I only take trades with 1:5 or 1:10 risk-reward—that’s how pros trade”
- Reality: High RRR looks impressive, but if your win rate is 20%, you’re still losing money. A 1:2 RRR with 60% win rate massively outperforms 1:10 with 15% win rate.
- Psychological driver: Social media highlights, desire to look impressive, misunderstanding of expectancy
- Cost: Low win rate destroys confidence, leads to constant stop-outs, psychological burnout
2. Target Fixation (Hope Trading)
Refusing to exit a broken trade because you’re fixated on a distant target and hoping price will eventually get there.
- What it sounds like: “The market is close to my stop, but if I hold on, it might still hit my 1:4 target”
- Reality: You’re violating your stop-loss to chase an unlikely reward. Trade is already invalidated.
- Psychological driver: Loss aversion, sunk cost fallacy, need to be right
- Cost: Small planned losses become large actual losses; discipline breakdown
3. The Comparison Trap
Judging your own trading against other people’s highlight reels and feeling pressure to mimic their outsized R-multiple wins.
- What it sounds like: “Everyone on Twitter is posting 5R+ wins, so I need to find those setups too”
- Reality: You’re seeing survivorship bias—the highlight reel, not the full story. Most traders with high RRR have low win rates and struggle.
- Psychological driver: Social comparison, FOMO, imposter syndrome
- Cost: Abandoning strategies that actually work for you, chasing unrealistic setups
4. Ignoring Probability
Focusing on how much you could make on a trade instead of how often that outcome is likely to occur.
- What it sounds like: “This setup has 1:10 risk-reward potential, so it’s a great trade”
- Reality: RRR without win rate is meaningless. What matters is expectancy (RRR × win rate).
- Psychological driver: Overconfidence, confirmation bias, lack of statistical thinking
- Cost: Taking trades with negative expectancy thinking they’re good because RRR is high
5. Over-Optimization to Avoid Small Wins
Stretching profit targets to avoid “small” wins and in the process giving back solid profits or turning winners into losers.
- What it sounds like: “I don’t want to take profits at 1.5R—I’ll wait for at least 3R”
- Reality: You’re letting winners turn into losers or break-even trades by waiting for unrealistic targets.
- Psychological driver: Greed, perfectionism, fear of “leaving money on the table”
- Cost: Realized win rate drops, equity curve deteriorates despite having good entries
The goal isn’t to maximize RRR—it’s to maximize expectancy (which is RRR × win rate combined). A strategy with 1:1.5 RRR and 65% win rate is far superior to 1:5 RRR with 25% win rate.
Win Rate vs. Risk-Reward: The Critical Relationship
Risk-Reward Ratio and Win Rate are inseparable. You cannot evaluate RRR without knowing your win rate, and vice versa. Together, they determine your expectancy—whether your strategy actually makes money.
The Expectancy Formula
Expectancy is the average amount you expect to make (or lose) per trade over a large sample:
Simplified with R-Multiples:
If Expectancy > 0, your strategy is profitable long-term. If Expectancy < 0, you’re losing money despite individual wins.
Practical Examples: RRR + Win Rate Combinations
Here’s what different combinations produce:
| RRR Target (Risk:Reward) | Win Rate | Expectancy (per trade) | Result |
|---|---|---|---|
1:5 | 20% | (0.20 × 5R) - (0.80 × 1R) = +0.2R | ✅ Barely profitable (needs perfect execution) |
1:3 | 30% | (0.30 × 3R) - (0.70 × 1R) = +0.2R | ✅ Profitable but fragile |
1:2 | 50% | (0.50 × 2R) - (0.50 × 1R) = +0.5R | ✅ Solid edge |
1:1.5 | 60% | (0.60 × 1.5R) - (0.40 × 1R) = +0.5R | ✅ Strong edge (easier to achieve) |
1:1 | 70% | (0.70 × 1R) - (0.30 × 1R) = +0.4R | ✅ High-probability scalping edge |
1:10 | 15% | (0.15 × 10R) - (0.85 × 1R) = +0.65R | ⚠️ Looks good on paper, psychologically brutal |
1:3 | 25% | (0.25 × 3R) - (0.75 × 1R) = 0R | ❌ Breakeven (losing after costs) |
1:5 | 15% | (0.15 × 5R) - (0.85 × 1R) = -0.1R | ❌ Losing system despite high RRR |
Notice: A 1:5 RRR with 15% win rate loses money. Meanwhile, 1:1.5 RRR with 60% win rate is highly profitable. RRR alone tells you nothing about profitability.
Key Insight: The RRR-Win Rate Tradeoff
There’s an inverse relationship between achievable RRR and win rate:
- Higher targets (1:3, 1:5, 1:10) = Harder to hit = Lower win rate
- Tighter targets (1:1, 1:1.5, 1:2) = Easier to hit = Higher win rate
Your job is to find the optimal balance for your strategy, not chase the highest RRR.
Decision Framework for Setting RRR Targets
How do you decide what RRR to target? Here’s a practical framework based on strategy type, market structure, and probability.
Strategy-Based Framework
Different strategies naturally produce different RRR profiles:
Mean Reversion Trading
- Typical RRR: 1:1 to 1:2
- Why: Trading back to a mean—targets are naturally closer
- Expected Win Rate: 55-70%
- Example: Buying oversold bounces at support, targeting the moving average
Trend Following
- Typical RRR: 1:2 to 1:5
- Why: Riding momentum—targets can extend further
- Expected Win Rate: 35-50%
- Example: Breakout trades targeting next major resistance
Breakout Trading
- Typical RRR: 1:2 to 1:3
- Why: Explosive moves allow moderate targets
- Expected Win Rate: 40-55%
- Example: Range breakouts targeting measured moves
Scalping
- Typical RRR: 1:0.8 to 1:1.5
- Why: Quick in-and-out, small targets, high frequency
- Expected Win Rate: 60-75%
- Example: Order flow or level-to-level scalping
Match your RRR expectations to your strategy type. Don’t try to force 1:5 targets on mean reversion trades—it won’t work.
Market Structure Method
Let the chart tell you what RRR is realistic:
Steps:
- Identify your entry point
- Place your stop-loss at logical invalidation (support/resistance, structure break)
- Identify next realistic resistance (for longs) or support (for shorts)
- Calculate: Target Distance ÷ Stop Distance = RRR
Example:
- Entry: $100
- Stop: $98 (2% below = $2 risk)
- Next resistance: $106 (6% above = $6 reward)
- RRR = 1:3 (risk $2 to gain $6)
The Rule: If the chart-based RRR is < 1:1.5, seriously consider skipping the trade. Risk-reward is unfavorable.
Volatility-Adjusted Approach
Volatility determines how far price can realistically move:
High Volatility Environments:
- Wider price swings allow higher RRR targets (1:3, 1:4, 1:5)
- But also require wider stops to avoid noise
Low Volatility Environments:
- Tighter ranges mean lower RRR expectations (1:1, 1:1.5, 1:2)
- Stops can be tighter too
Use ATR as a guide:
- Target = Entry ± (2-3 × ATR)
- Stop = Entry ∓ (1 × ATR)
- This gives you RRR of 1:2 to 1:3 naturally based on volatility
The Pragmatic Test
Before committing to an RRR target, ask yourself:
“Based on my historical data, can this target realistically be hit at least 40% of the time?”
If no, your target is too ambitious. Lower it or skip the trade.
If yes, and the expectancy is positive, the trade is valid.
Track in your journal:
- Planned RRR vs. Realized RRR
- How often you hit your targets
- Average RRR achieved per strategy type
This data tells you what’s actually achievable vs. what looks good on paper.
Key Points
- Risk-Reward Ratio (RRR) comes in two forms:
- R-Multiple also maps to planning and results:
- R-Multiple (potential) → the planned outcome in R (e.g., +2R target with 1R risk).
- R-Multiple (actual) → the realized outcome in R when the trade ends.
- RRR without win rate is meaningless – what matters is expectancy (RRR × win rate).
- Higher RRR doesn’t always mean better – a 1:1.5 RRR with 60% win rate beats 1:5 with 20% win rate every time.
- There’s an inverse relationship between achievable RRR and win rate—higher targets = lower hit rate.
- Match RRR to strategy type: Mean reversion (1:1-1:2), trend following (1:2-1:5), breakouts (1:2-1:3), scalping (1:0.8-1:1.5).
- Let market structure determine RRR – if chart-based RRR is < 1:1.5, consider skipping the trade.
- Track planned vs. realized RRR in your journal to see what’s actually achievable.
- Avoid psychological traps: high RRR fallacy, target fixation, comparison trap, ignoring probability, over-optimization.
- Focus on expectancy optimization, not RRR maximization – consistent profitability comes from the combination.
- Use RRR potential for planning, RRR actual for review, and R-Multiple (potential/actual) for standardized performance analysis.
Conclusion
Understanding Risk-Reward requires distinguishing between planning and reality—and more importantly, between isolated metrics and integrated thinking.
The three-part framework:
- Use RRR potential to design the trade
- Use RRR actual to see what really happened
- Use R-Multiple (potential/actual) to track performance in standardized units
But here’s the critical insight that most traders miss:
RRR is worthless without win rate. You cannot evaluate a 1:5 setup without knowing it only hits 15% of the time. And you cannot dismiss a 1:1.5 setup without knowing it hits 65% of the time. The combination—expectancy—is what determines profitability.
The psychological traps are real:
Most traders chase high RRR because it looks impressive, feels ambitious, and matches what they see on social media. But the math doesn’t care about feelings.
While a 1:10 RRR with 15% win rate has a theoretical expectancy of +0.65R (higher than 1:1.5 @ 60% which yields +0.5R), the practical reality is different. Most traders cannot psychologically sustain an 85% loss rate. The discipline breakdown leads to early profit-taking, moving stops, and revenge trading—causing realized expectancy to plummet far below the theoretical number. A trader with 1:1.5 RRR and 60% win rate typically outperforms in practice because the strategy is psychologically sustainable.
The path forward:
- Calculate your actual expectancy across 50-100 trades
- Match RRR targets to your strategy type (don’t force 1:5 on mean reversion)
- Let market structure guide targets, not ego or social comparison
- Track planned vs. realized in your journal
- Focus on optimizing expectancy, not maximizing RRR
When you combine solid RRR planning with disciplined psychology, proper position sizing, and realistic expectations, you build a sustainable edge.
The power of Risk-Reward comes from the combination: RRR potential for planning, RRR actual for feedback, R-Multiple for standardized tracking—all integrated with win rate to produce positive expectancy.
Frequently Asked Questions
Quick answers based on this page's topic.
A high 1:10 Risk-Reward Ratio looks great but is unprofitable if your win rate is only 5%. Profitable trading is about 'Expectancy'—the mathematical combination of how much you win versus how often you win across a large sample of trades.
R-Multiples standardize your results by measuring profit in units of risk rather than dollars. This allows you to compare performance across different assets and account sizes, revealing the true efficiency of your trading strategy without being skewed by nominal values.
Realistic targets should be based on market structure—like support and resistance levels—rather than arbitrary numbers. A sound plan ensures the reward potential is at least 1.5 to 2 times the risk while remaining within the asset's typical volatility range.
Most professional traders require at least a 1:1.5 ratio, meaning the potential reward is 1.5 times the risk. A 1:2 or higher ratio is preferred because it allows a trader to remain profitable even with a win rate below 50%, providing a mathematical buffer against losing streaks.
Expectancy equals (Win Rate multiplied by Average Win) minus (Loss Rate multiplied by Average Loss). For example, with a 40% win rate and a 1:3 RRR, your expectancy per trade is (0.40 times 3R) minus (0.60 times 1R) equals 0.60R, meaning you earn 0.60 units of risk per trade on average.