Exponential Moving Average (EMA): The Trader’s Default MA
The Exponential Moving Average (EMA) is a moving average that gives more weight to the latest price data, making it more responsive to recent market movements than the Simple Moving Average (SMA). Traders use the EMA to smooth price action and better spot emerging trends over time.
A stock is never too high to buy, nor too low to sell.
- Jesse Livermore
How to Use Exponential Moving Average (EMA)?
The EMA (Exponential Moving Average) is a powerful tool for traders seeking to respond quickly to price changes while maintaining a focus on trends. Here is how you can use it effectively in trading:
Identify Short-Term and Long-Term Trends
The EMA gives more weight to recent price data, making it ideal for identifying both short-term and long-term trends depending on the chosen period.
React Quickly to Price Changes
Due to its sensitivity to recent price action, the EMA allows traders to spot trend reversals and momentum shifts faster than the SMA.
Use Crossovers for Entry and Exit Signals
When a shorter EMA (e.g., 9-EMA) crosses above a longer EMA (e.g., 21-EMA), it signals potential bullish momentum. Conversely, a bearish crossover occurs when the shorter EMA crosses below the longer EMA.
Combine with Other Indicators
The EMA works well in conjunction with oscillators like the RSI or MACD to confirm signals and improve trade accuracy.
Adapt to Different Timeframes
The EMA can be tailored to different trading styles. Shorter periods (e.g., 5-EMA) suit scalping or day trading, while longer periods (e.g., 50-EMA) are better for swing or position trading.
Manage Support and Resistance Levels
In trending markets, the EMA often serves as a dynamic support or resistance level, helping traders identify potential bounce or rejection points.
Focus on Trending Markets
Like the SMA, the EMA is most effective in trending conditions. In choppy or range-bound markets, additional tools are needed to filter false signals.
How to Calculate EMA?
The Exponential Moving Average (EMA) is calculated using the following steps:
Calculate the Initial SMA
The first step in calculating the EMA is to compute the Simple Moving Average (SMA) of the first ( n ) periods. This is used as the initial EMA value.
Where:
- = Price at period
- = Number of periods
Calculate the Multiplier
The smoothing factor (multiplier) for weighting the EMA is calculated as follows:
Where:
- = Number of periods
Calculate the EMA
Once the initial SMA and the multiplier are known, the EMA can be calculated using the formula:
Where:
- = EMA at the current period
- = Price at the current period
- = EMA at the previous period
Importance of EMA in Trading
The EMA is important in trading because it responds quickly to recent price changes, making it ideal for identifying shifts in momentum and trends. Its ability to weight recent data more heavily helps traders capture early signals of reversals or continuations. Additionally, the EMA serves as a dynamic support or resistance level, aiding in decision-making during trending markets.
Choose the Right Time Frame: Depending on your trading style (day trading, swing trading, long-term investing), select an appropriate EMA period.
Standardized EMA Values: Understanding the Common Choices in Trading
In the world of trading, certain Exponential Moving Average (EMA) values have become standardized due to their effectiveness in various market conditions. These values are commonly used by traders to identify trends, generate signals, and make informed decisions. Let’s delve into the most widely used EMA periods 10, 20, 50, 100, and 200 and understand why they are popular and how they are typically applied.
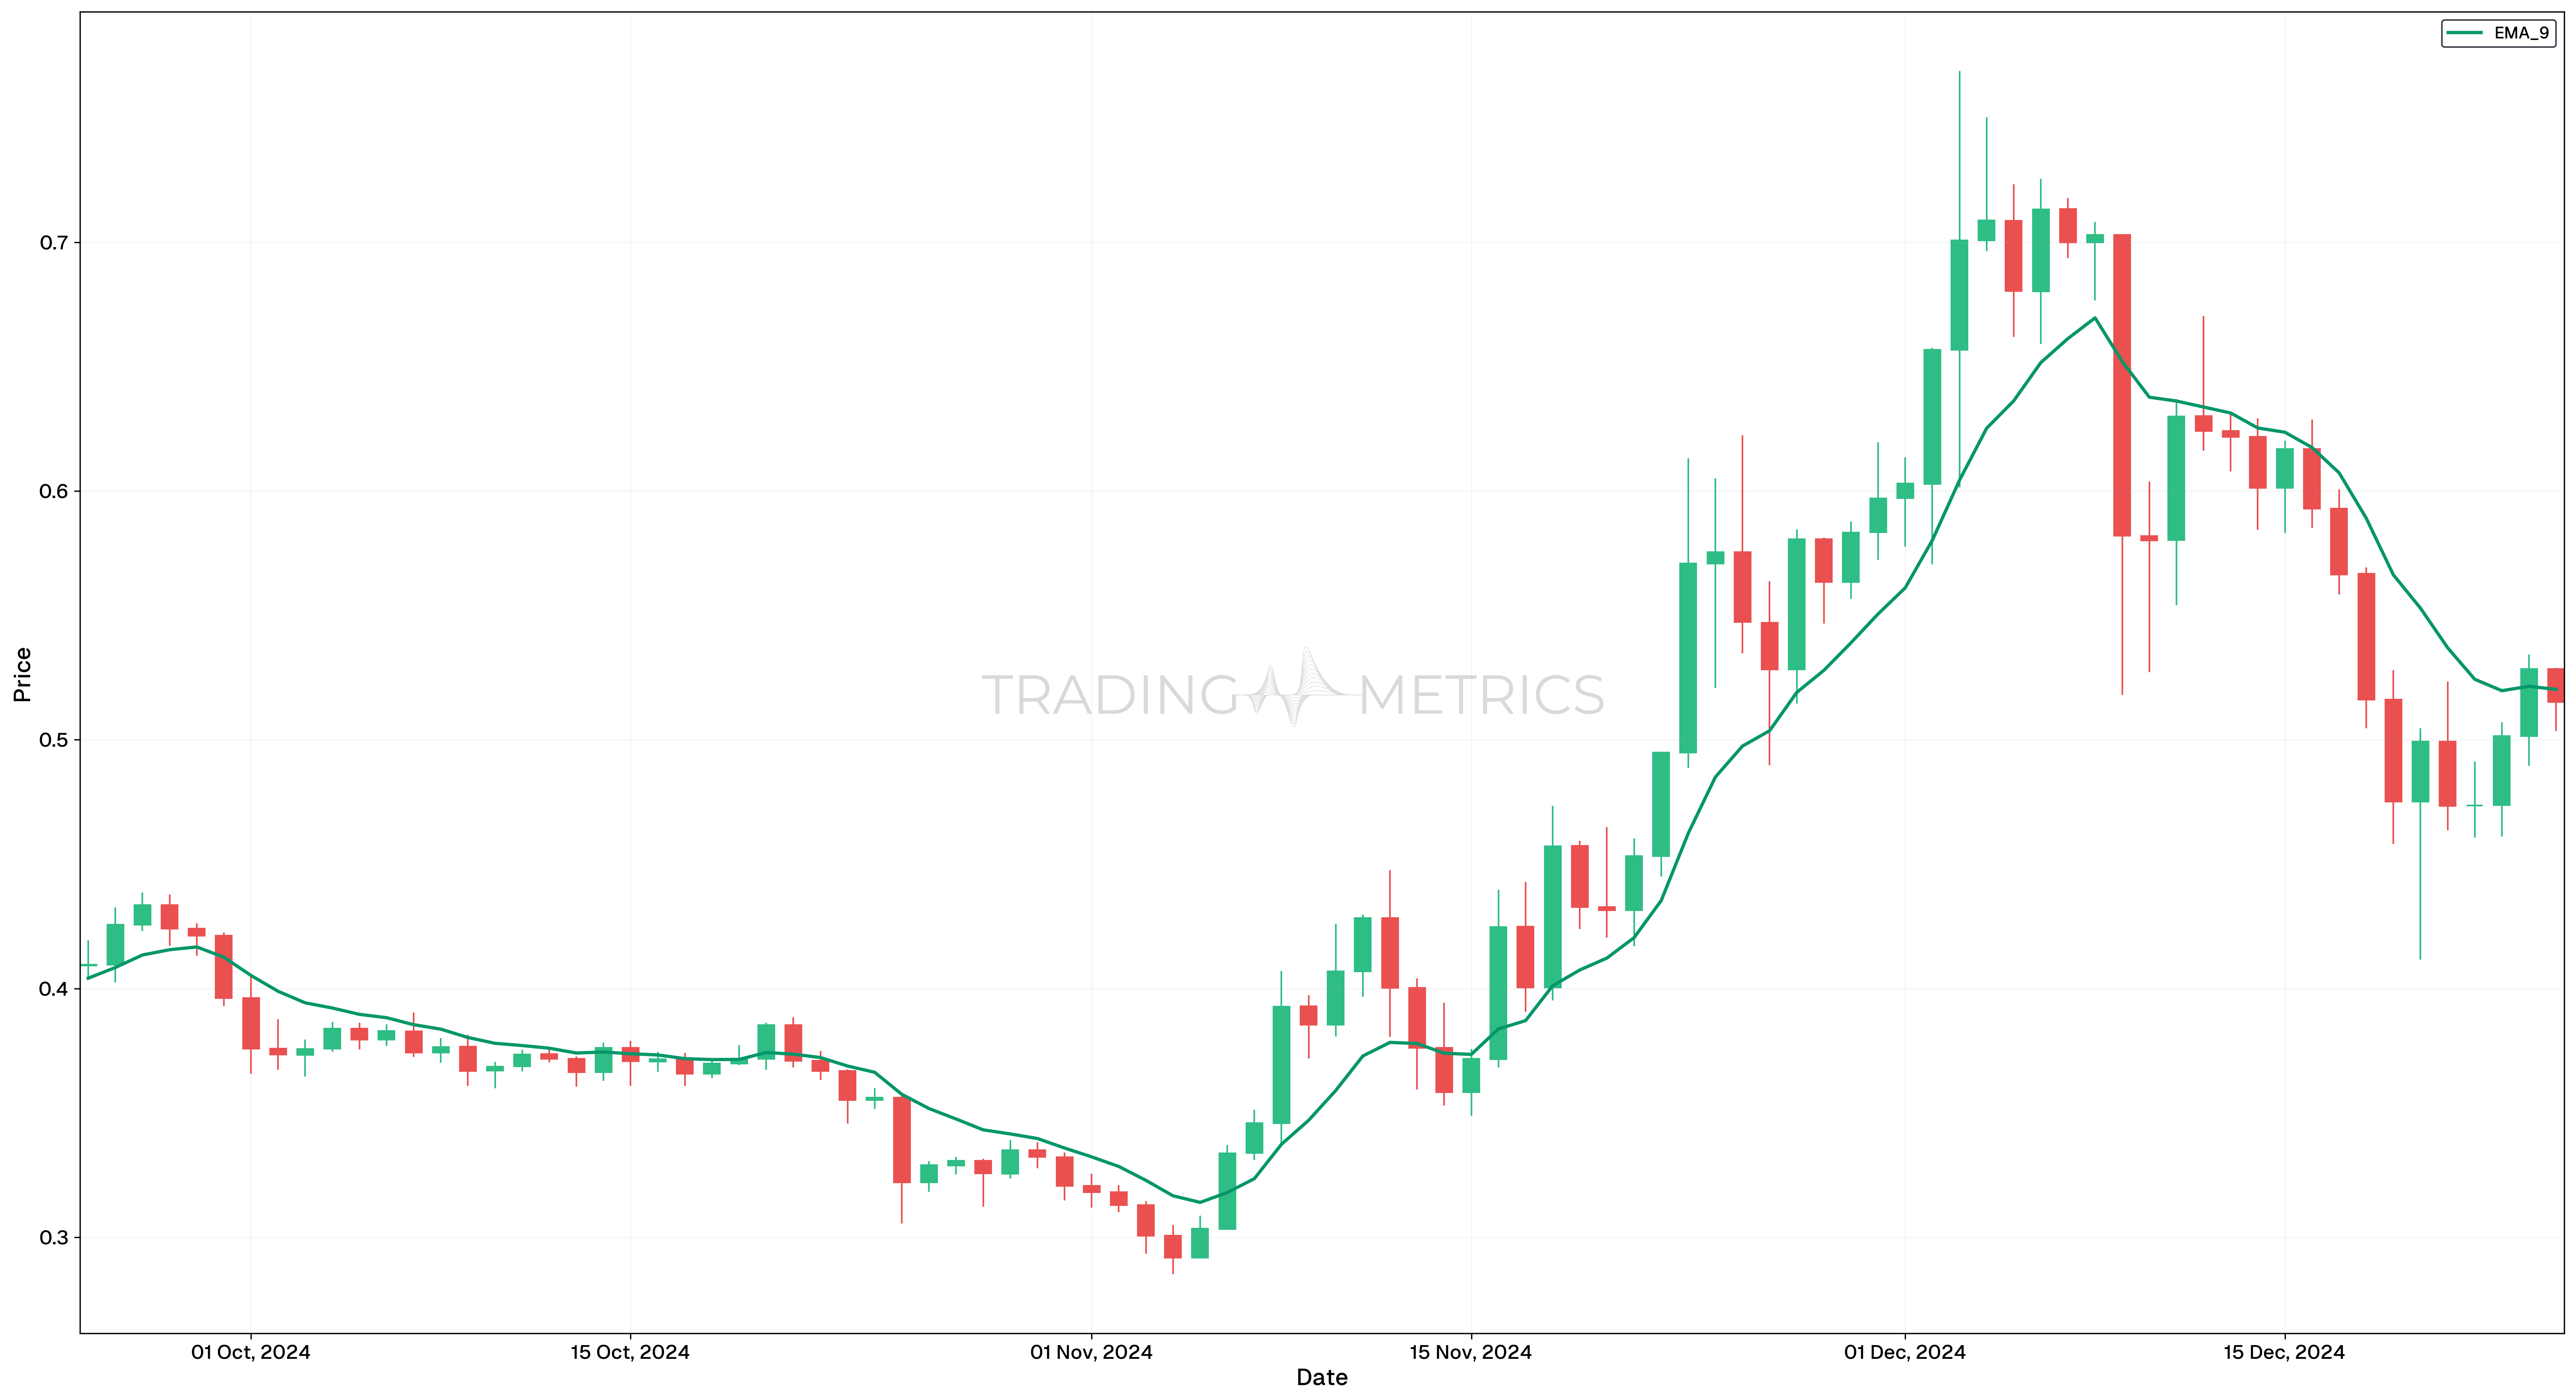
EMA 9: The Short-Term Tracker
9-Day EMA Overview
- Period: 9 days
- Sensitivity: High
Key Characteristics
- The 9-day EMA is favored by day traders and short-term traders.
- Its high sensitivity makes it responsive to market price changes, ideal for quick trend identification.
Usage
- Primarily used to capture short-term market movements.
- Effective for generating rapid buy or sell signals.
Buy/Sell Signals
- Buy Signal: When the price crosses above the 9-day EMA, it may indicate the start of a short-term uptrend.
- Sell Signal: When the price crosses below the 9-day EMA, it could signal the beginning of a short-term downtrend.
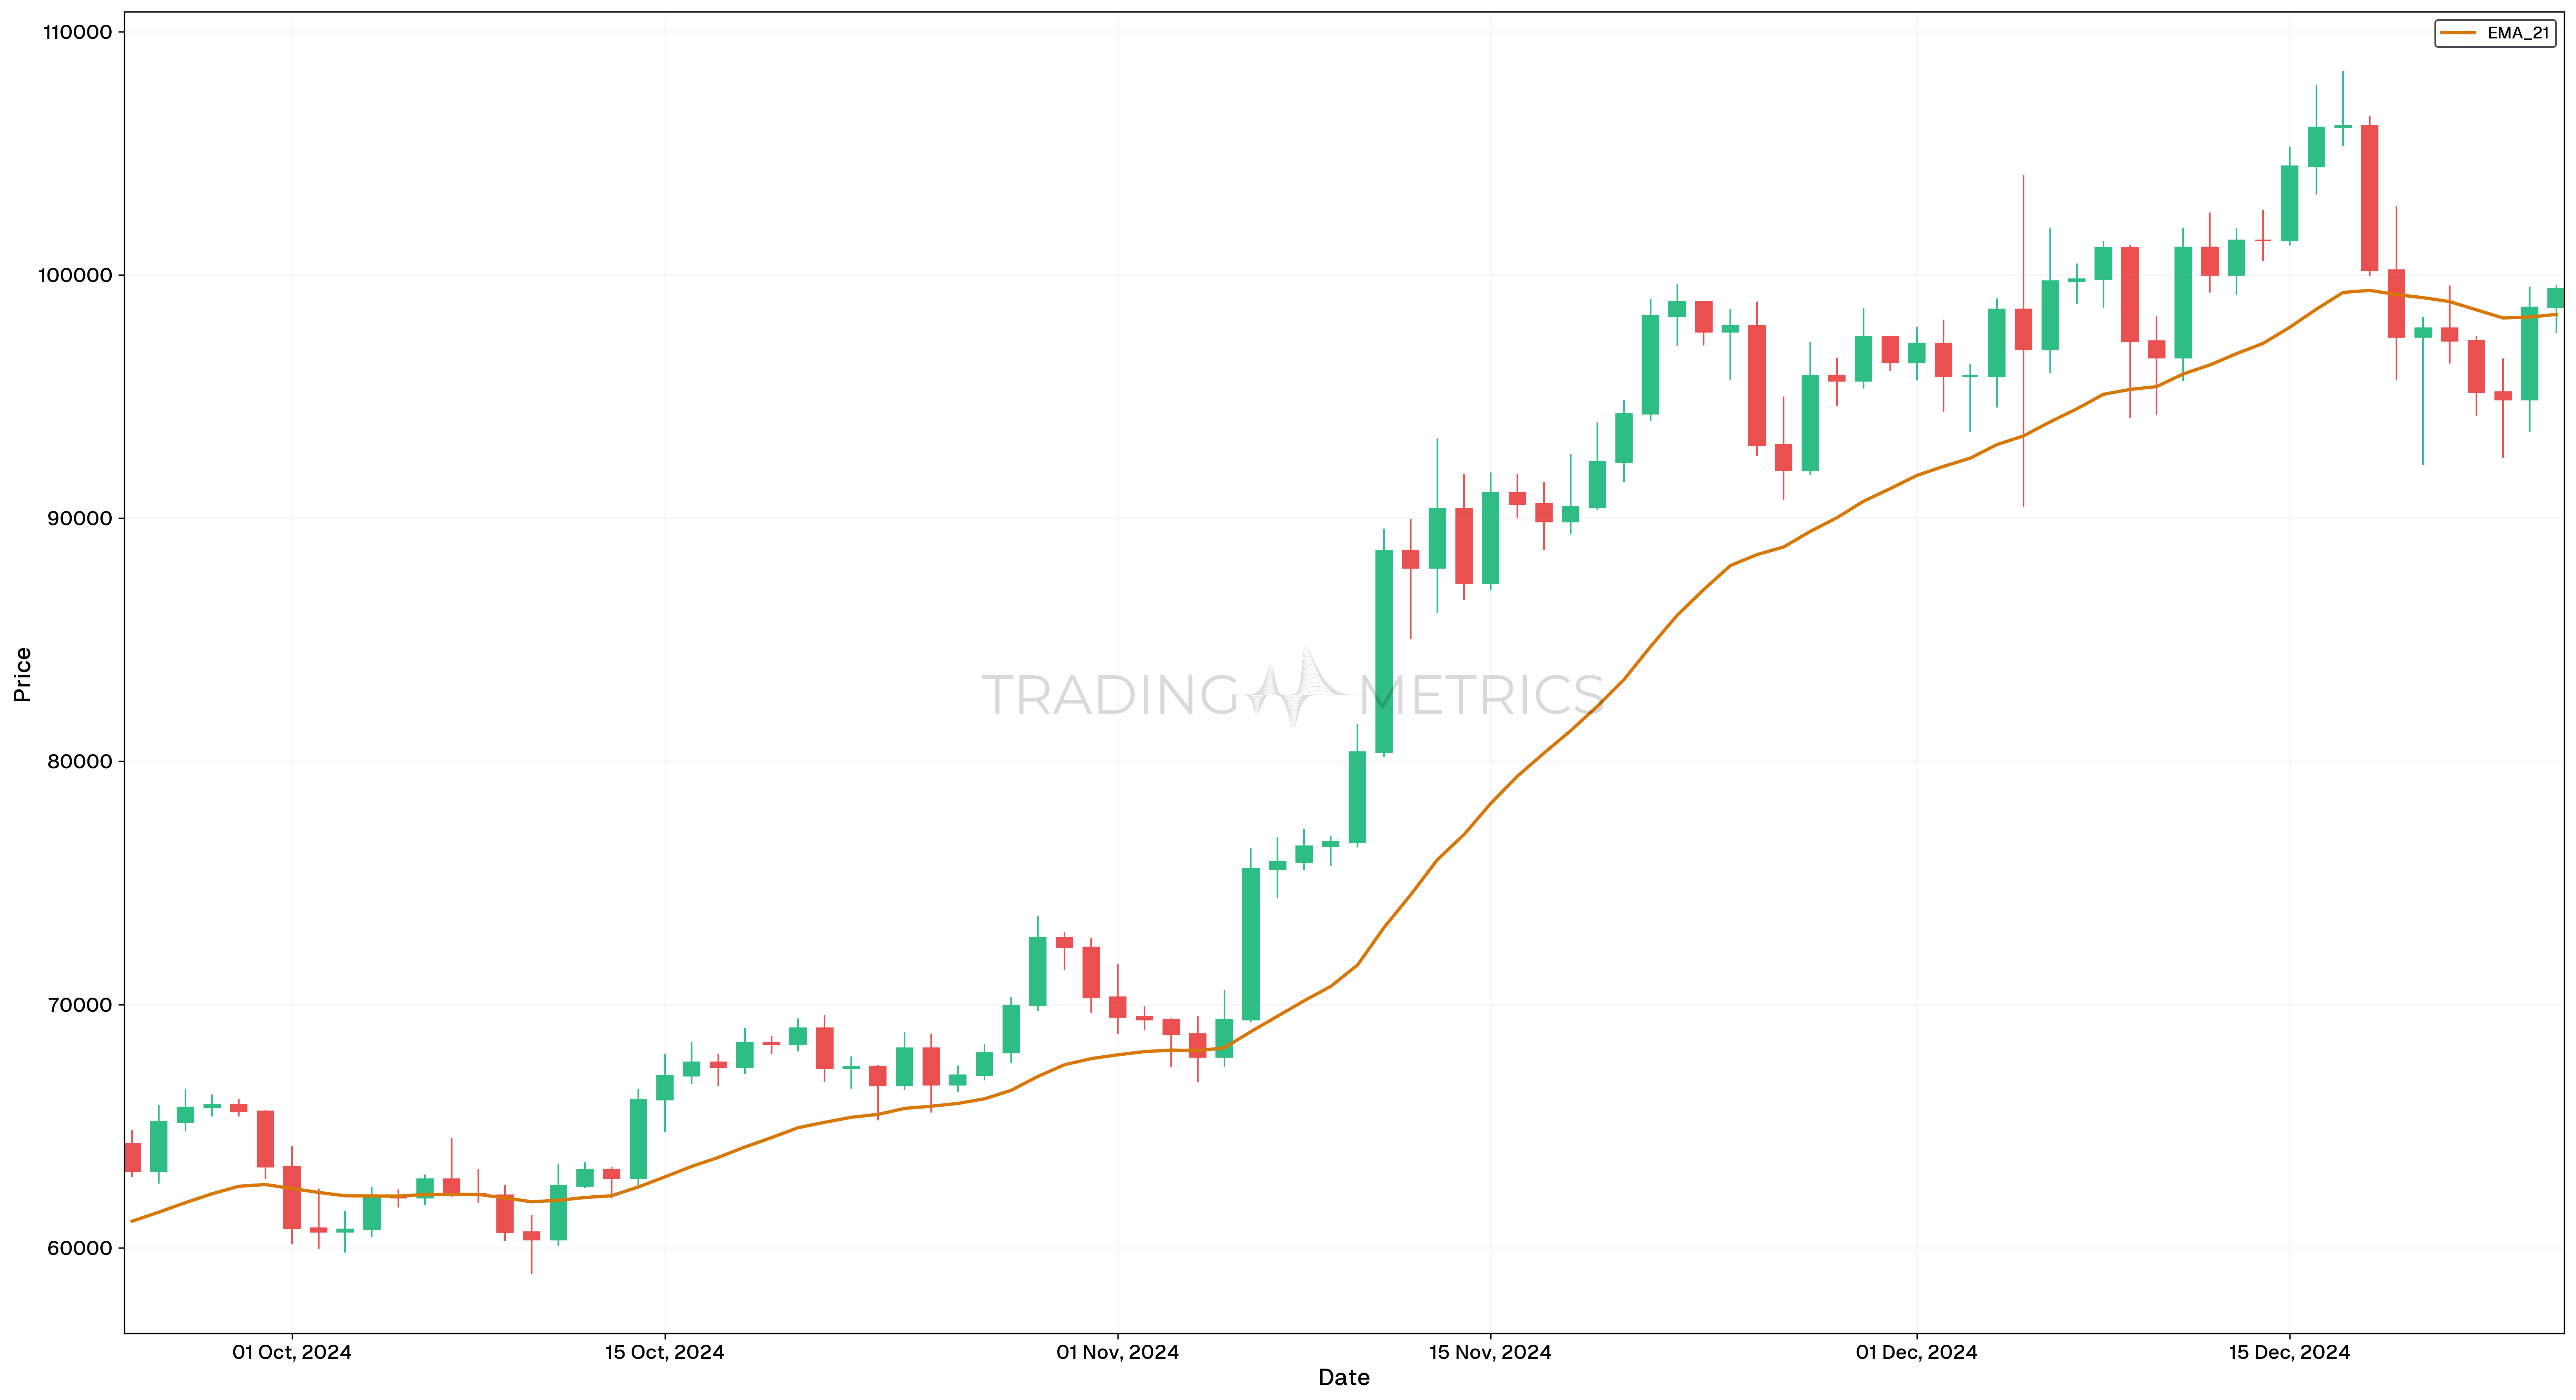
EMA 21: The Intermediate Guide
21-Day EMA Overview
- Period: 21 days
- Sensitivity: Moderate
Key Characteristics
- The 21-day EMA is commonly used by swing traders who hold positions for several days to a few weeks.
- It balances sensitivity and reliability, making it a versatile tool for intermediate-term trend analysis.
Usage
- Ideal for capturing intermediate-term market trends.
- Suitable for traders looking to identify trends over a few days to weeks.
Support/Resistance
- The 21-day EMA often acts as a dynamic support or resistance level.
- Helps traders identify optimal entry and exit points based on price interaction with the EMA.
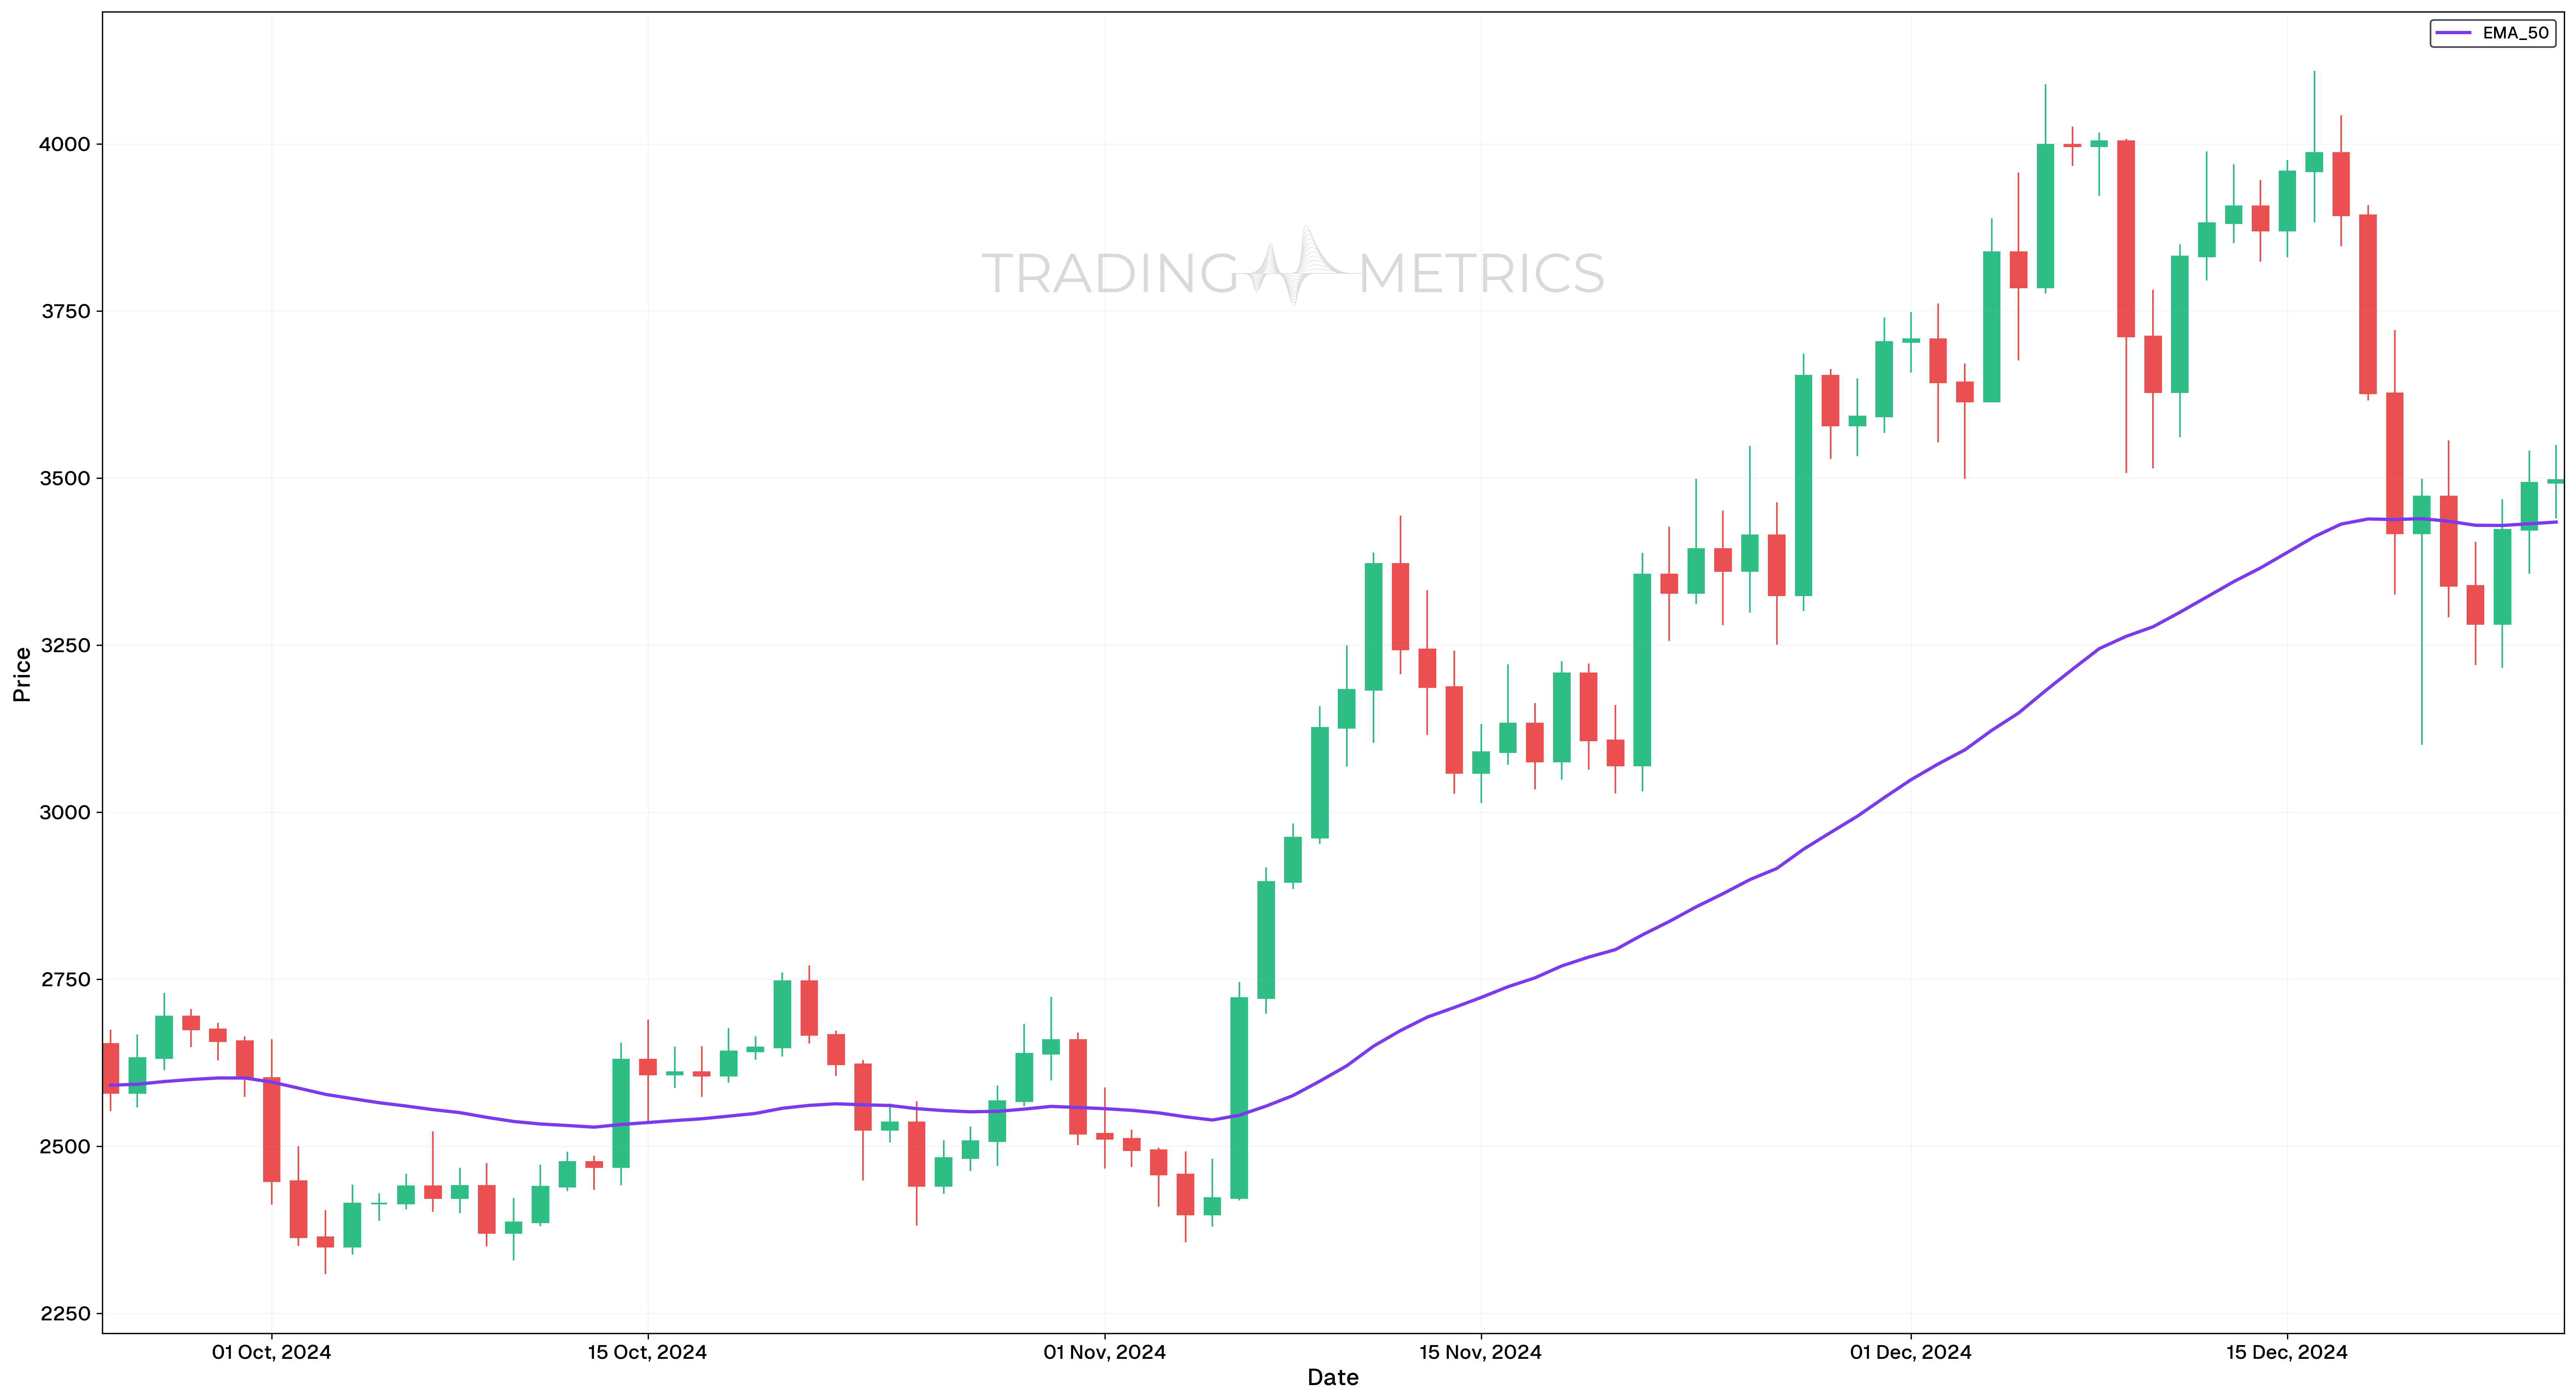
EMA 50: The Popular Trend Identifier
50-Day EMA Overview
- Period: 50 days
- Sensitivity: Moderate-Low
Key Characteristics
- The 50-day EMA is widely used by traders to identify medium-term trends.
- It is less sensitive than the 10-day or 20-day EMA, reducing market noise and offering a clearer view of the overall trend.
Usage
- Ideal for medium-term trend analysis.
- Helps traders focus on more sustained market movements.
Trend Confirmation
- A price above the 50-day EMA typically signals an uptrend.
- A price below the 50-day EMA usually indicates a downtrend.
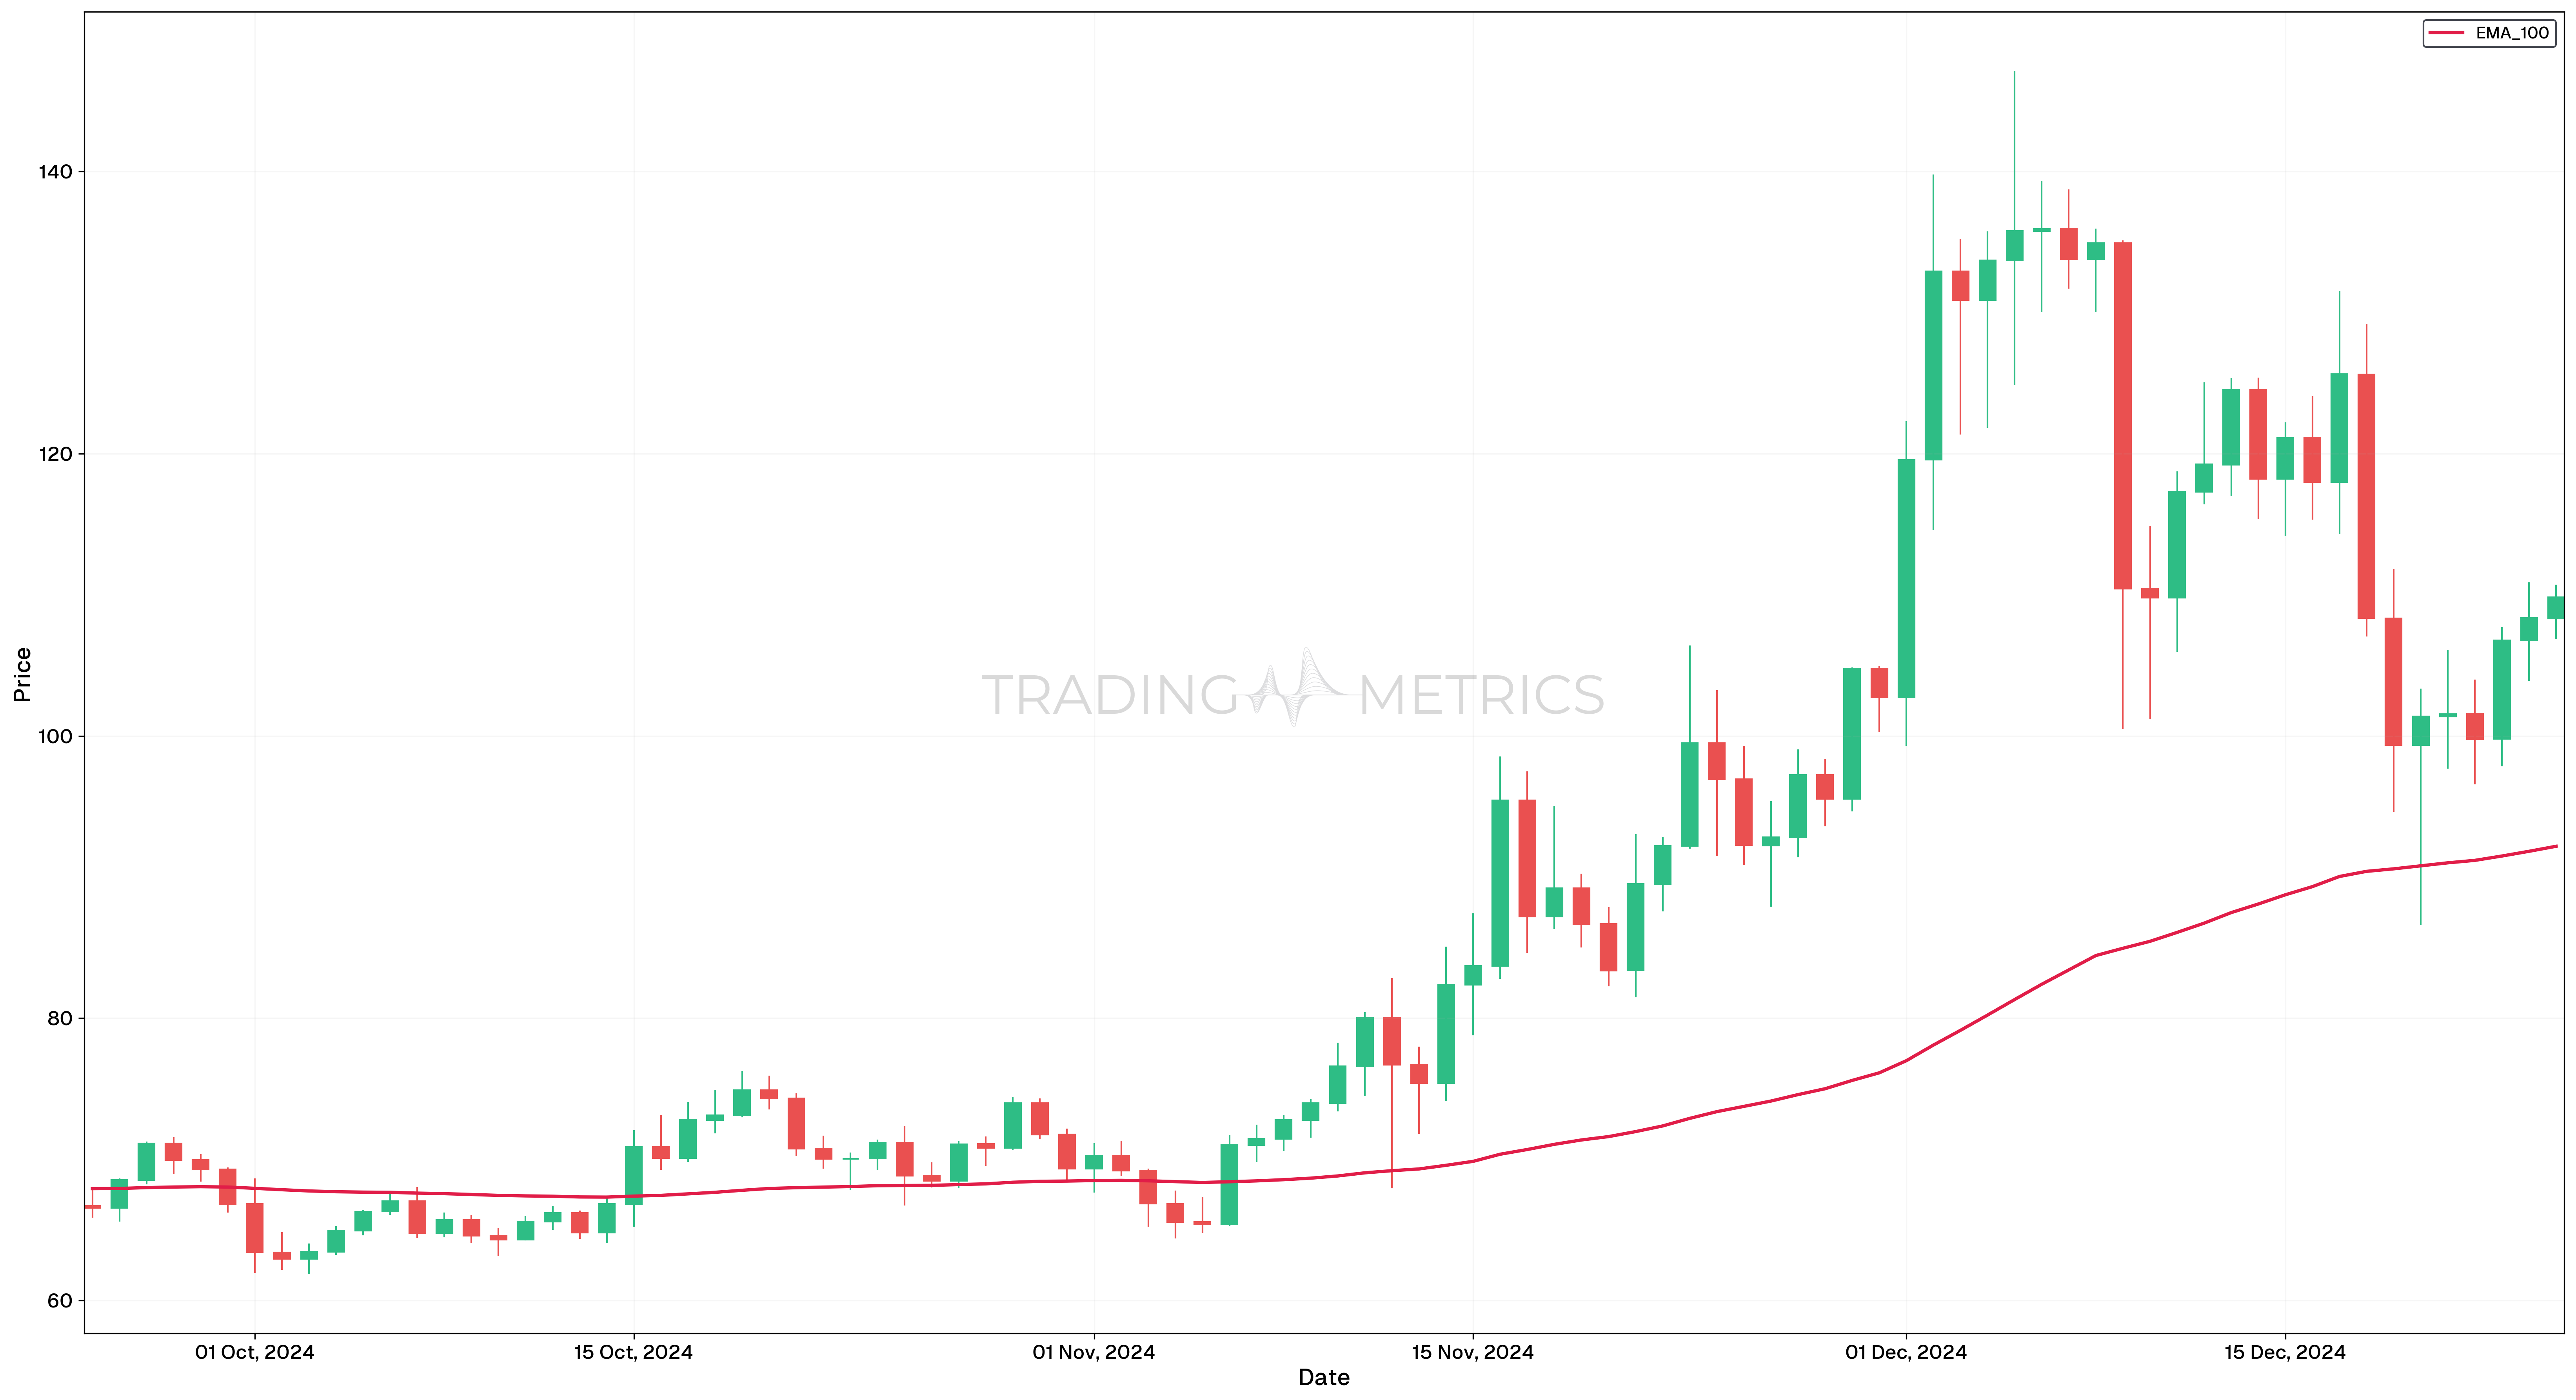
EMA 100: The Long-Term Observer
100-Day EMA Overview
- Period: 100 days
- Sensitivity: Low
Key Characteristics
- The 100-day EMA is commonly used by traders and investors to analyze long-term market trends.
- It smooths out short-term fluctuations, offering a clearer picture of the broader market direction.
Usage
- Ideal for understanding long-term market trends.
- Helps in identifying sustained movements over extended periods.
Major Support/Resistance
- The 100-day EMA frequently acts as a key support or resistance level.
- Breaches of this EMA can signal major trend reversals.
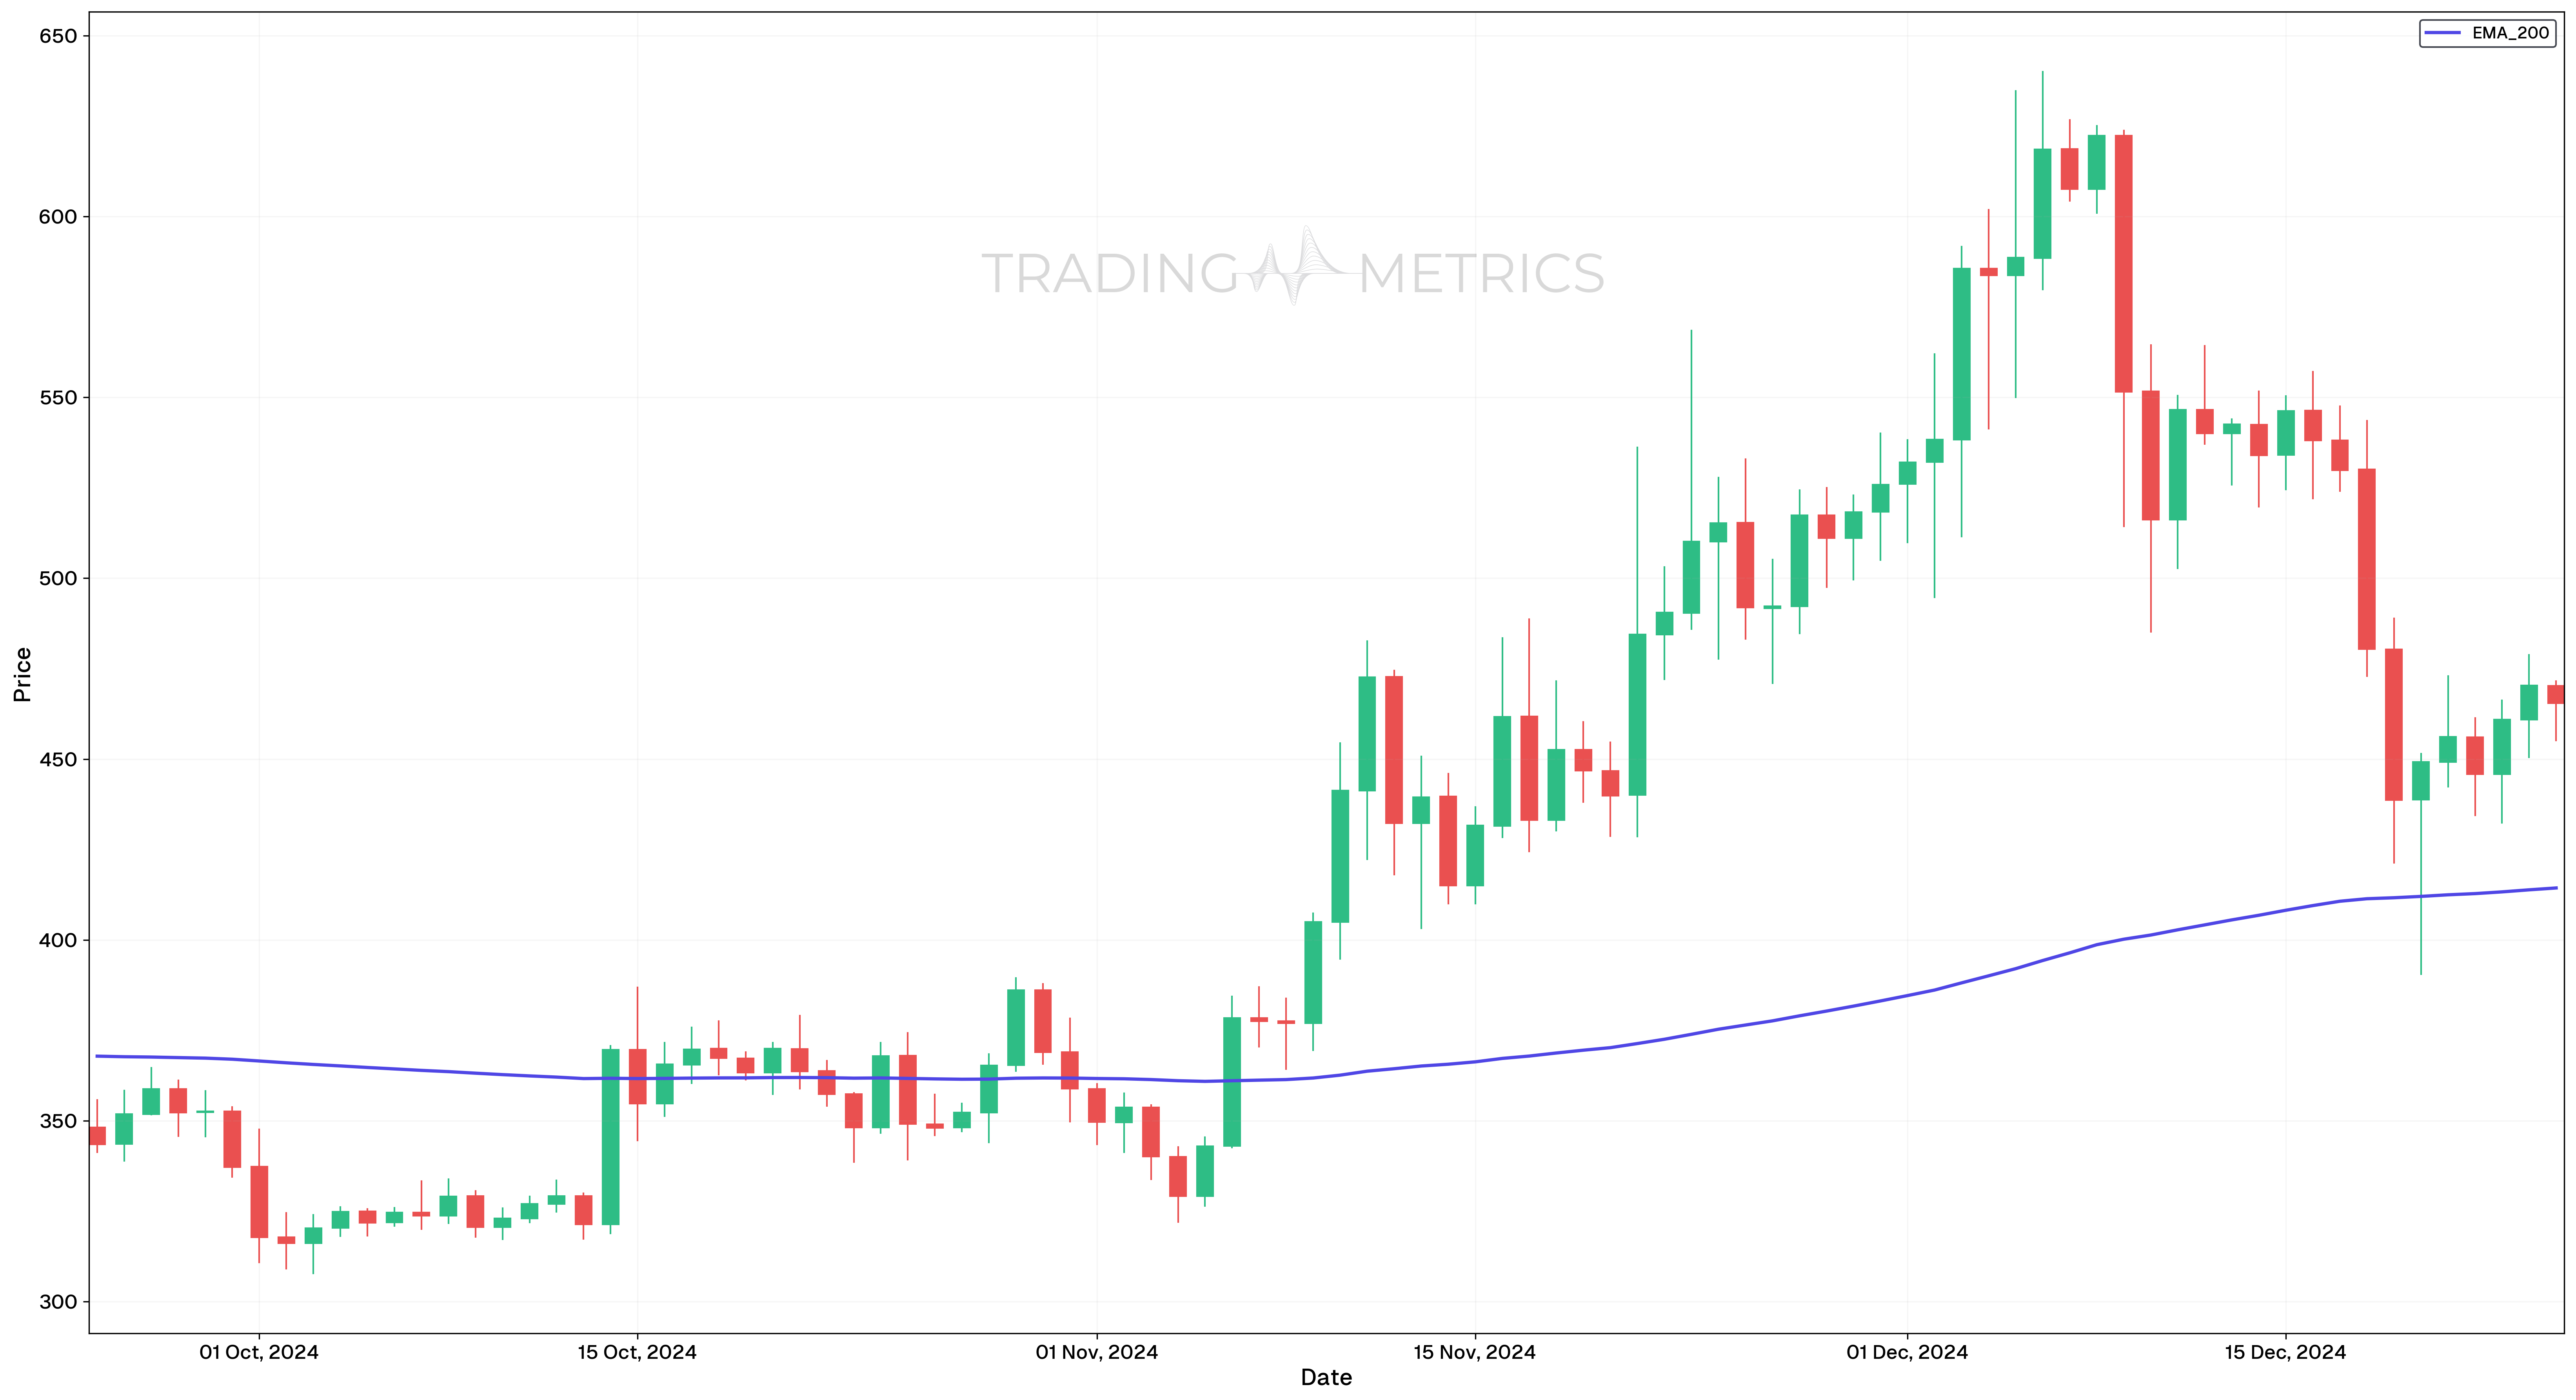
EMA 200: The Granddaddy of EMAs
200-Day EMA Overview
- Period: 200 days
- Sensitivity: Very Low
Key Characteristics
- The 200-day EMA is one of the most widely respected indicators among traders and investors.
- It represents a very long-term trend and is often utilized by institutional investors and fund managers.
Usage
- Best suited for analyzing long-term market trends.
- Serves as a cornerstone for assessing the overall market direction.
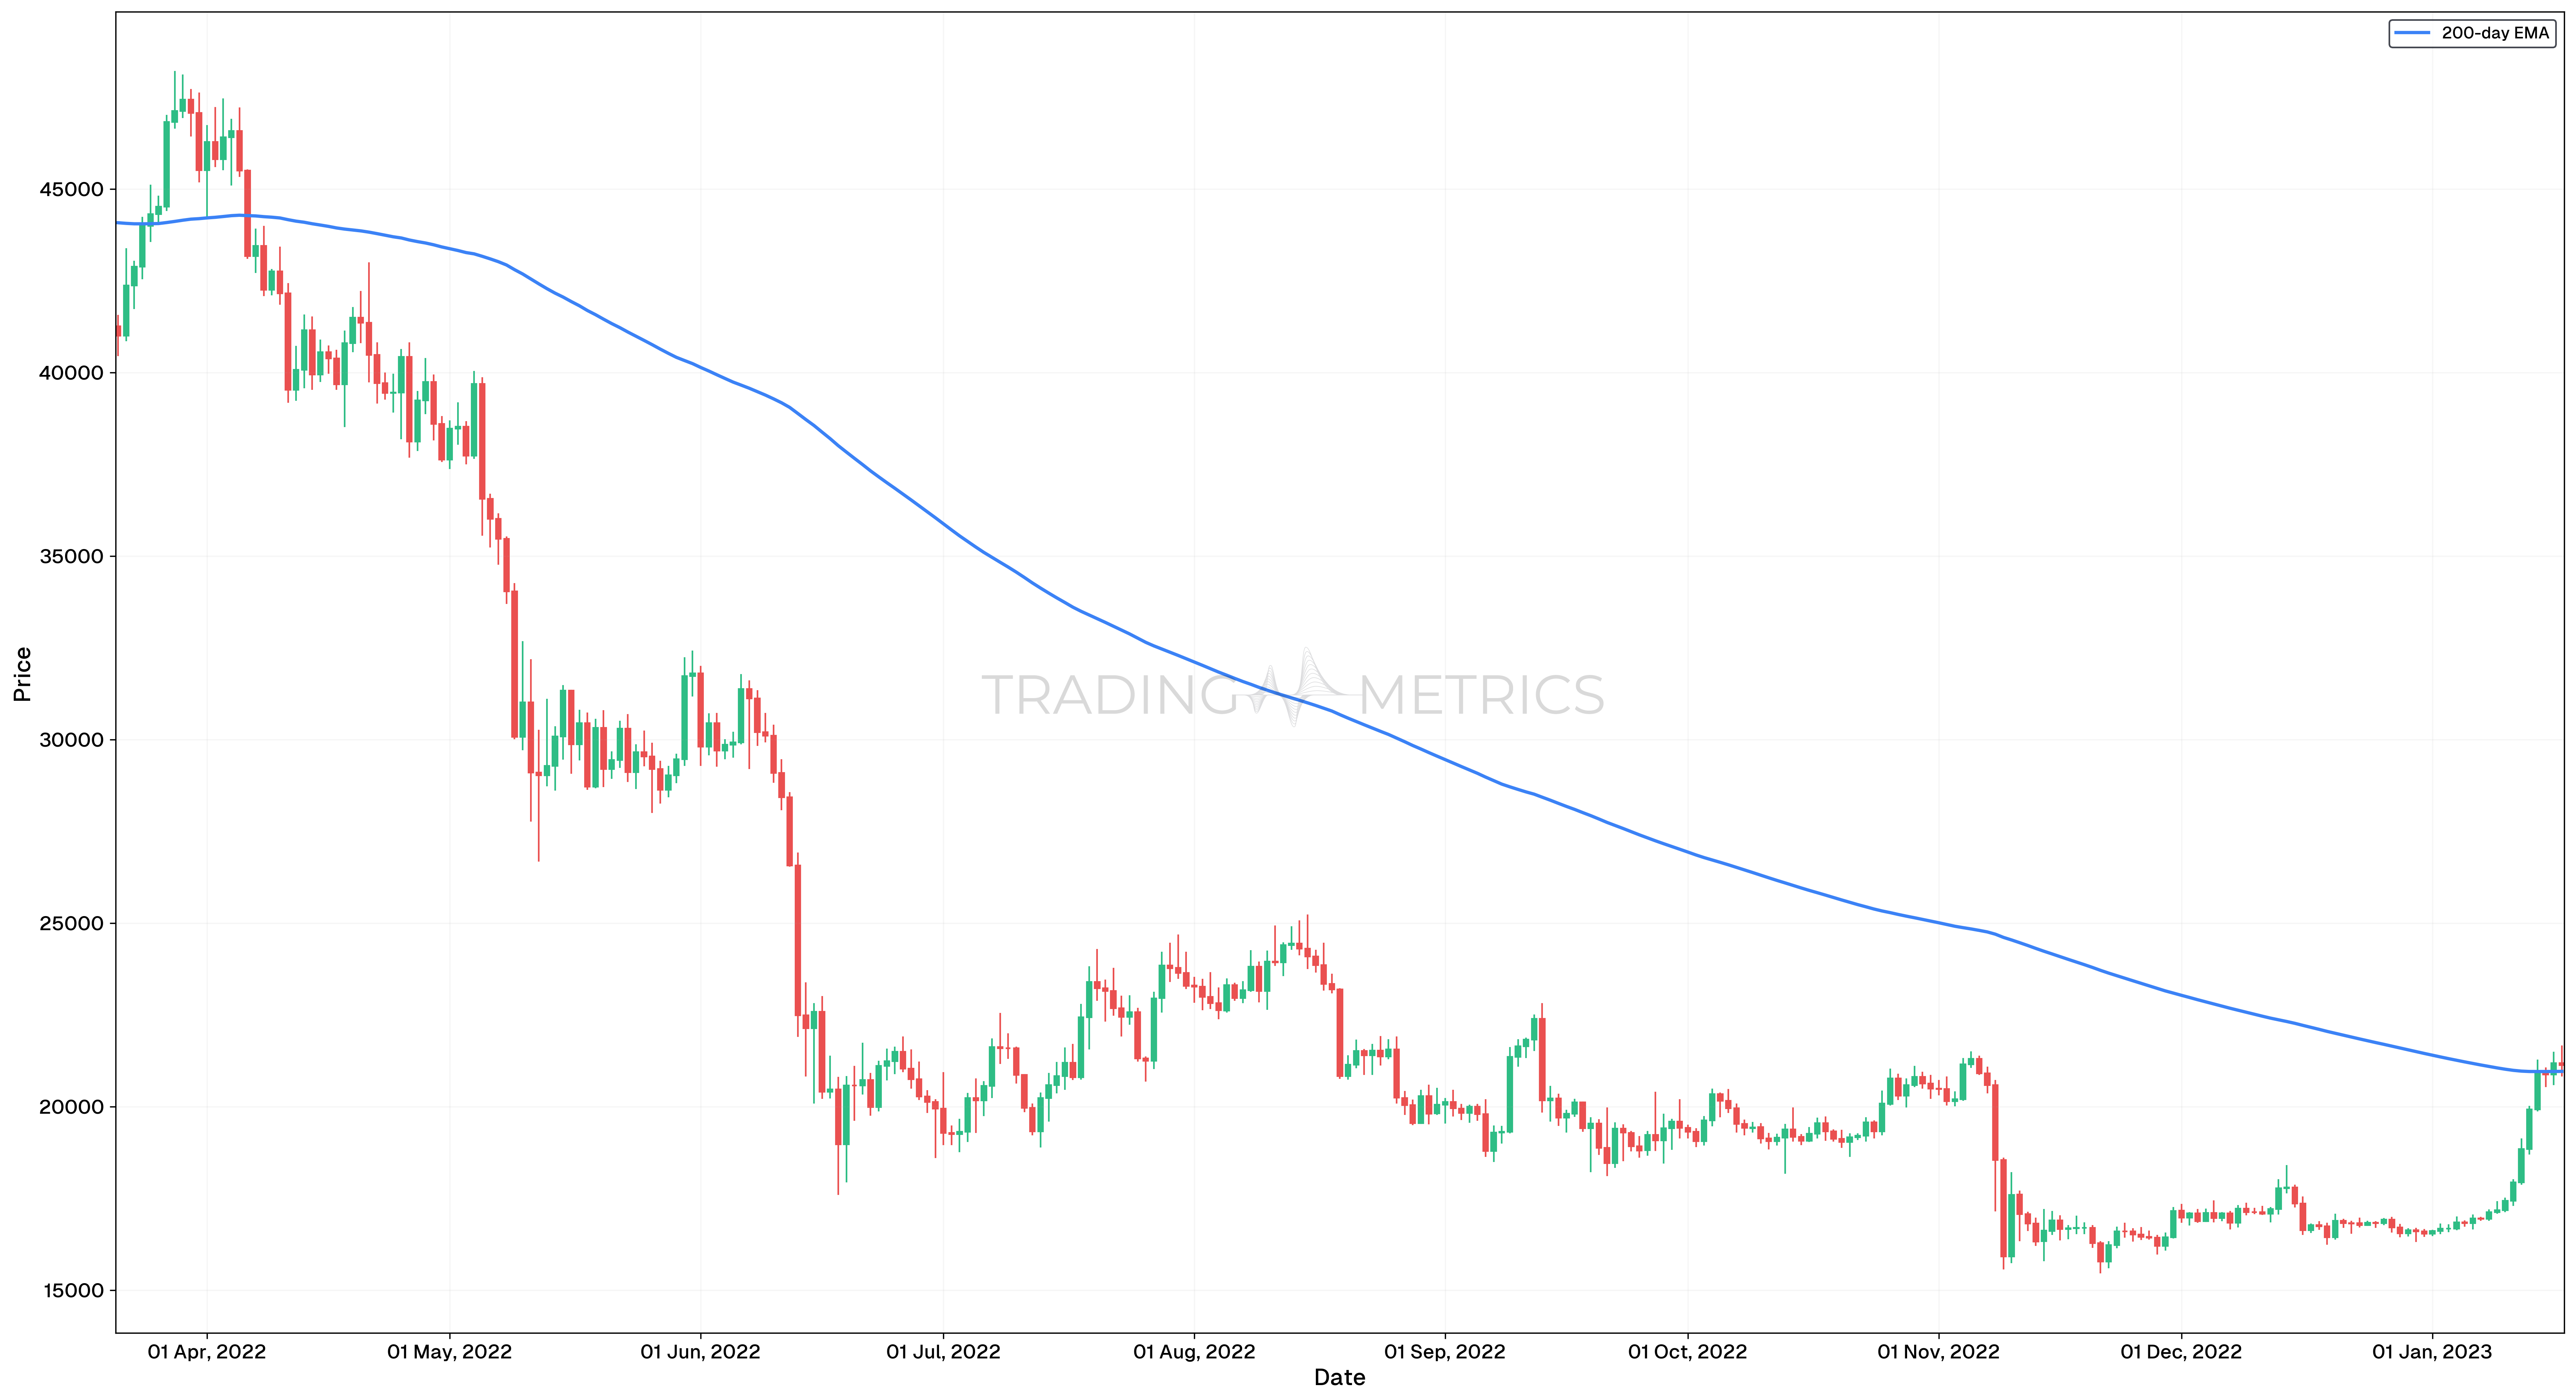
Market Sentiment
- The 200-day EMA is regarded as a key line dividing bullish and bearish markets.
- Above the 200-day EMA: Indicates a long-term uptrend.
- Below the 200-day EMA: Suggests a long-term downtrend.
Overall Analysis
Standardized EMA values such as the 10-day, 20-day, 50-day, 100-day, and 200-day EMA are important components of a trader’s toolkit. Each serves a unique role, from detecting short-term momentum to validating long-term trends. By effectively integrating these standardized EMA values into their strategies, traders can gain deeper insights and respond more proactively to market dynamics. Whether you are a scalper seeking rapid signals or a swing trader focused on sustained trends, these EMA values provide powerful tools to enhance your trading decisions and outcomes.
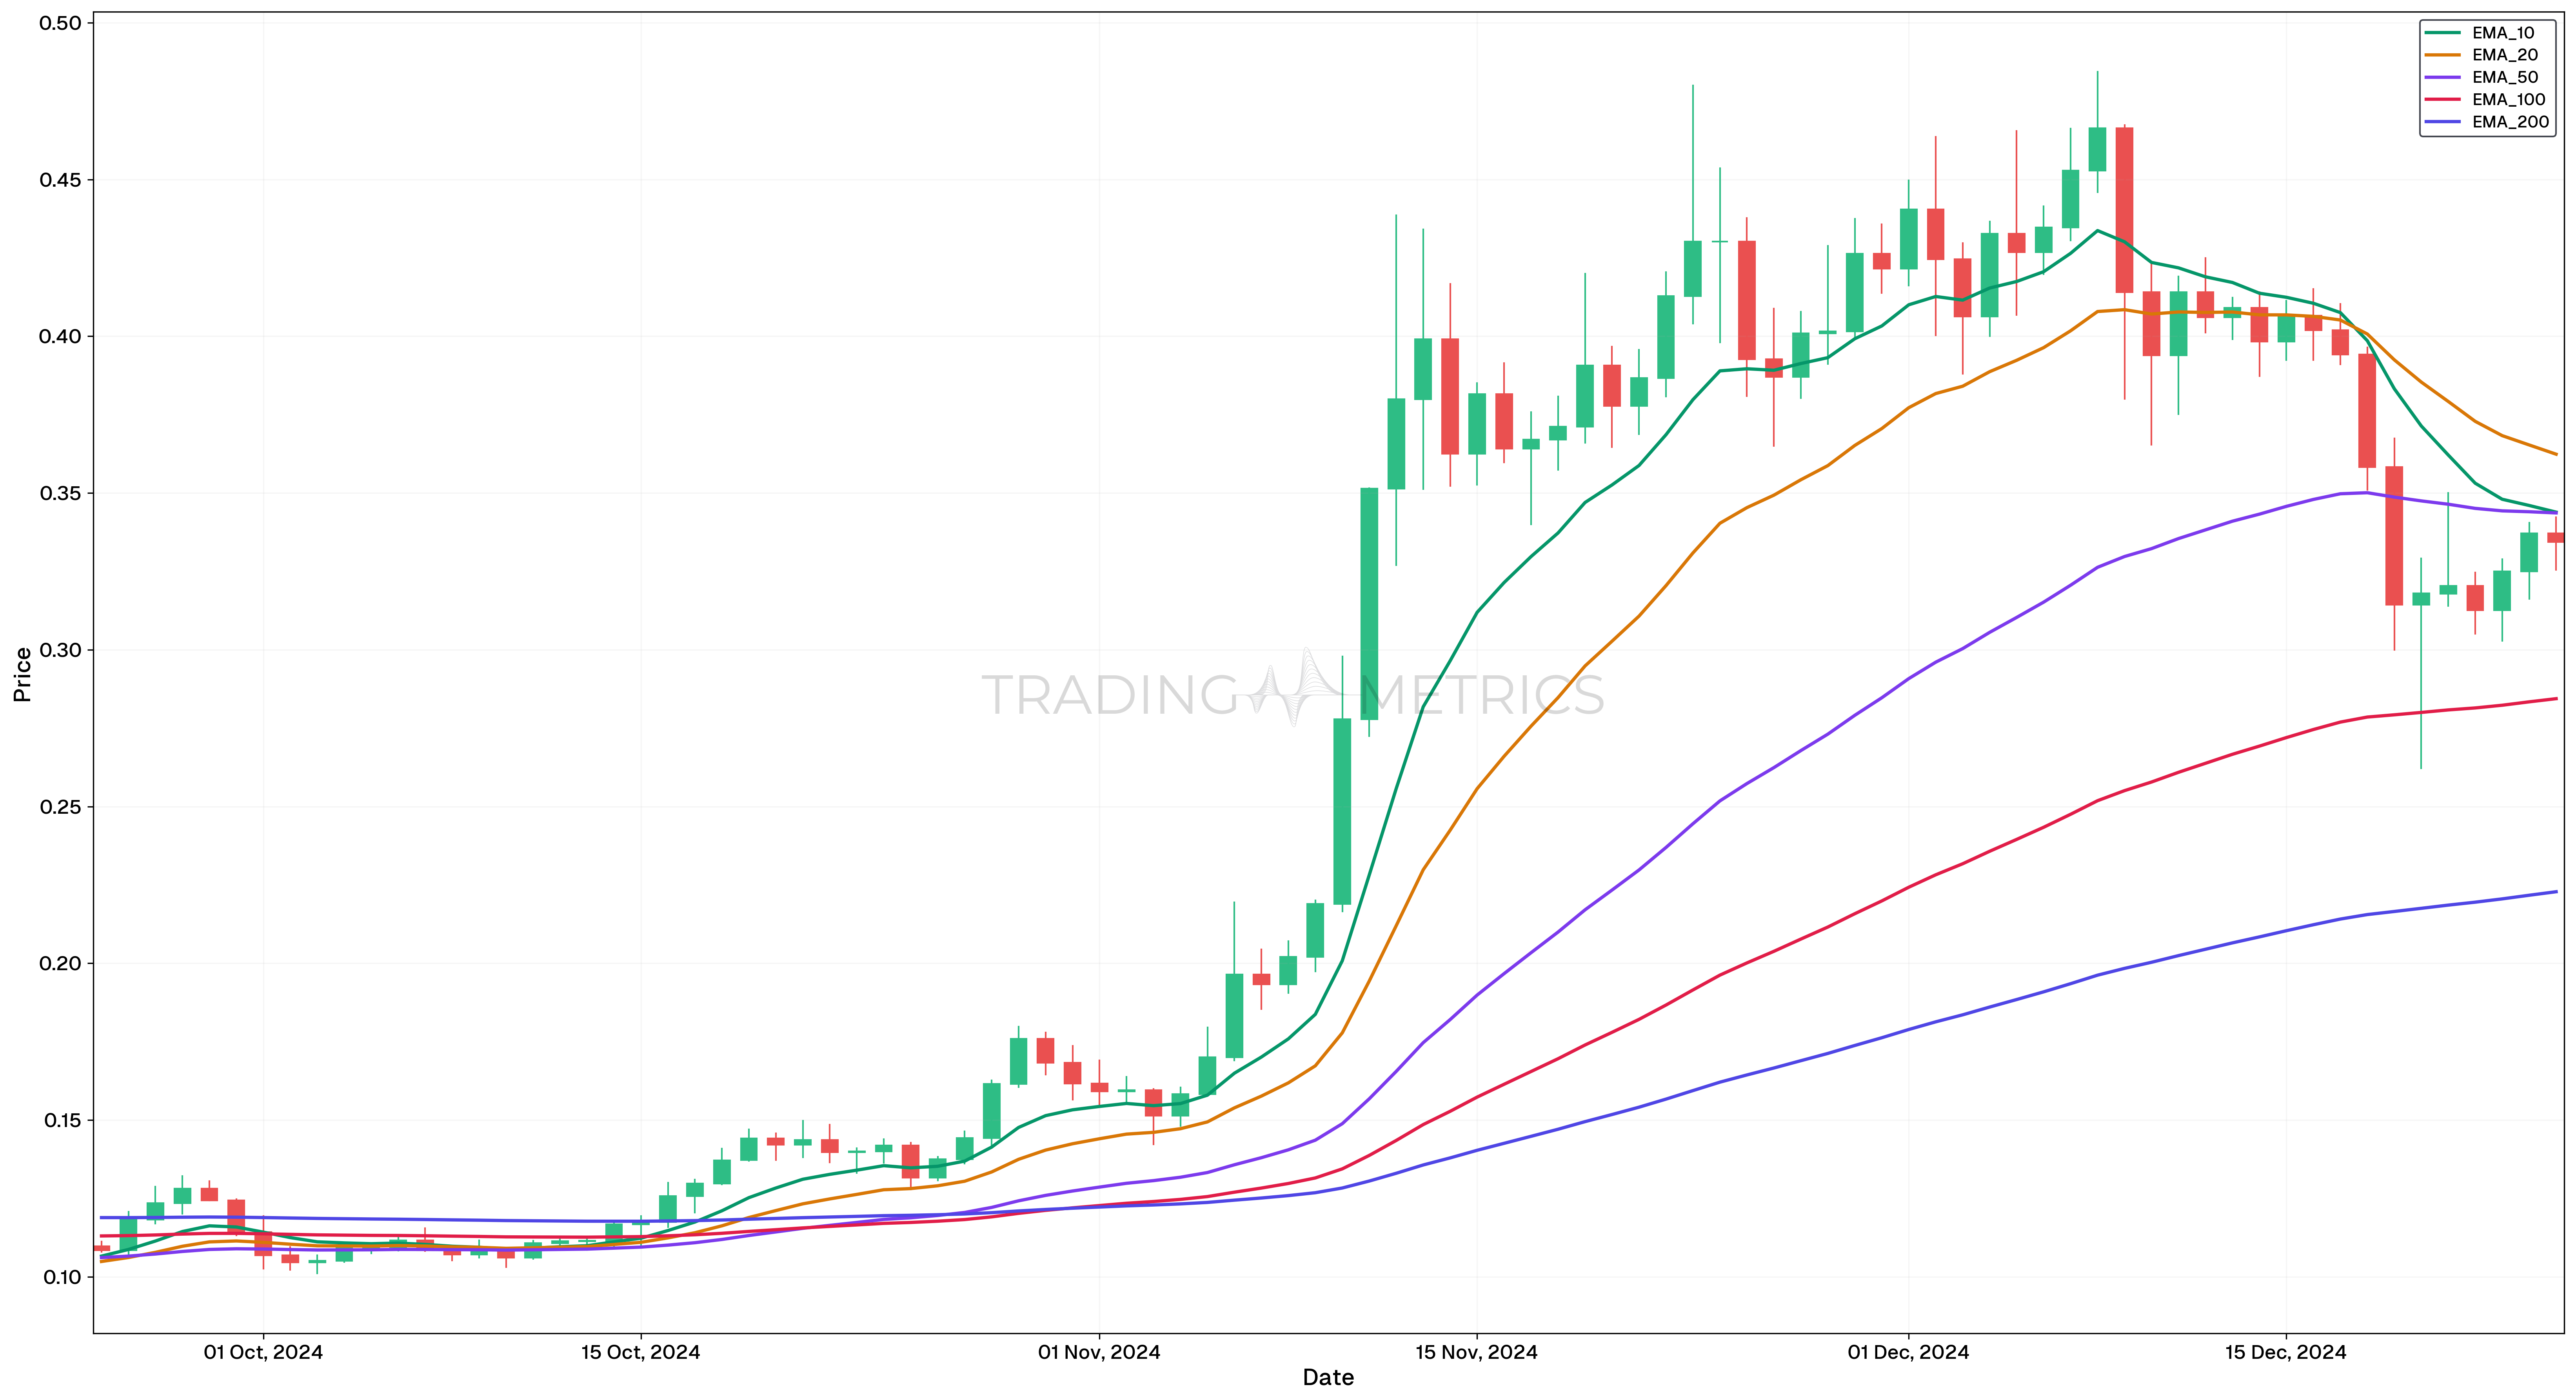
Quick Insight: Pair faster EMAs (like 9 or 20) with slower EMAs (like 50 or 200) to identify crossover signals for potential trend changes.
EMA as a Trend Filter
Its best to use the EMA(200) as a trend filter to determine trade direction:
- Price above EMA(200): Look for long (buy) trades.
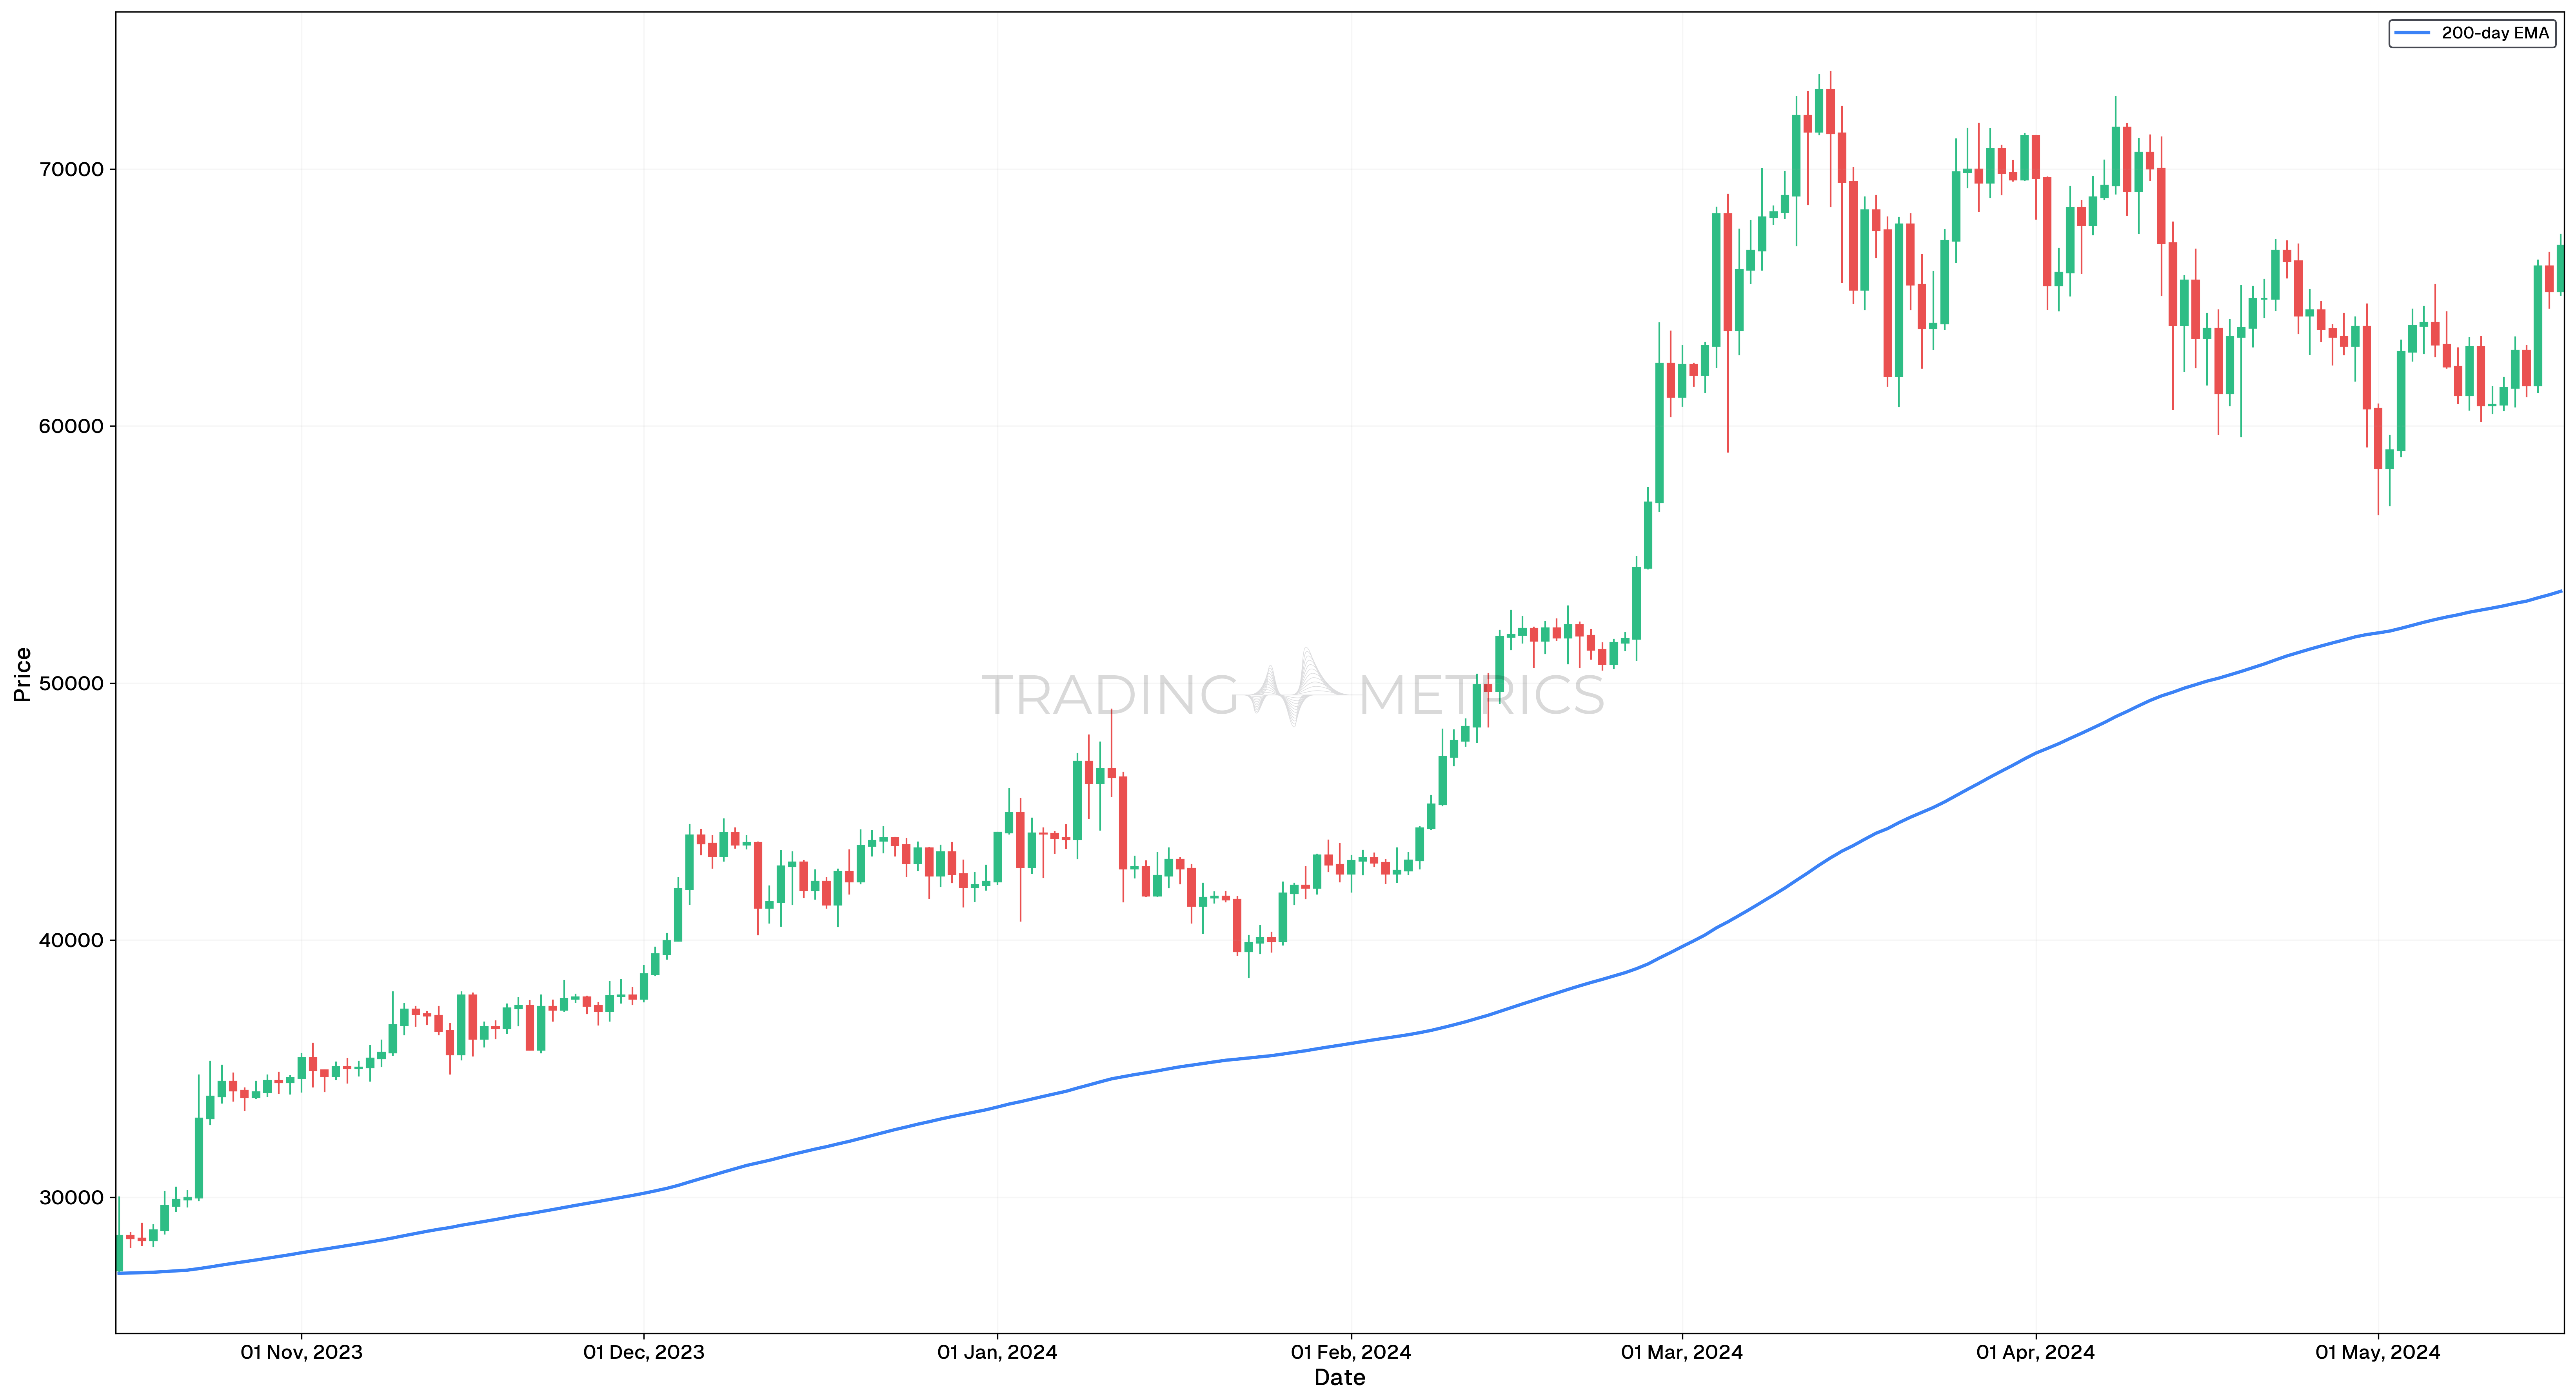
- Price below EMA(200): Look for short (sell) trades.
Combine this filter with additional strategies like candlestick patterns, oscillators, or other indicators for more accurate entries.
Key Takeaways
- The EMA(200) acts as a long-term trend indicator, filtering out trades against the prevailing trend.
- Combining EMA with candlestick patterns improves entry accuracy.
- Use proper risk management to protect capital and enhance profitability.
Combining EMA with Other Tools
For a more robust analysis, traders often combine the EMA with other technical indicators:
- Relative Strength Index (RSI): The RSI can confirm whether a market is overbought or oversold, enhancing the signals given by the EMA.
- MACD (Moving Average Convergence Divergence): The MACD, which uses EMA, helps identify momentum changes and potential crossovers.
- Bollinger Bands: These bands can be used alongside the EMA to gauge market volatility and potential breakouts.
Confirm with Other Indicators: Always use the EMA in conjunction with other indicators to validate signals.
Key Points
- Responsive to Price Changes: The Exponential Moving Average (EMA) gives more weight to recent prices, making it more responsive to current market conditions than the SMA.
- Trend Identification: EMA helps traders identify the direction of the trend, with short-term EMAs highlighting quick changes and long-term EMAs showing broader trends.
- Signal Generation: EMA crossovers, such as a short-term EMA crossing above a long-term EMA, generate popular bullish or bearish trading signals.
- Dynamic Support and Resistance: Price often reacts to EMAs, making them dynamic support and resistance levels for trade entries and exits.
- Preferred for Active Trading: Due to its sensitivity, EMA is widely used in fast-paced trading strategies like day trading or scalping.
- Lagging Indicator: Like all moving averages, the EMA is a lagging indicator and works best for trend confirmation rather than prediction.
- Combination with Other Indicators: Use EMA alongside indicators like MACD or RSI to validate signals and improve decision-making.
- Market Condition Adaptability: EMAs perform well in trending markets but may generate false signals in range-bound or choppy conditions.
- Customizable Periods: Adjust EMA periods to suit specific strategies, such as shorter periods for aggressive trades or longer ones for conservative approaches.
- Backtesting and Analysis: Incorporate EMA strategies into backtesting to evaluate performance across different market environments.
Conclusion
Utilizing the EMA, especially in combination with other indicators like RSI, can provide traders with clear and actionable signals. By analyzing crossover points and confirming with Momentum Indicators, traders can make more informed decisions, potentially increasing their success rate. Keep in mind that no single strategy guarantees profits, so always use EMA as part of a broader trading plan and consider multiple time frames and additional technical indicators for confirmation.
Frequently Asked Questions
Quick answers based on this page's topic.
The EMA places more mathematical weight on the most recent price data, making it more responsive to new information. This reduced lag allows traders to identify trend changes faster than the Simple Moving Average (SMA), which treats all data points equally.
This 'dual EMA' strategy helps identify momentum shifts. When the 9-period EMA crosses above the 21-period EMA, it signals increasing bullish momentum. Conversely, a cross below suggests a bearish shift. These averages also act as dynamic support levels during strong trends.
The 200-period EMA is a critical 'line in the sand' for institutional traders. Price staying above the 200 EMA indicates a long-term bull market, while price below it suggests a long-term bear market, often dictating the overall bias for swing traders.