RSI: How to Trade Overbought and Oversold Extremes
The Relative Strength Index (RSI) is a momentum oscillator that measures the speed and change of price movements. Developed by J. Welles Wilder Jr., it is primarily used to identify overbought or oversold conditions in a market. The RSI oscillates between 0 and 100. Traditionally, an asset is considered overbought when the RSI is above 70 and oversold when it is below 30.
Indicators like RSI don't predict - they guide. The skill lies in your interpretation, not blind obedience.
- Anonymous
How to Use Relative Strength Index (RSI)?
Using the RSI involves interpreting the level at which it is currently situated:
- Above 70: This suggests that the asset may be overbought, and a price correction or pullback could be on the horizon.
- Below 30: This indicates that the asset may be oversold, and a price bounce or rally might be imminent.
- Between 30 and 70: This range generally indicates a neutral market, where the price isn’t overly stretched in either direction.
Traders often look for divergence signals as well. A bullish divergence occurs when the price makes a new low but the RSI makes a higher low, suggesting a potential upward reversal. Conversely, a bearish divergence happens when the price makes a new high but the RSI makes a lower high, indicating a possible downward reversal.
Quick Tip: RSI values above 70 typically indicate overbought conditions, while values below 30 suggest oversold - use these levels to anticipate potential reversals.
How to Calculate RSI?
Calculating the RSI involves a few steps. Here’s the formula:
Where:
Step-by-Step Calculation Example:
Calculate the Average Gain and Average Loss
Assume you have the following closing prices over 15 days: 44, 45, 44, 46, 47, 48, 49, 48, 47, 48, 49, 50, 51, 50, 49.
Calculate the daily changes: 1, -1, 2, 1, 1, 1, -1, -1, 1, 1, 1, 1, -1, -1.
Separate the gains and losses:
- Gains: 1, 2, 1, 1, 1, 1, 1, 1, 1.
- Losses: -1, -1, -1, -1, -1.
Average Gain:
Average Loss:
Calculate the Relative Strength (RS)
Calculate the RSI
Thus, the RSI(14) for this period is 66.67, indicating neither overbought nor oversold conditions.
Pro Insight: Don’t blindly trade RSI overbought or oversold signals - wait for price action confirmation to avoid false entries.
Importance of Relative Strength Index (RSI) in Trading
RSI is a important tool for traders because it provides insights into market conditions that might not be immediately evident from price movements alone. By identifying overbought or oversold conditions, RSI helps traders make informed decisions about entry and exit points, reducing the risk of buying at market peaks or selling at market troughs.
RSI Variations and Modifications: Enhancing Your Trading Arsenal
Imagine being able to fine-tune a powerful tool to suit your exact needs, much like a master chef perfects a recipe. This is the beauty of RSI variations and modifications. The Relative Strength Index (RSI) is a versatile indicator, and with a few tweaks, you can tailor it to match your trading style and market conditions perfectly.
The Standard RSI(14): The Classic
The RSI period of 14 is like the little black dress of technical indicators - classic, reliable, and widely used. This default setting calculates the average gains and losses over the last 14 periods, providing a balanced view of momentum. However, just as fashion evolves, so can your approach to using RSI.
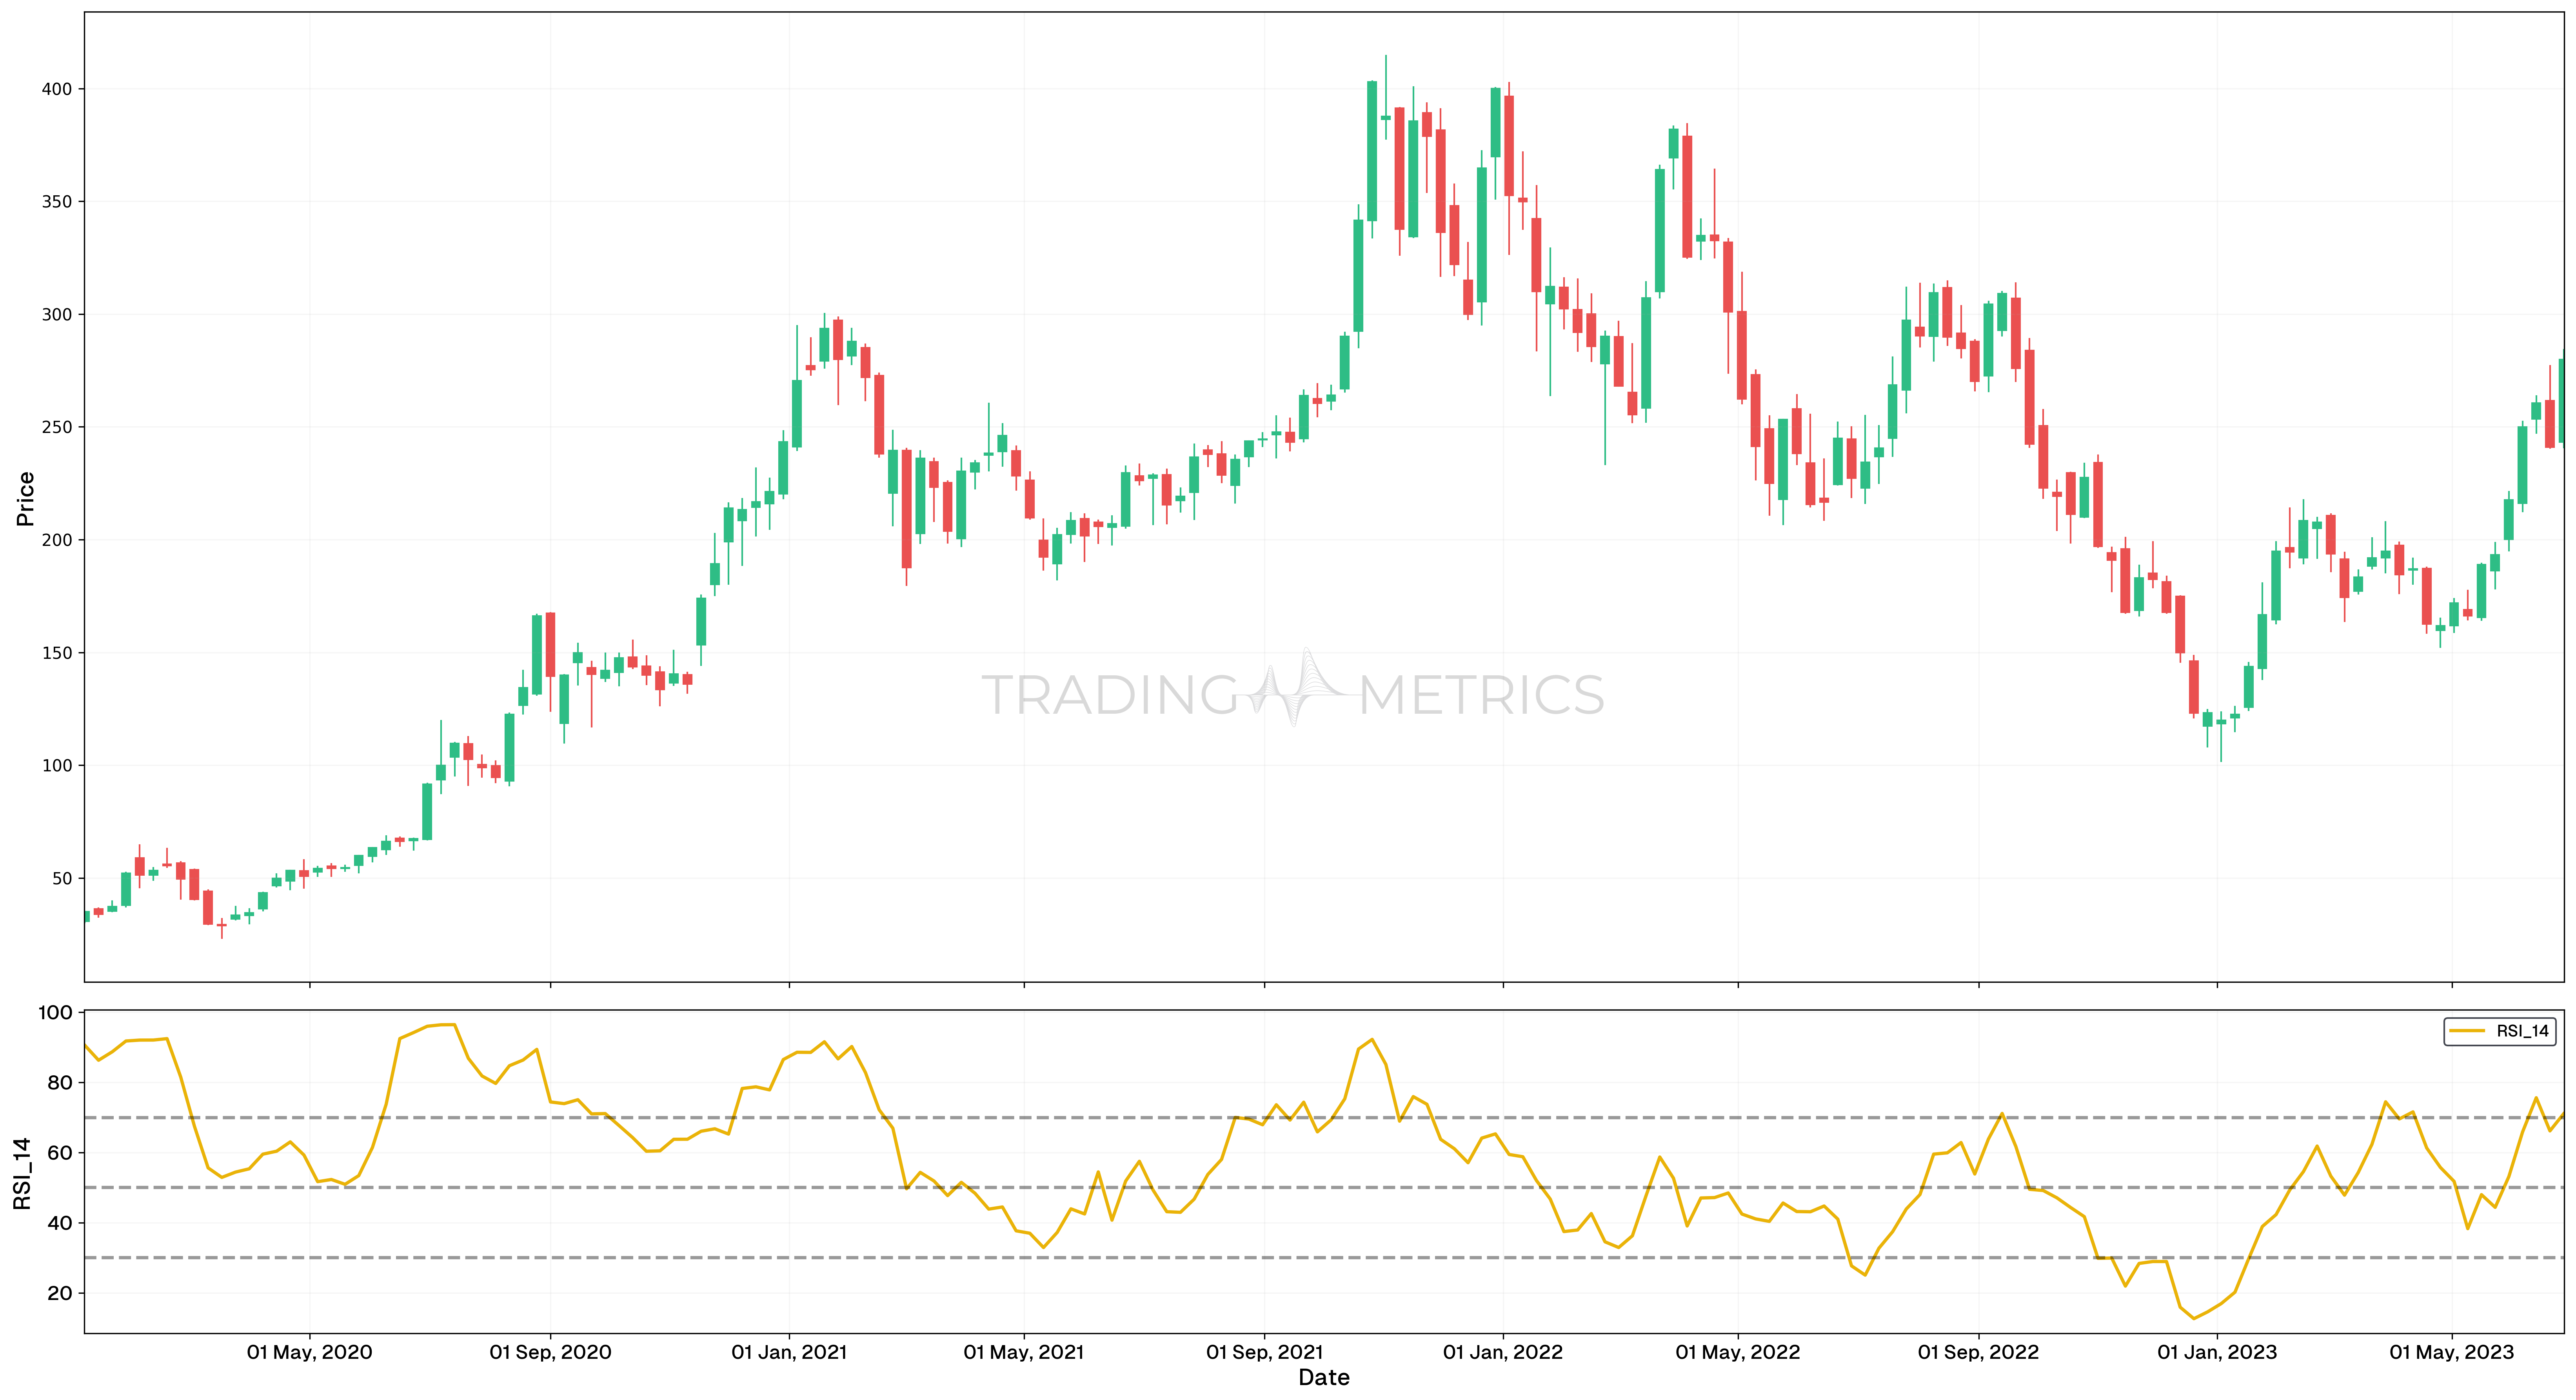
- Widely Accepted: As the default setting, RSI(14) is understood and used by most traders, ensuring consistency in analysis.
- Balanced View: It provides a balanced measure of momentum over a medium-term period, suitable for various market conditions.
- Moderate Sensitivity: It may not be responsive enough for traders looking for short-term signals or too noisy for those focusing on long-term trends.
Short-Term RSI(7): The Speed Demon
If you’re a day trader who thrives on fast-paced action, the RSI(7) might be your best friend. By shortening the period to seven, the RSI becomes more sensitive to recent price movements. This can help you catch shorter-term overbought or oversold conditions, giving you a head start in the race to capitalize on quick market shifts. Imagine you’re watching Bitcoin, and the RSI(7) dips below 30. This could signal a rapid buying opportunity before the rest of the market catches on.
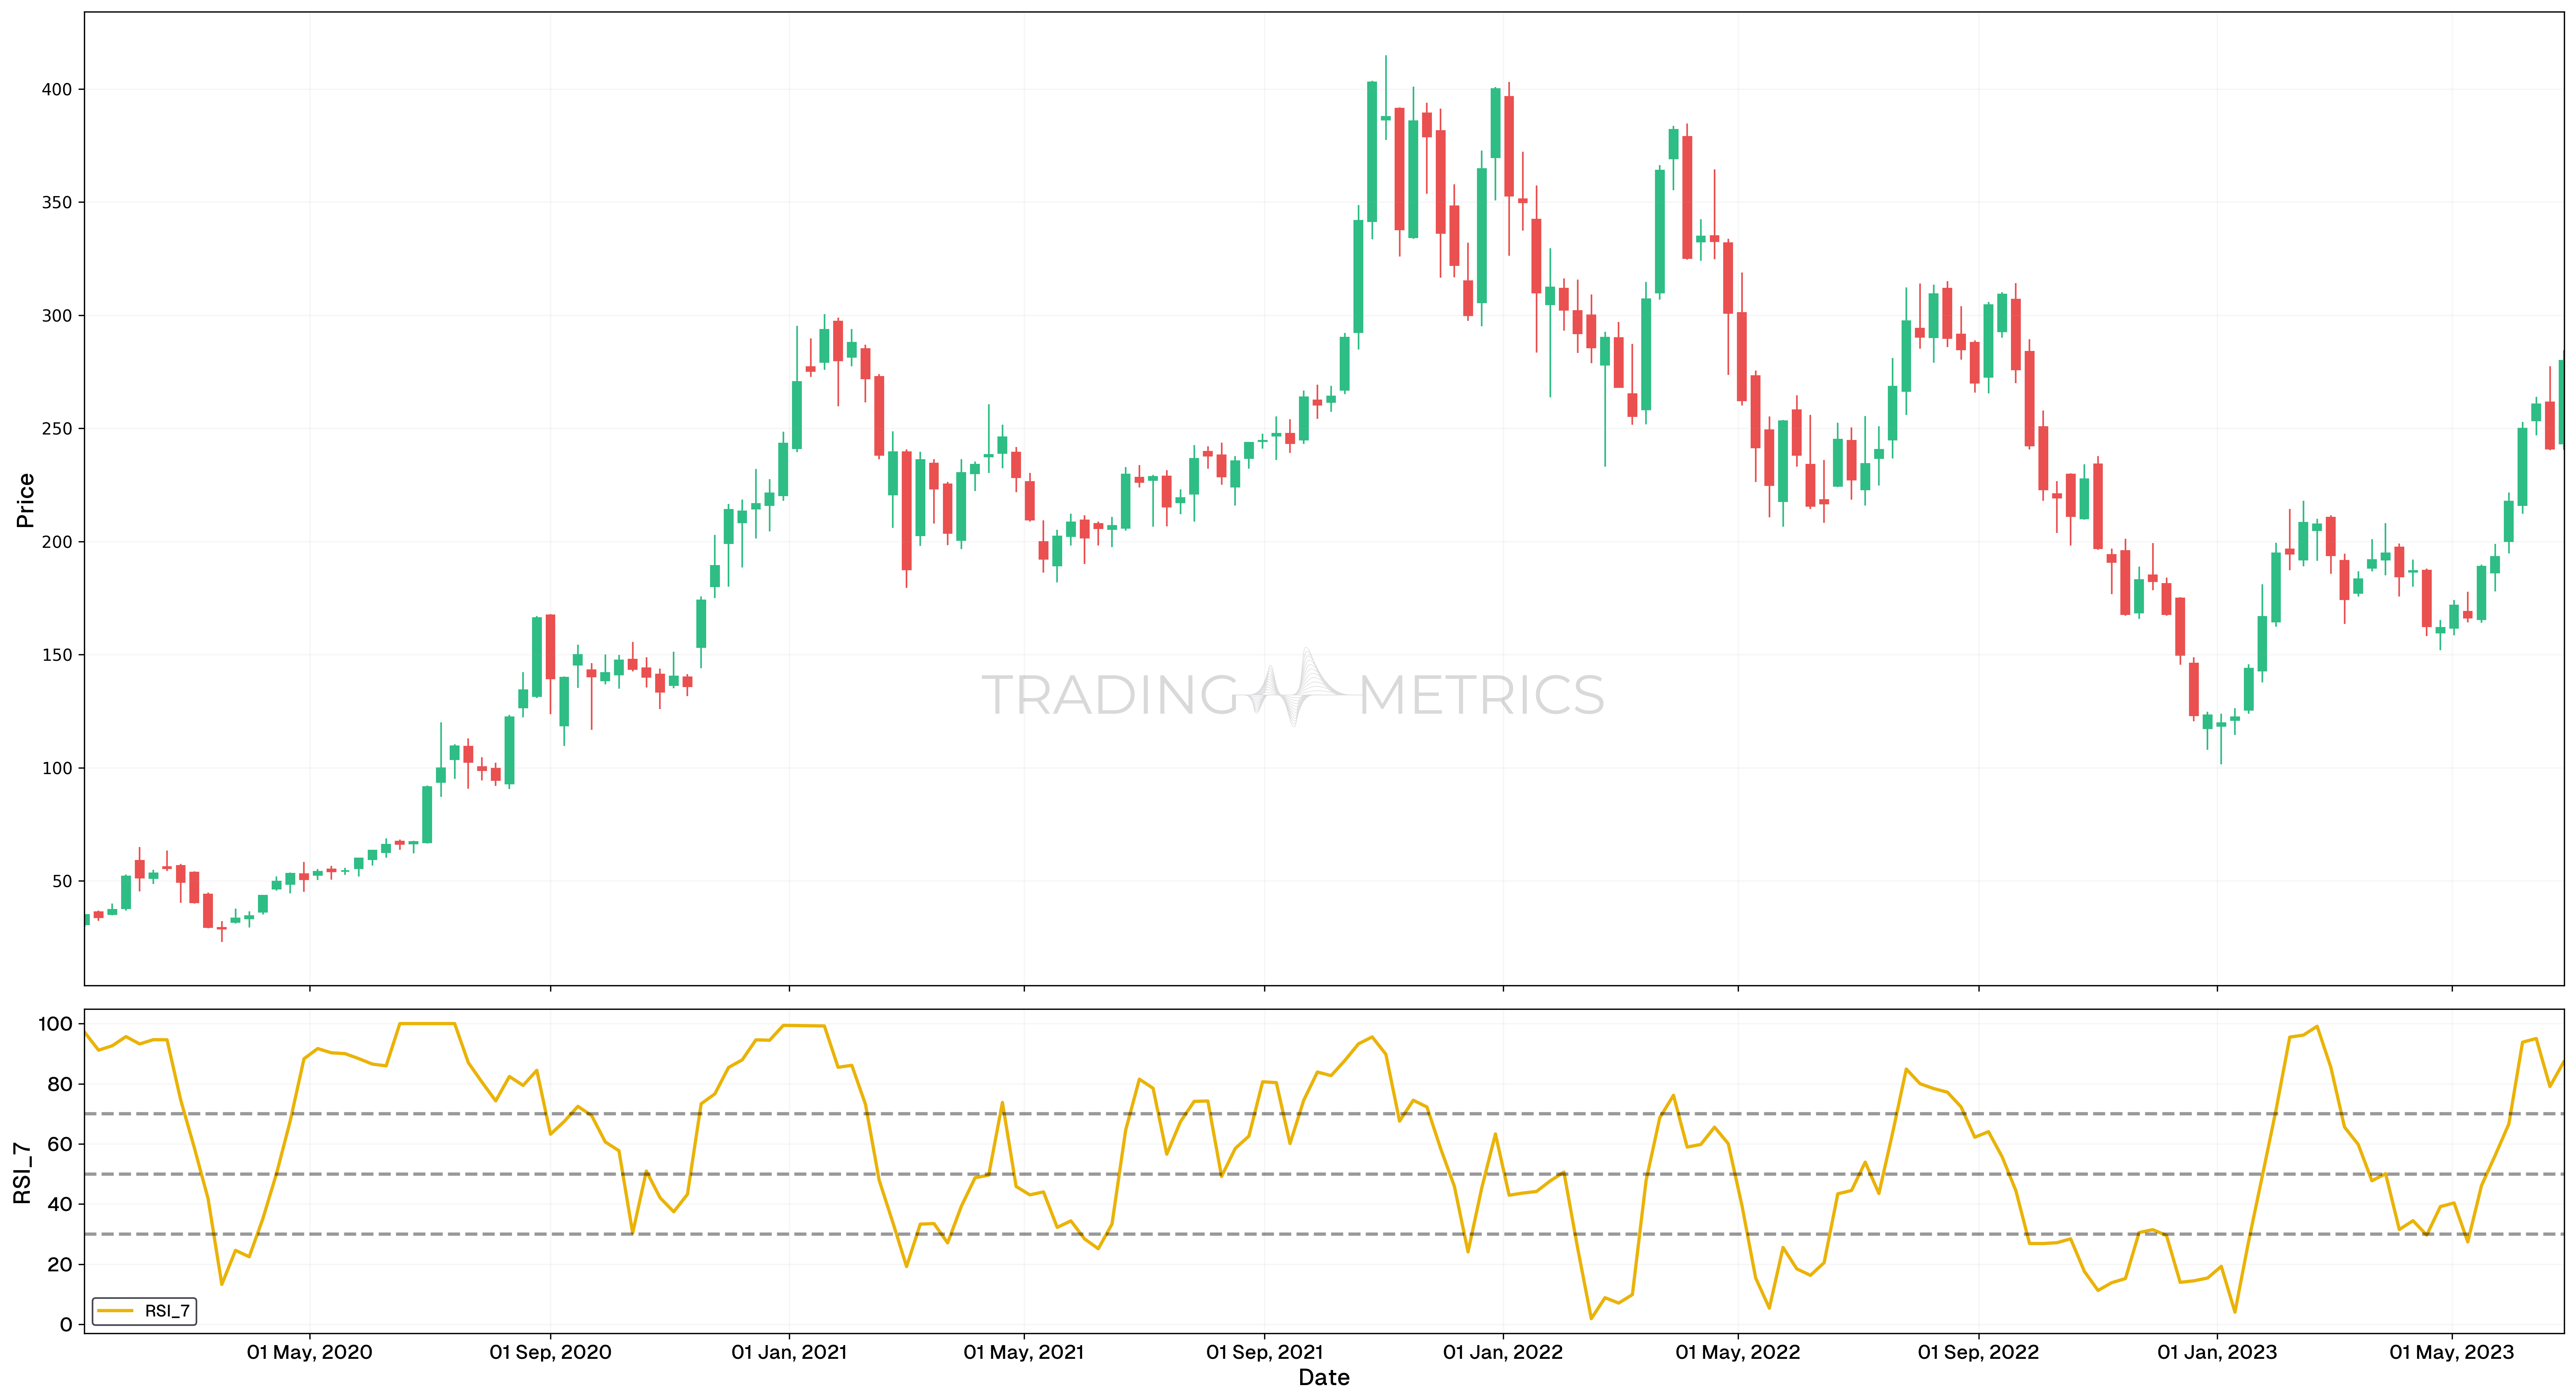
- Increased Sensitivity: Faster response to price changes, ideal for capturing quick trading opportunities.
- Early Signals: Potential to provide early indications of market reversals or momentum shifts.
- Higher False Signals: Increased sensitivity can lead to more false signals, requiring traders to be more discerning.
- Less Reliable for Long-Term Trades: Not suitable for traders looking at longer time frames as it can be too volatile.
Long-Term RSI(21): The Smooth Operator
On the other hand, if you’re a more patient trader, perhaps looking for those solid swing trade opportunities, extending the period to 21 can smooth out the RSI, filtering out some of the market noise. This approach helps you focus on more substantial trends and avoid the whiplash of minor price fluctuations. Picture yourself analyzing Apple Inc., and the RSI(21) steadily rises above 70. This might indicate a more reliable signal of overbought conditions, prompting a strategic sell decision.
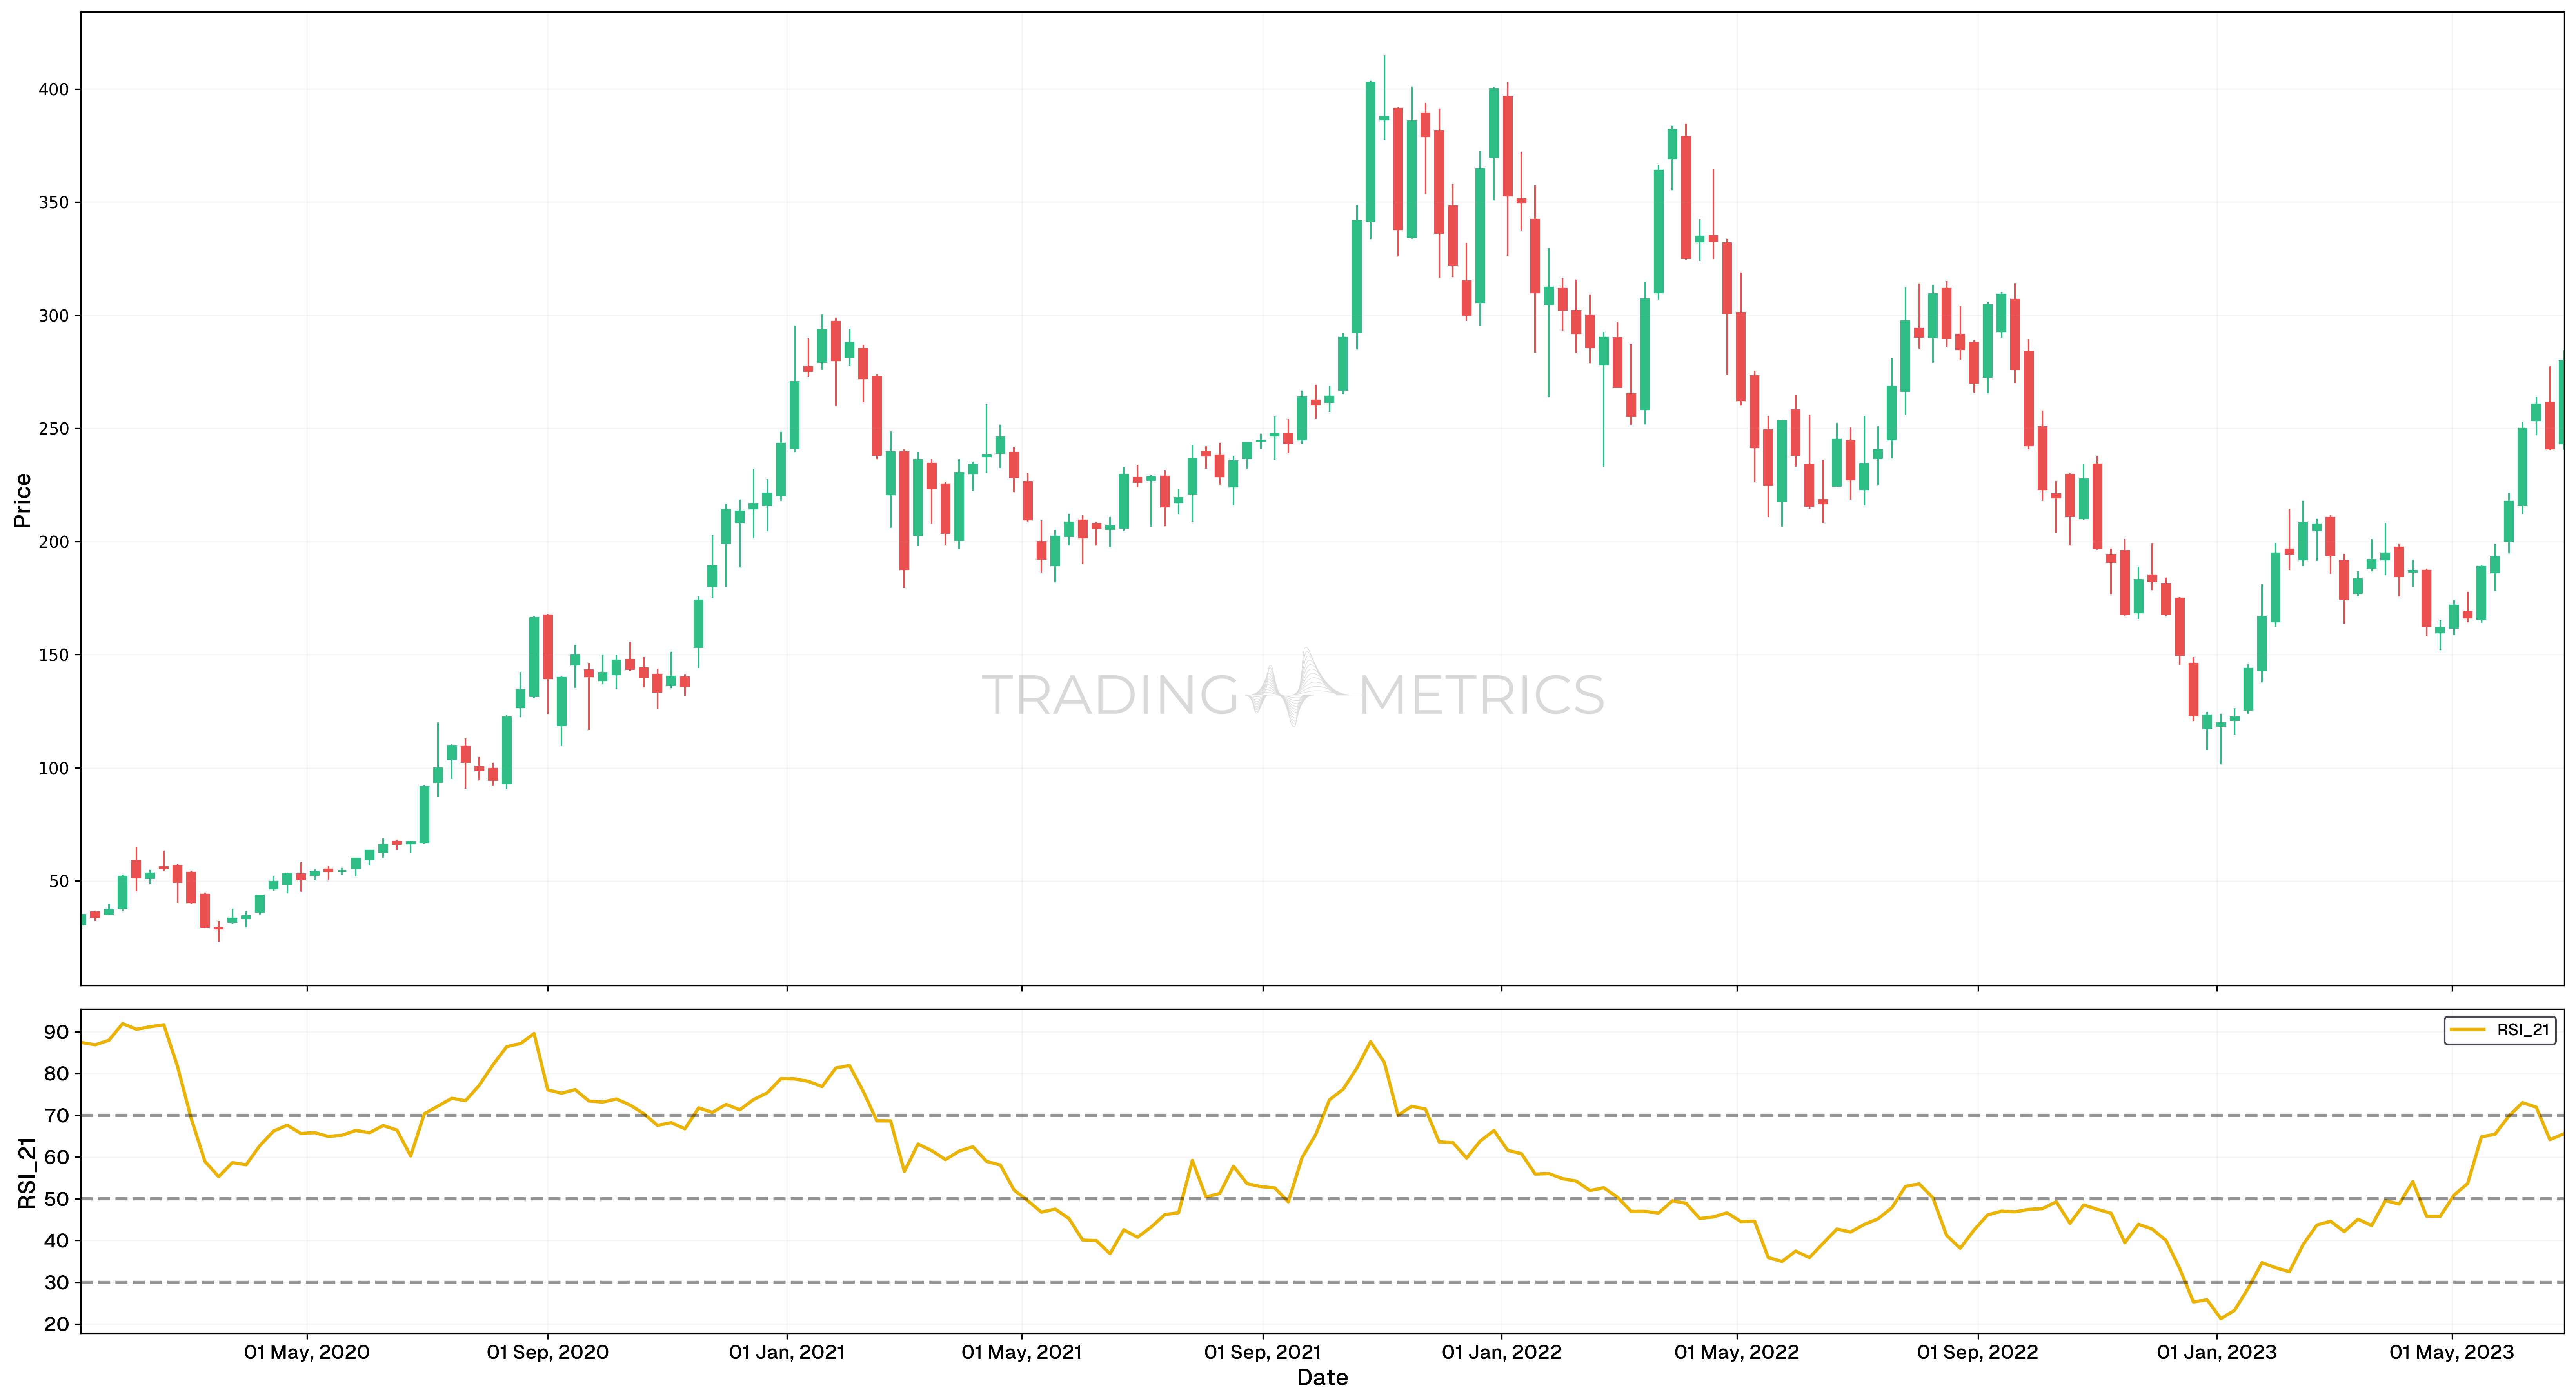
- Reduced Noise: Smoother signals that filter out short-term volatility, making it easier to identify genuine trends.
- More Reliable for Long-Term Trades: Better suited for swing trading and long-term investment strategies.
- Delayed Signals: Slower to respond to price changes, which can result in late entry or exit points.
- Less Useful for Day Trading: Not ideal for short-term traders who need quick signals.
Custom RSI Settings: Tailoring to Your Strategy
Beyond these standard modifications, the real magic happens when you start experimenting with custom settings. Every trader has a unique style, risk tolerance, and market preference. By adjusting the RSI period to fit your specific trading strategy, you can optimize your signals and improve your overall performance.
For instance, if you’re trading volatile assets like penny stocks or certain cryptocurrencies, you might find that an RSI(10) gives you the right balance between sensitivity and reliability. Or, if you’re focusing on long-term investments, an RSI(30) could help you avoid getting spooked by short-term price swings.

- Personalization: Tailors the indicator to your specific trading needs and market conditions.
- Optimized Signals: Can improve the accuracy and relevance of the signals you receive.
- Trial and Error: Requires experimentation and backtesting to find the optimal settings.
- Not Applicable: No universal drawbacks as it depends on individual adjustments and preferences.
Conclusion: The Art of RSI Mastery
By exploring and mastering these variations and modifications, you transform the RSI from a simple indicator into a finely tuned instrument, capable of providing deeper insights and more accurate signals. Whether you’re speeding through day trades with RSI(7), gliding through swings with RSI(21), or digging deep with StochRSI, the key is to experiment and find what works best for you.
So, go ahead, tweak that RSI setting. Like a master chef adjusting the spices, you’ll find the perfect blend that makes your trading strategy not just effective, but extraordinary.
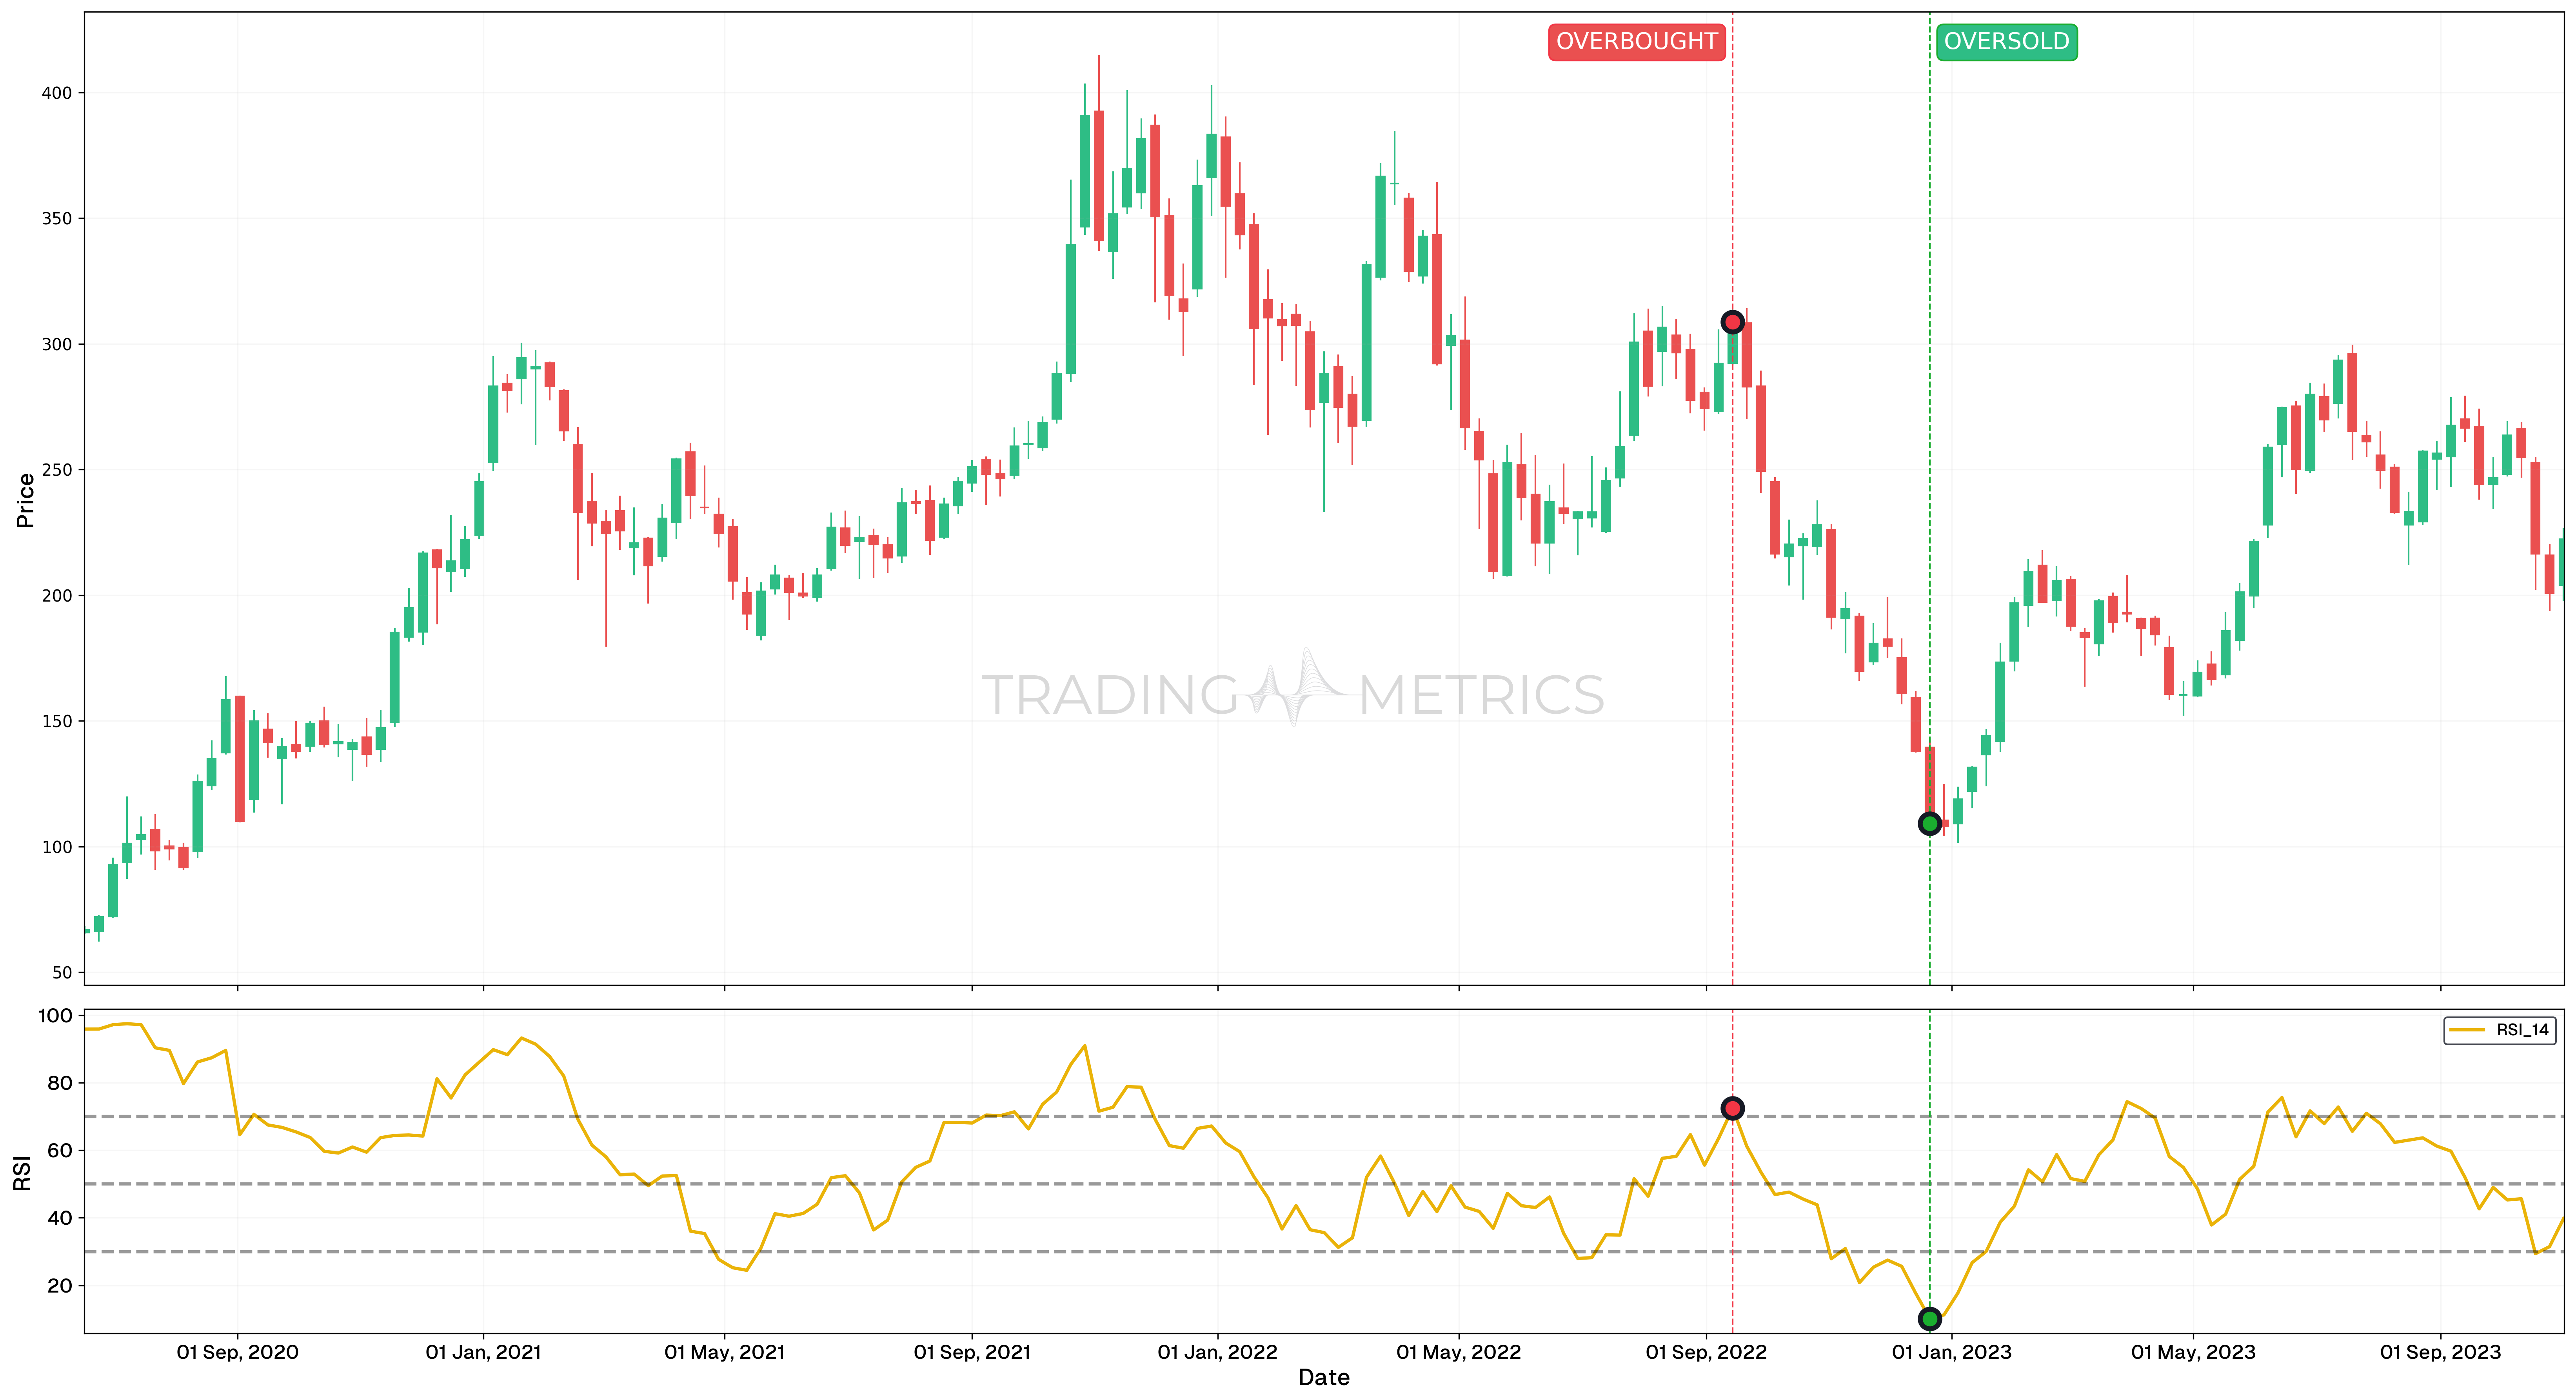
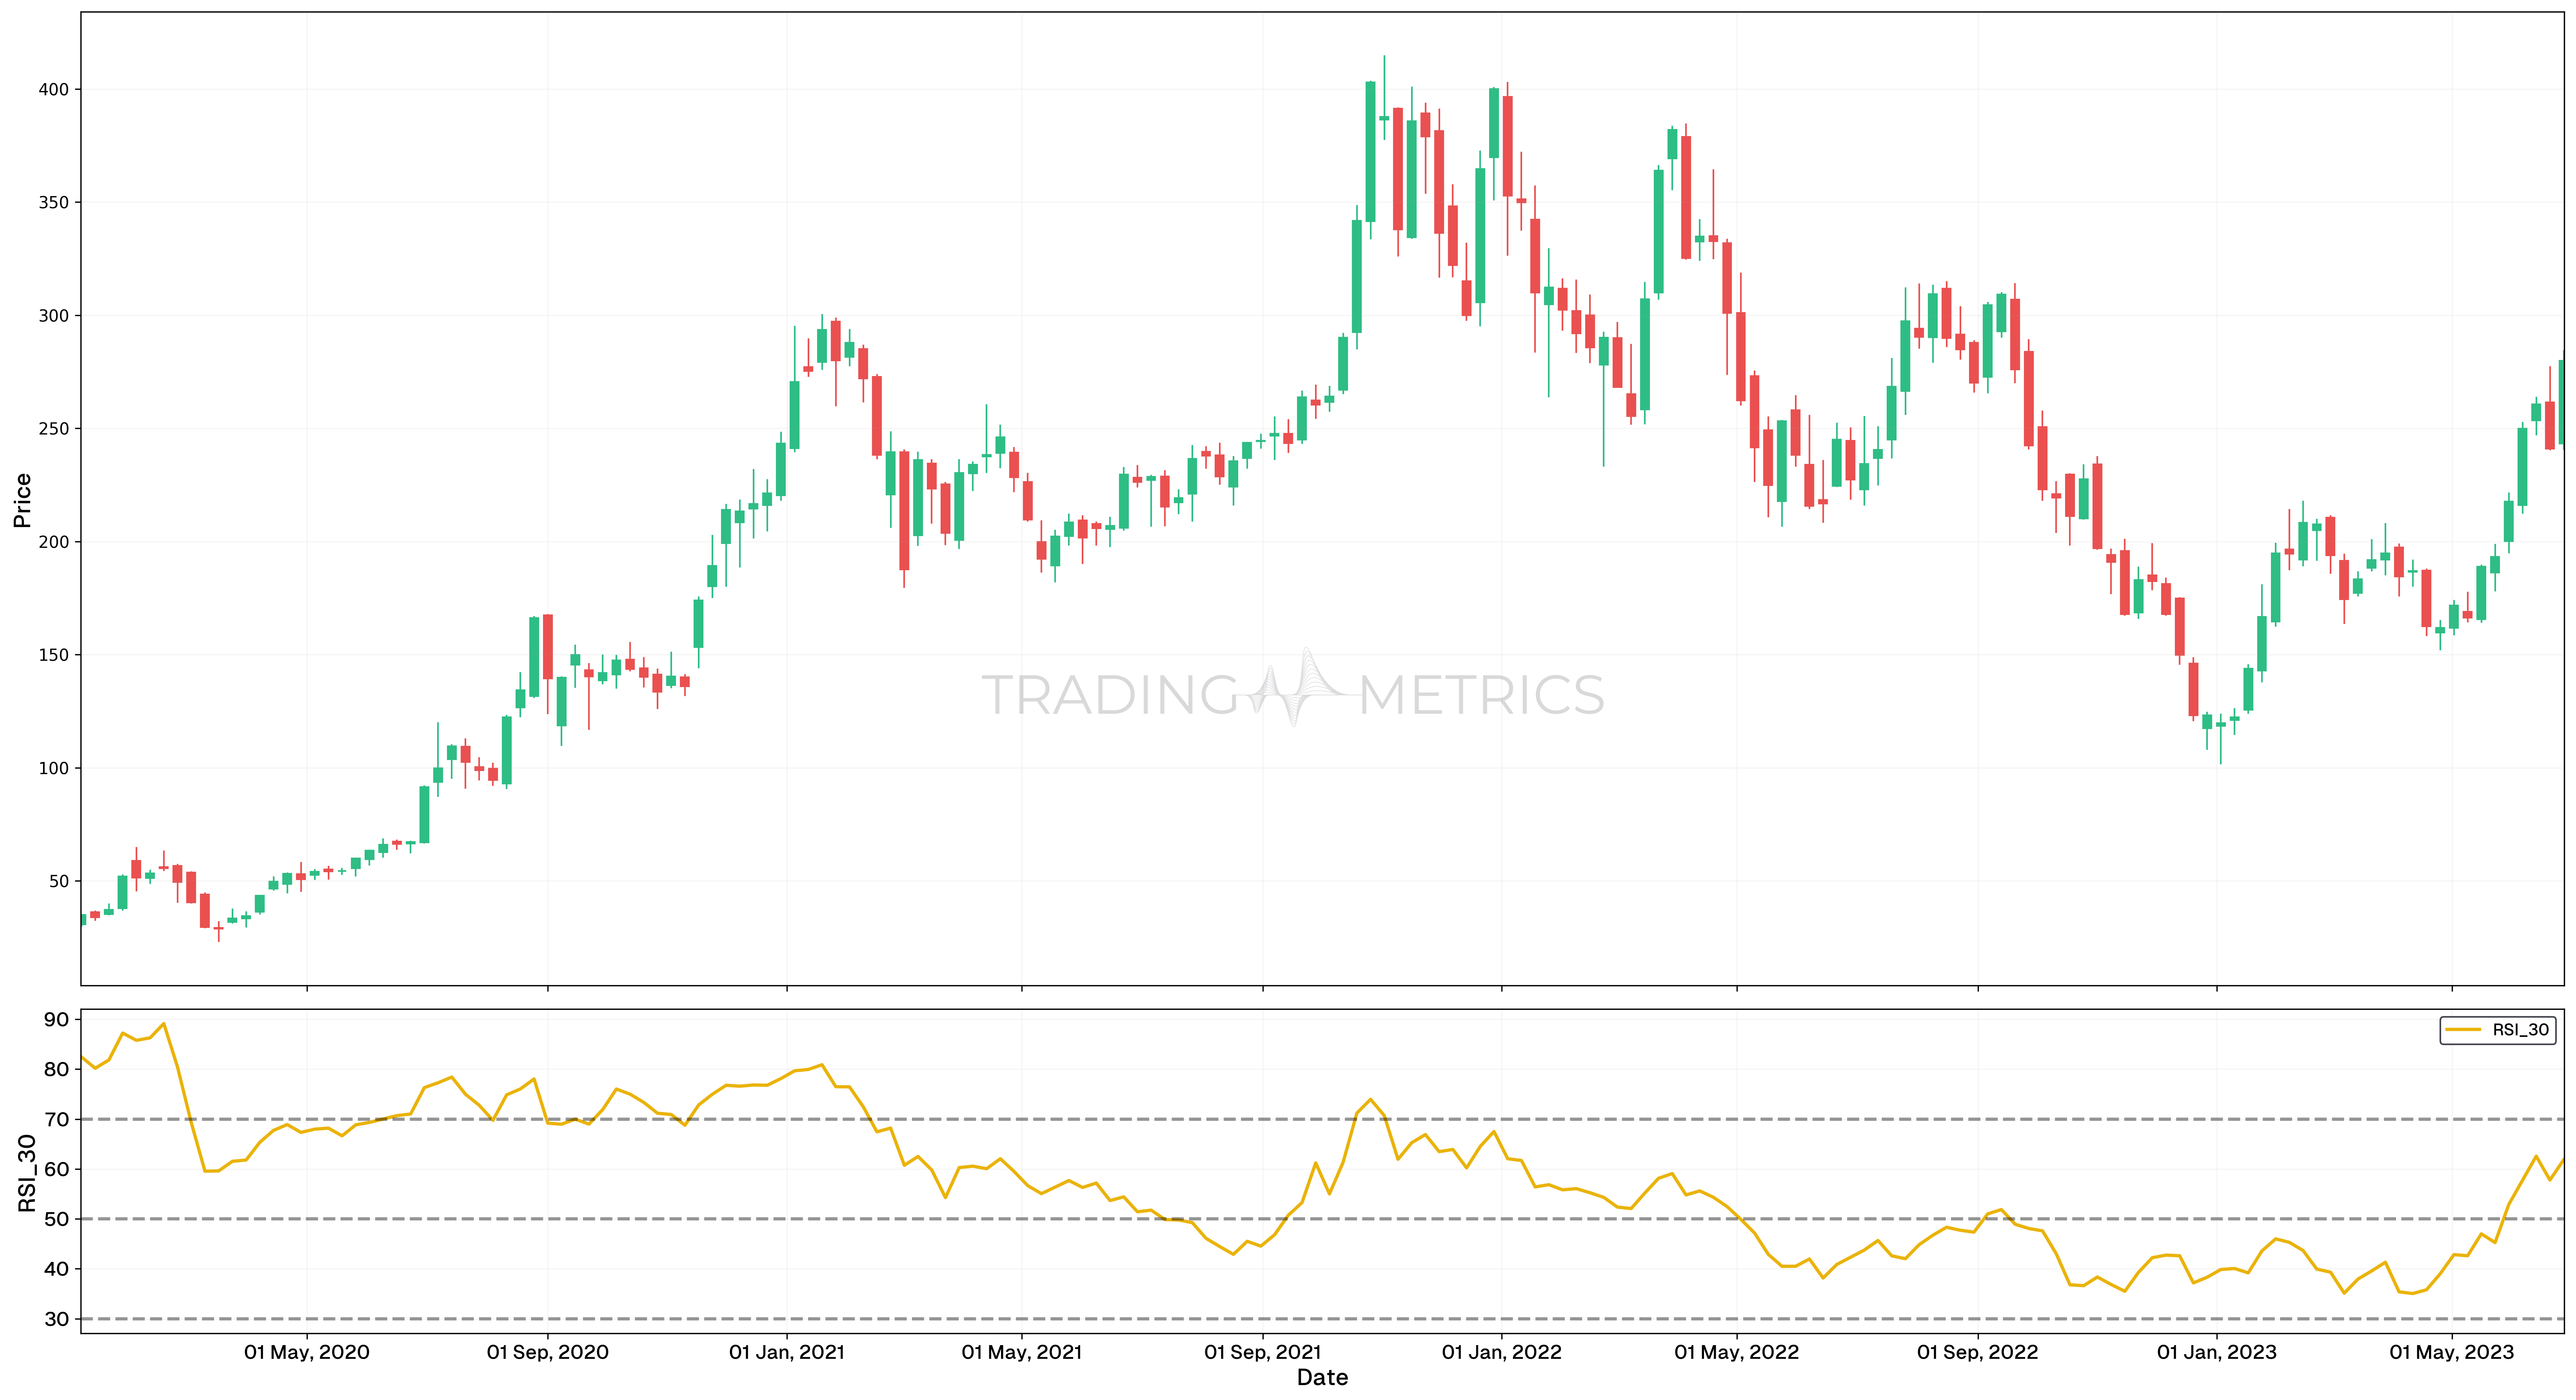
Overbought Condition vs Oversold Condition
Let’s consider the stock of Tesla (TSLA). Below is a chart showing the price movement of TSLA over six months, along with the RSI.
Analysis
- On September 14th, 2022, TSLA’s RSI rose above 70 (72.47), signaling an Overbought condition. This indicated that the stock price might be due for a correction. Shortly after, TSLA experienced a price dip, validating the signal.
- On December 21st, 2022, TSLA’s RSI fell below 30 (10.13), suggesting an Oversold condition. While the price continued to decline initially, TSLA eventually rebounded, aligning with the RSI signal over time.
Trade Setup
- Overbought Entry: Traders could have considered exiting or shorting TSLA on September 14th, 2022, when the RSI surpassed 70, as Overbought conditions often precede price corrections.
- Oversold Entry: On December 21st, 2022, traders seeking a buying opportunity might have entered TSLA after the RSI fell below 30, reflecting Oversold conditions.
- Exit: For the Overbought scenario, the position could have been exited as the price dipped after the RSI crossed above 70. In the Oversold scenario, the position could have been closed after TSLA’s price rebounded from the lows, confirming the reversal.
- Outcome: These trades demonstrate the effectiveness of monitoring RSI signals. However, traders should exercise caution, as Overbought or Oversold conditions do not guarantee immediate reversals, emphasizing the importance of incorporating additional confirmations and aligning strategies with individual risk tolerance.
Divergence Between RSI and Price
Another powerful RSI strategy involves identifying divergence. Divergence occurs when the price moves in the opposite direction of the RSI. Let’s analyze Bitcoin (BTC) cryptocurrency for this example.
Learn the full divergence taxonomy. See Full Divergence Guide.
Bullish Divergence
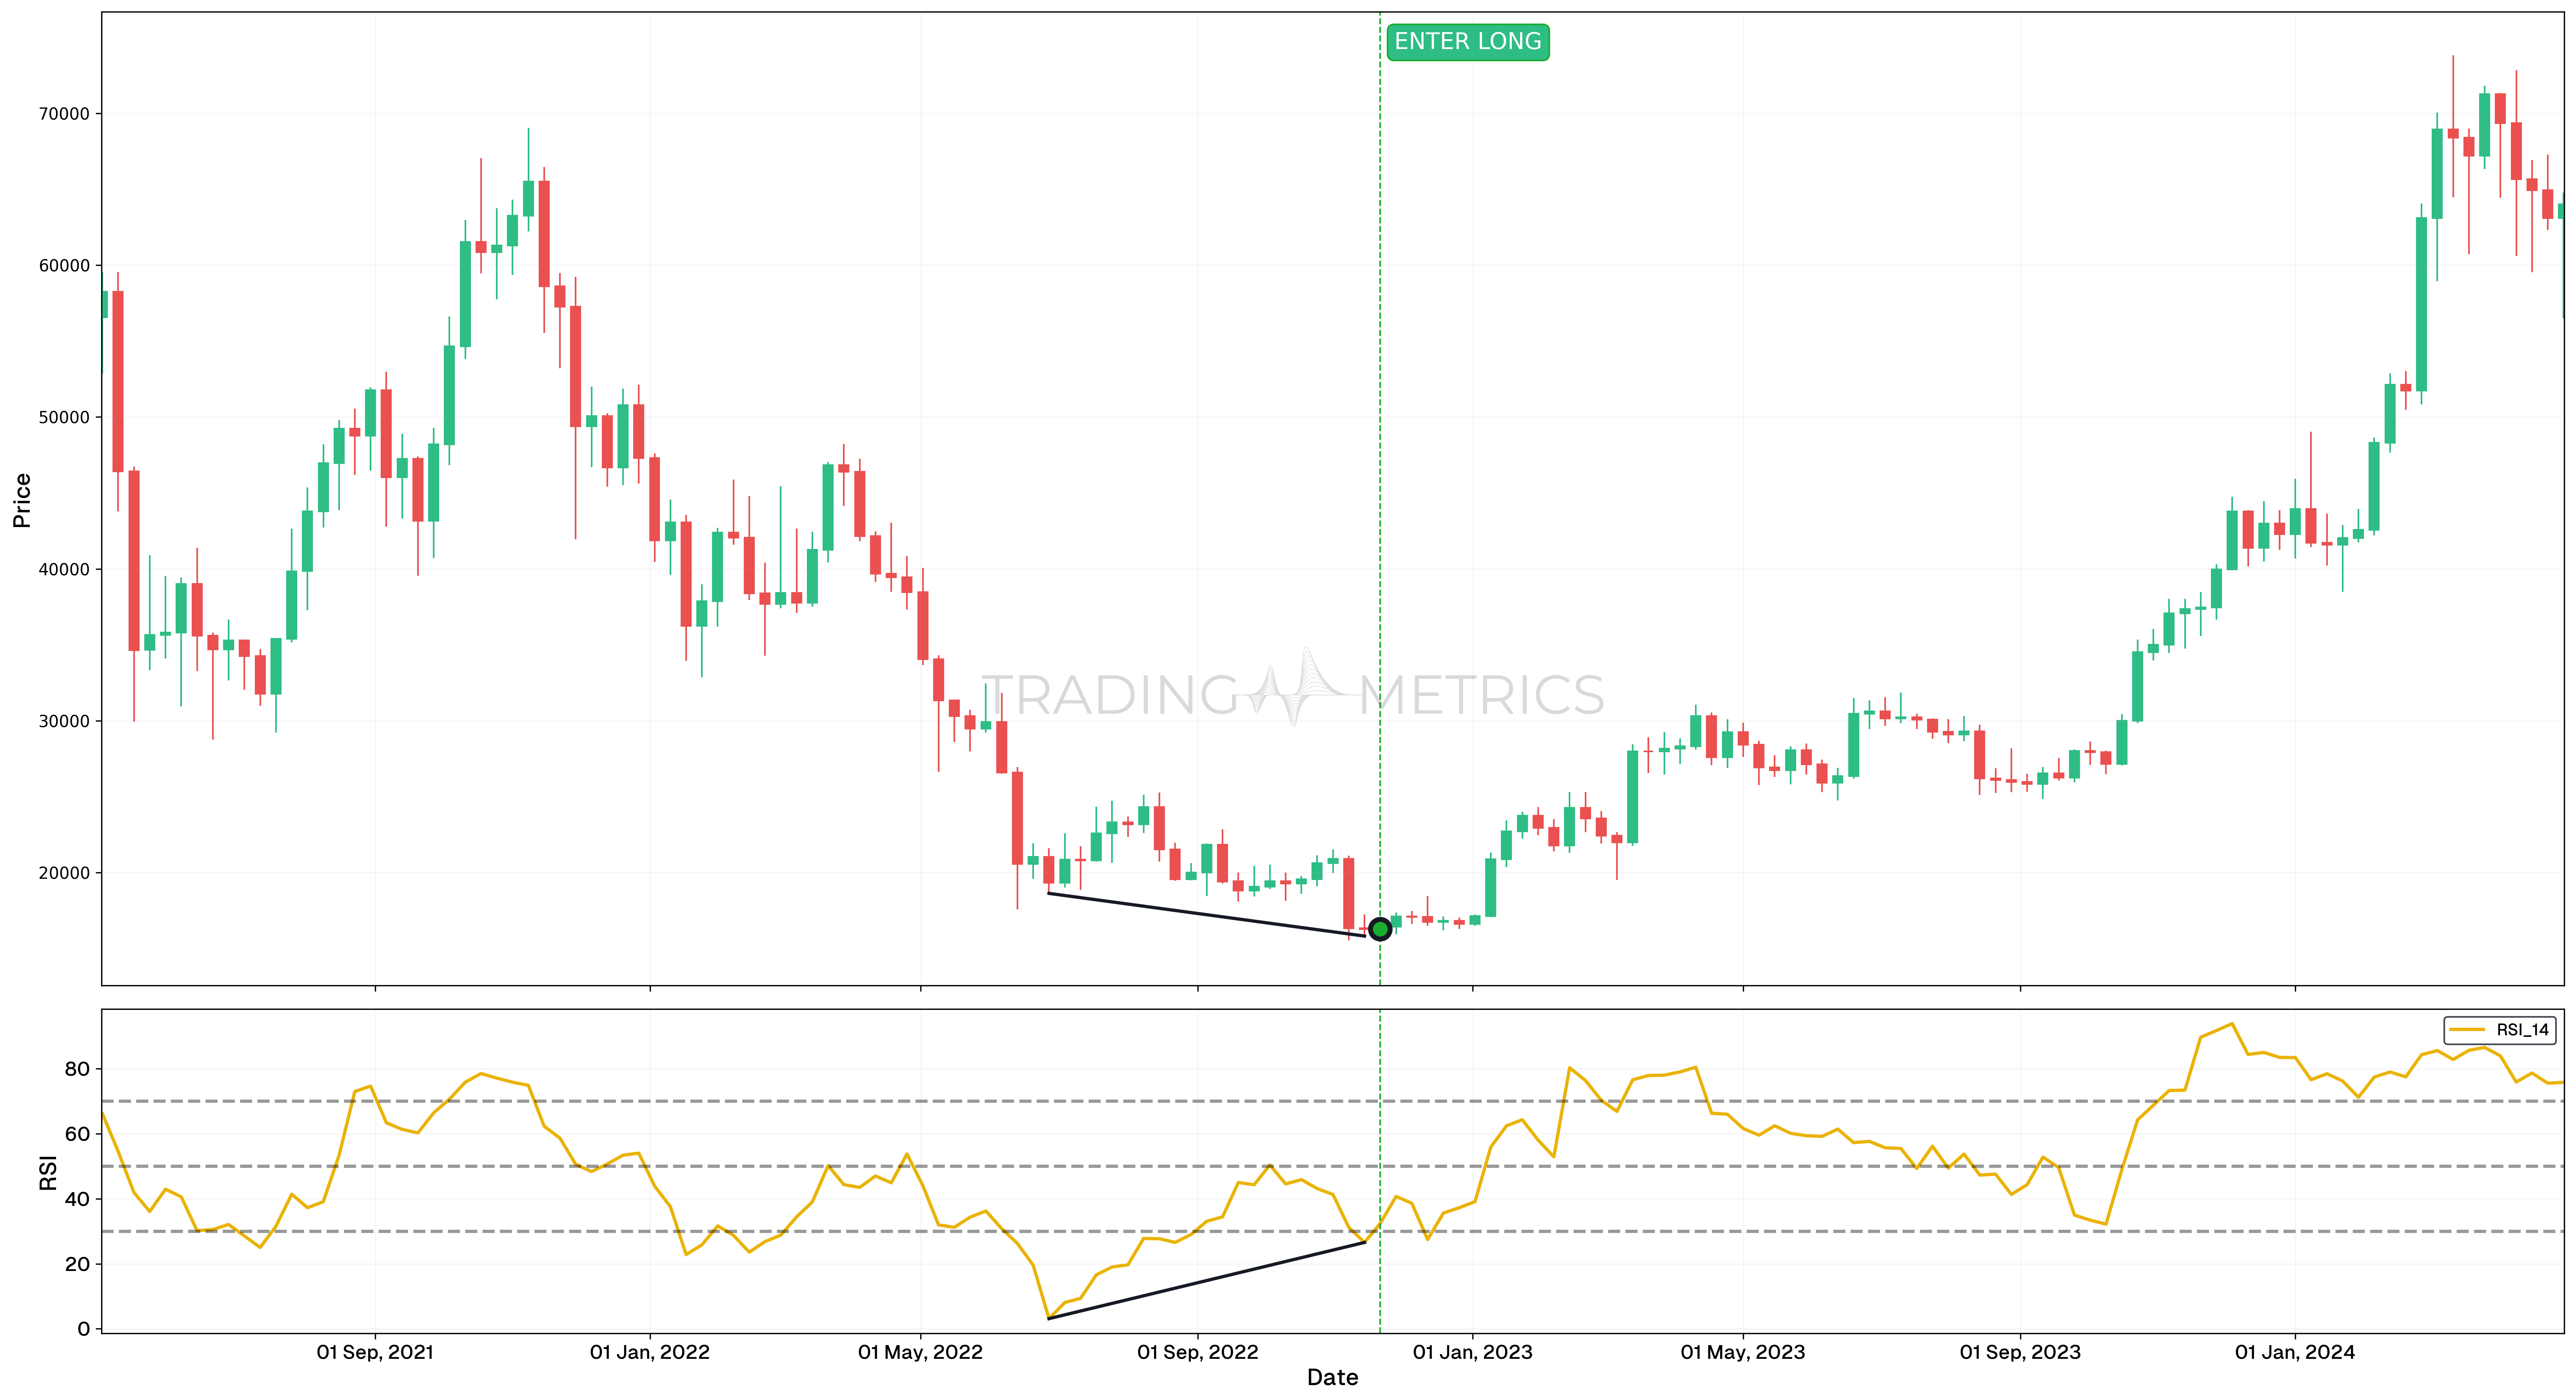
Between June 27, 2022 and November 14, 2022, BTC’s price made lower lows, but the RSI made higher lows. This bullish divergence indicated that despite the falling prices, the momentum was improving. Traders might see this as a sign to buy the asset, anticipating a price reversal. Following the divergence, BTC’s price indeed started to rise, confirming the bullish signal.
Bearish Divergence
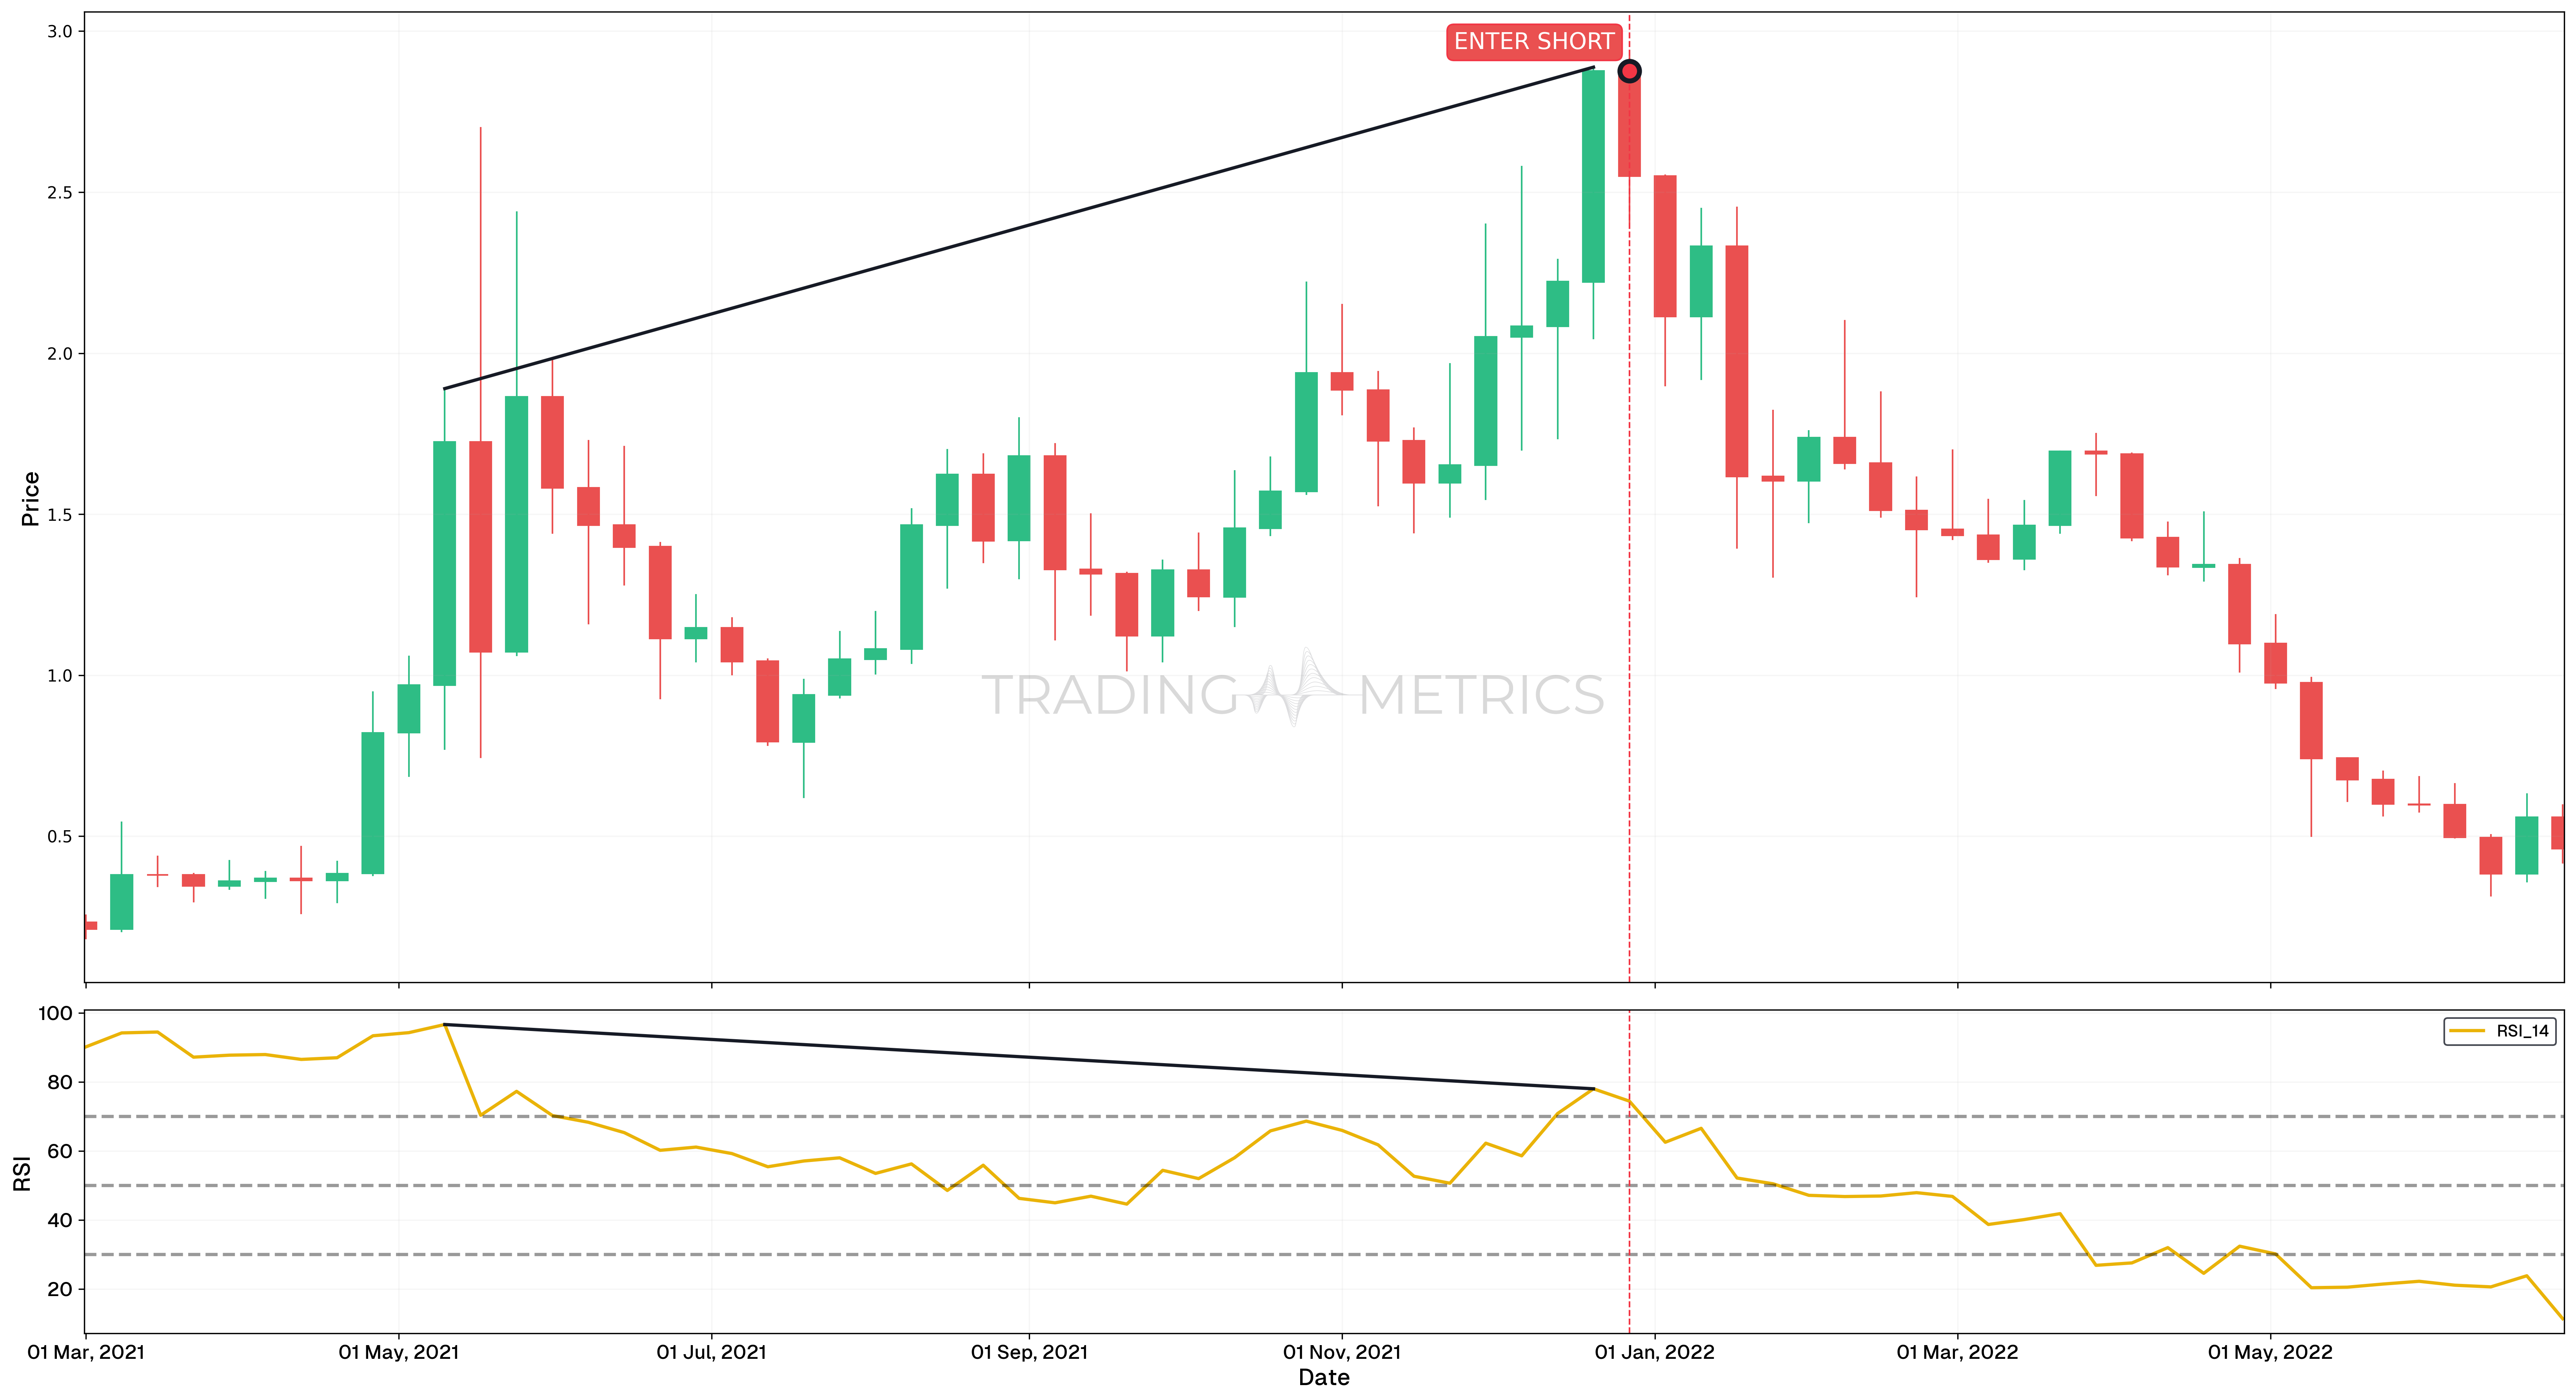
From May 17th, 2021 to December 20th, 2021, Matic’s price made higher highs, but the RSI made lower highs. This bearish divergence suggested that the uptrend might be weakening, and a reversal could be near. Soon after, the price of Matic began to fall, validating the bearish divergence signal.
Risk Reminder: Avoid using RSI on its own in ranging markets - it works best when paired with support/resistance or trend analysis.
Combining RSI with Other Tools
To enhance the effectiveness of RSI, it can be combined with other technical analysis tools:
- Moving Averages: Using RSI with moving averages can help confirm trends. For instance, if the RSI indicates overbought conditions but the price is still above a moving average, the trader might wait for further confirmation before selling.
- Bollinger Bands: These can help identify overbought or oversold conditions. If the RSI indicates an overbought condition and the price touches the upper Bollinger Band, it could be a stronger signal to sell.
- MACD (Moving Average Convergence Divergence): Combining RSI with MACD can provide more reliable signals. For instance, if both indicators suggest a bullish reversal, it increases the probability of a successful trade.
Timing Tip: Use RSI on multiple timeframes - spot long-term trends on higher timeframes and time your entries with RSI signals on lower timeframes.
Key Points
- Momentum Oscillator: The Relative Strength Index (RSI) measures the speed and magnitude of recent price changes to identify overbought or oversold conditions.
- Range Interpretation - RSI above 70 indicates overbought conditions, signaling potential price corrections or reversals while RSI below 30 indicates oversold conditions, suggesting potential buying opportunities.
- Divergence Signals: Bullish divergence (price makes lower lows, RSI makes higher lows) and bearish divergence (price makes higher highs, RSI makes lower highs) can signal potential trend reversals.
- Works Across Time Frames: RSI is effective in both short-term and long-term analysis, making it versatile for day traders, swing traders, and long-term investors.
- Default and Custom Settings: The default RSI period is 14, but traders can adjust this to suit their trading style or market conditions for more sensitivity or stability.
- Trend Confirmation: Use RSI to confirm the strength of a trend when combined with trend-following indicators like moving averages or MACD.
- Avoid in Strong Trends: RSI can remain overbought or oversold in strong trends, so additional confirmation is needed before acting on signals.
- Support and Resistance: RSI levels often act as dynamic support or resistance in trending markets, helping to refine entry and exit points.
- Multiple Time Frame Analysis: Analyzing RSI across different time frames enhances accuracy and helps identify broader market sentiment.
- Backtesting and Integration: Incorporate RSI into backtesting and combine it with other indicators to build robust trading strategies tailored to specific market conditions.
Conclusion
RSI is a versatile and essential tool for traders, offering insights into market momentum and potential reversals. By combining RSI with other indicators and confirming its signals, traders can enhance their decision-making process and improve their trading outcomes. Always remember to consider market conditions and adjust your strategy accordingly to maximize the benefits of RSI in your trading arsenal.
Frequently Asked Questions
Quick answers based on this page's topic.
RSI is valued for its simplicity and accuracy in measuring the speed and change of price movements. By oscillating between 0 and 100, it provides clear, objective thresholds for identifying overbought (70) and oversold (30) conditions across any asset class.
RSI divergence occurs when the price movement and the indicator move in opposite directions. For example, if price hits a new high but RSI hits a lower high, it signals 'bearish divergence,' warning traders that the uptrend is losing underlying strength.
In strong trending markets, the RSI can remain in overbought or oversold territory for extended periods. Traders should avoid selling immediately just because the RSI hits 70; instead, wait for the indicator to cross back below the threshold to confirm a reversal.
The default 14-period setting works well for swing trading on daily charts. Day traders often shorten it to 7 or 9 periods for faster signals, while position traders may extend it to 21 or 25 periods to filter out noise. Shorter periods increase sensitivity but produce more false signals.
RSI works best as a confirmation tool alongside trend indicators like MACD or Moving Averages. For example, only take RSI oversold signals when the price is above the 200-day MA to ensure you are buying dips within a broader uptrend rather than catching a falling knife.