Trading the Bullish AB=CD Pattern: Symmetrical Reversal Basics
The Bullish AB=CD Pattern is a streamlined bullish reversal signal in technical analysis, often appearing at the end of a downtrend. It is a symmetrical structure, where the AB leg is mirrored by the CD leg with equal length and time. This symmetry reflects a shift from bearish exhaustion to bullish momentum. When the pattern forms, it signals that sellers are losing strength and buyers are gaining control, setting the stage for a new uptrend.
How to Identify the Bullish AB=CD Pattern in Trading
The Bullish AB=CD Pattern is a classic harmonic reversal setup. Picture a market sliding lower in two measured legs, where the second leg mirrors the first, but loses steam at the end. That’s the trap door for sellers and the entry for buyers. Here’s how to spot it:
Start with the Big Picture
This pattern appears after a steady downtrend. Sellers have been pressing the market lower, but momentum is fading. The Bullish AB=CD framework helps you pinpoint where exhaustion is likely to flip the trend upward.
Trace the ABCD Legs
The structure is made of four connected swings, each balancing the other in proportion. Recognizing these legs builds the foundation of the setup.
- AB: A sharp selloff, clean and strong.
- BC: A corrective rally, retracing 38.2%–88.6% of AB.
- CD: A final decline, ideally equal in length and time to AB, while also extending into the 113%–261.8% projection of BC.
- D Point: The Potential Reversal Zone (PRZ), where symmetry signals exhaustion and buyers prepare to step in.
Zero in on D (the Reversal Zone)
D is the pivot point. It’s where symmetry suggests the decline should end. If price stabilizes here, buyers are likely preparing to take control.
Watch the Breakout
Confirmation comes when price rebounds off D and pushes higher.
- A strong bullish candle or
- A close above minor resistance near C
Both signal that the downtrend has snapped and the reversal is underway. That’s your entry trigger.
Check Volume for Additional Confirmation
Volume flow adds conviction by showing if real buyers are backing the move.
- Heavy volume on AB (sellers dominant).
- Lighter volume on BC (pause).
- Another surge down on CD, then a volume spike at D as buyers punch back.
When you see that surge, you know the reversal isn’t bluffing.
Rise Echo: Measure the AB leg height and project it upward from D, or target the 38.2% or 61.8% retracement of CD for a realistic price target.
How to Trade the Bullish AB=CD Pattern (Trading Example)
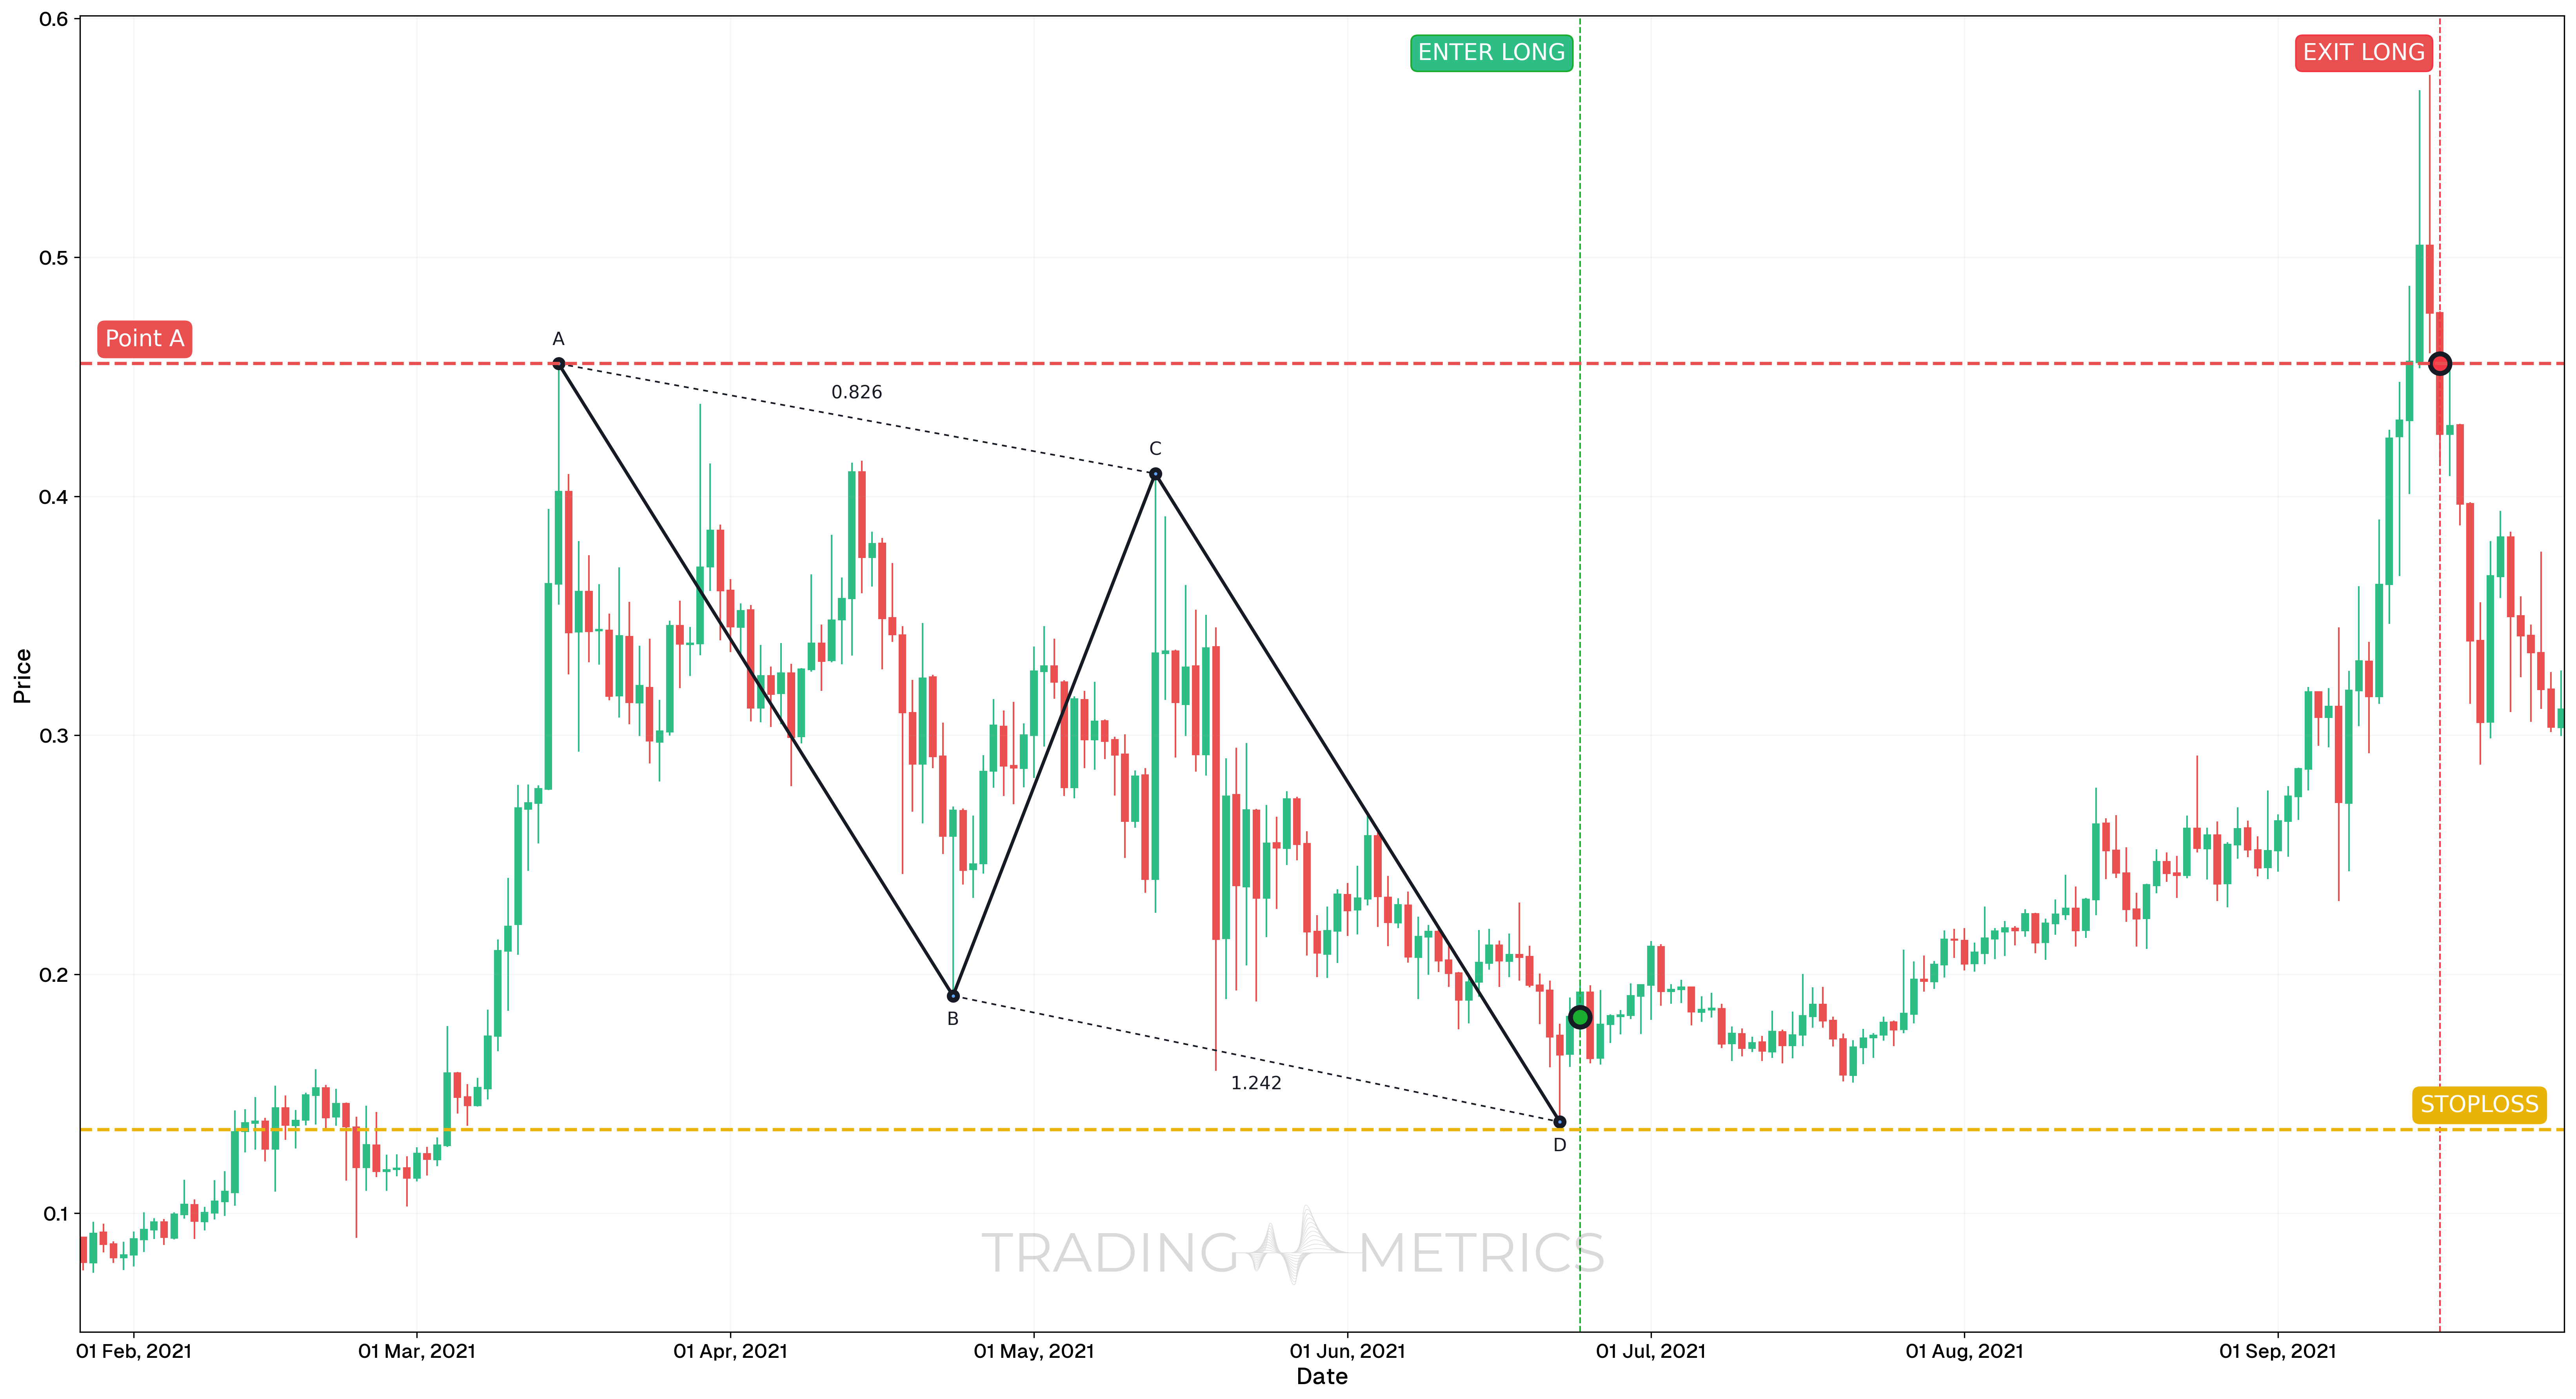
This example illustrates a textbook AB = CD Pattern (Bullish) trade on the HBARUSDT pair, where harmonic symmetry provided a reliable reversal opportunity on the daily chart.
Analysis
From January 27, 2021, to September 29, 2021, HBARUSDT formed a classic AB = CD structure. The CD leg mirrored the AB leg in both time and distance, completing near a strong weekly support zone. A bounce confirmed the PRZ (Potential Reversal Zone) with bullish signals aligning.
Trade Setup
-
Entry: Entered on June 24, 2021, at $0.18208, after the CD leg completed at key harmonic support and price began reversing upward.
-
Exit: Exited on September 17, 2021, at $0.4555, which aligned closely with the A point of the pattern. A Shooting Star candle at that level indicated exhaustion and served as confirmation for exit.
-
Outcome: The AB = CD completion led to a strong impulsive move upward, offering a clear and structured trade from support to prior swing high.
Risk Management
- Stop-Loss placement: Placed just below point D at $0.135, allowing the pattern structure to hold without premature exit.
- Risk-Reward Ratio: 1:5.81, reflecting high reward potential relative to limited structural risk.
- Position sizing: Based on a 2% capital risk model, calculated between entry at $0.18208 and stop-loss at $0.135.
- Volatility Consideration: Volatility compressed into the PRZ (Potential Reversal Zone) and expanded sharply after confirmation, creating a low-risk, high-reward scenario typical of well-formed harmonics.
- Confirmation Note: Entry was not taken blindly at the D-point. Additional confirmation via price action, weekly support, and candlestick reversal strengthened the setup.
Volume Echo: A volume spike at D with confirmation lifts the pattern into a bullish surge.
Pre-Trade Checklist
Echo the Proof: Pair the pattern with volume spikes and indicators like RSI to dodge fakes and boost your odds.
Key Points
- Symmetry Precision: Equal AB and CD legs in length and time boost reliability - uneven legs dilute it.
- Time Frame: Echoes strongest on daily or weekly charts after downtrends.
- Combine with Indicators: Use moving averages or RSI to confirm the reversal.
- Breakout Confirmation: A strong bullish candle at D or a close above B confirms the reversal – don’t jump at D without confirmation.
- Price Target: Measure the AB leg or use Fibonacci Retracement of AD for targets above the close.
- Risk Management: Set a stop-loss below D to limit losses if it fails.
Wait for the Echo: Acting before confirmation risks a Bullish AB=CD trap - let the reversal resonate.
Conclusion
The Bullish AB=CD Pattern is a trader’s streamlined tool for catching bullish reversals. Its symmetrical echo, paired with volume, RSI, and moving averages, can resonate into big gains. Whether in crypto, stocks, or forex, this pattern sharpens your edge. Stay precise, manage your risk, and let the Bullish AB=CD align – that balanced symmetry could lift into a winning trade.
Frequently Asked Questions
Quick answers based on this page's topic.
It signals that a downtrend is reaching a point of mathematical exhaustion and symmetry. When the second impulsive leg (CD) equals the first (AB), it suggests that the selling pressure has reached a natural equilibrium, creating a high-probability zone for a bullish reversal.
The most reliable ABCD patterns feature a BC leg that retraces exactly 61.8% of the AB leg upward. When this occurs, the CD leg typically completes at the 161.8% extension of the BC leg, creating a 'perfect' harmonic structure at point D.
The stop-loss is typically placed just below the projected D completion point. Since the pattern's validity relies on the symmetry of the legs, a decisive move below point D invalidates the harmonic structure and suggests the downtrend is still active.