Shooting Star Pattern: When Buyers Get Rejected at the Highs
The Shooting Star pattern is a fleeting bearish reversal signal in technical analysis, often forming at the peak of an uptrend. Picture it as a fallen star - a candlestick with a small body, a long upper shadow, and little to no lower shadow - marking a brief surge that fades fast. When this pattern forms, it’s a piercing sign that bullish momentum is stalling, offering traders a chance to sell or short the asset as a downtrend prepares to descend.
How to Identify the Shooting Star Pattern in Trading
The Shooting Star is a bearish reversal candlestick formation. It develops as a single candle at the crest of an uptrend, with a small body and a long upper shadow. The setup signals that buyers attempted to drive prices higher but were overpowered by sellers. Here’s how to spot it:
Start with the Big Picture
This pattern forms after an uptrend. The strong upward push fades, leaving behind a long upper shadow that reflects a failed rally.
Look for the Candlestick Shape
The Shooting Star is defined by its proportions:
- A small real body, with the open and close near each other.
- A long upper shadow, at least twice the body’s length.
- Little to no lower shadow, showing sellers regained control by the close.
Zero in on the Confirmation Level
The confirmation level is the low of the Shooting Star. Price must close below this level to confirm the bearish reversal.
Watch the Breakdown
The bearish trigger comes when the next candle closes below the Shooting Star’s low.
- A strong bearish follow-up candle provides confirmation.
- This breakdown is the entry point for the setup.
Check Volume for Additional Confirmation
Volume behavior adds weight to the signal.
- Spikes during the Shooting Star session, reflecting a failed rally.
- Increases on the confirming bearish candle, showing sellers are taking control.
Drop Trail: Measure the upper shadow height or use nearby support levels to project a realistic price target downward from the confirmation close.
How to Trade the Shooting Star Pattern (Trading Example)
This example features a textbook Shooting Star pattern on the 12-hour chart, used to initiate a short position following a sharp upside move. The pattern was confirmed by price action on the next candle close.
Analysis
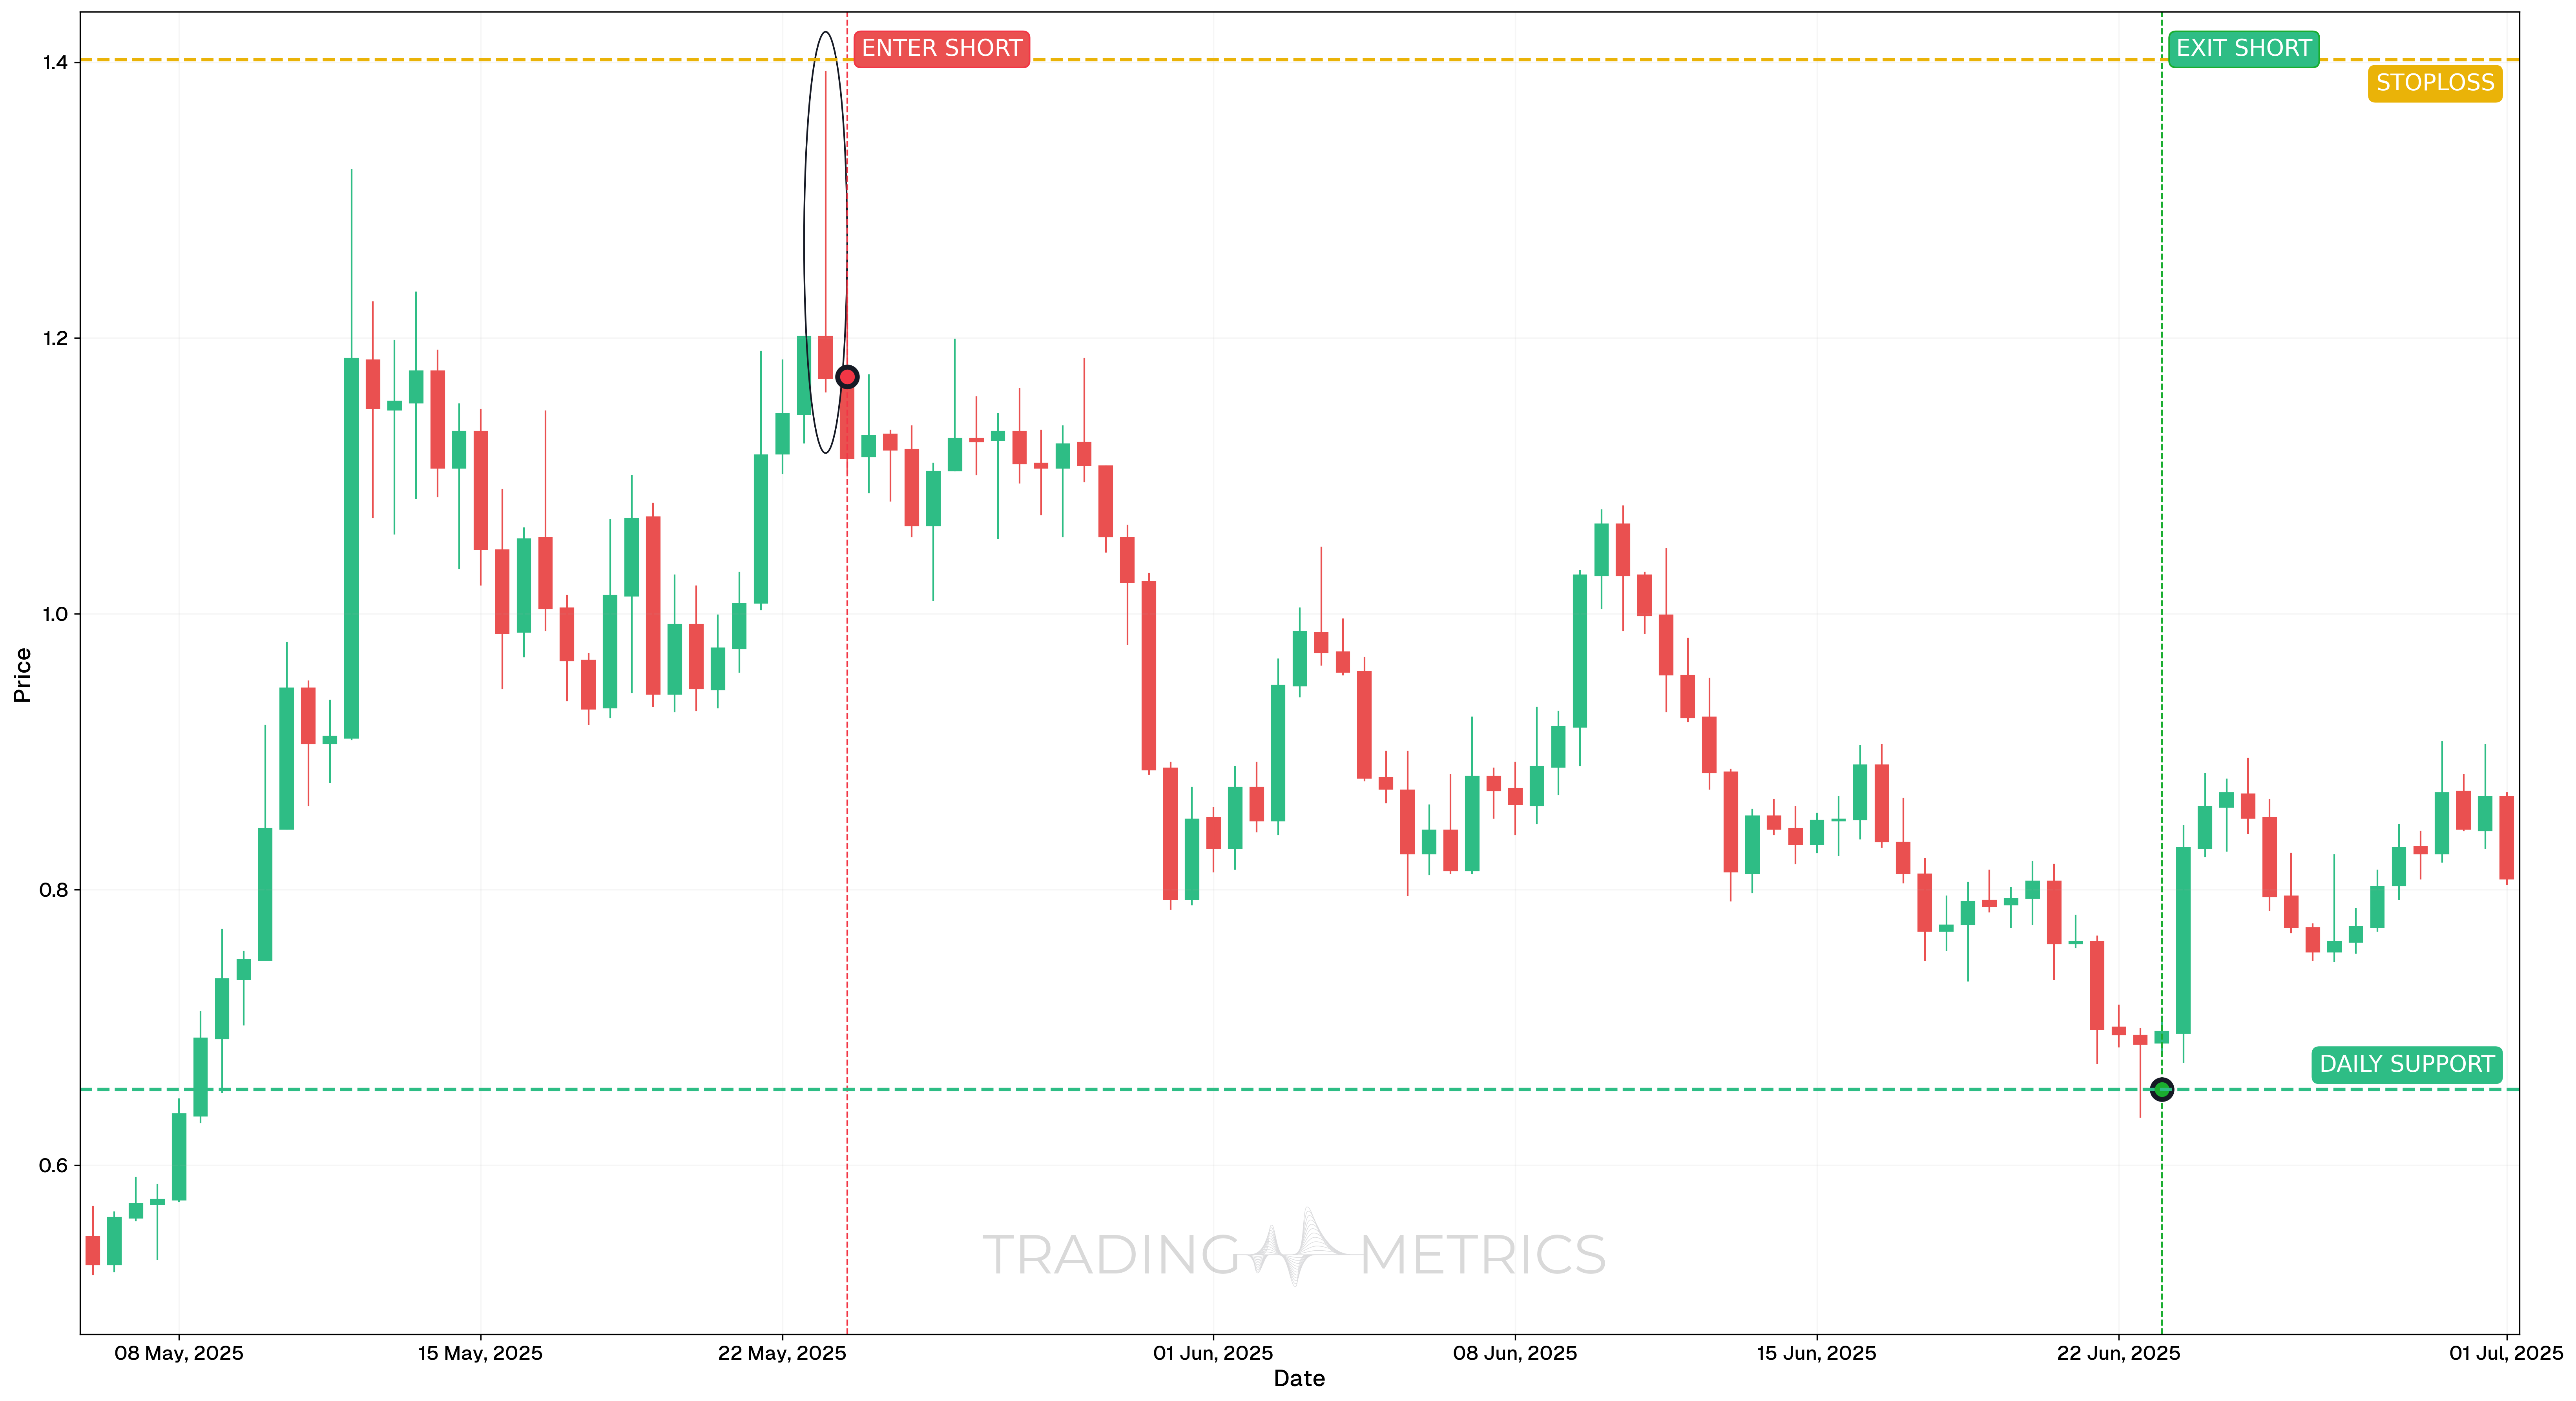
On May 23, 2025, a clean Shooting Star formed after an extended rally. The candle had a long upper wick and a small real body near the low, indicating buyer exhaustion and potential for reversal. This pattern formed close to a previous resistance zone.
Trade Setup
-
Entry: Entered short on May 23, 2025, at 14:00, at $1.114, after confirmation candle closed below the Shooting Star’s low.
- The Shooting Star formed on May 23, 2025.
- Confirmation came from a strong bearish candle that closed below the pattern.
-
Exit: Closed the position on June 25, 2025, at 02:00, at $0.655, near a strong daily support level.
-
Outcome: The Shooting Star pattern successfully predicted a trend reversal. Entry after confirmation reduced false signal risk and helped capture a strong downside move.
Risk Management
- Stop-Loss Placement: Stop-Loss was placed at $1.402, just above the Shooting Star’s high.
- Risk-Reward Ratio: The stop-loss was set at $1.402, with an entry at $1.114, resulting in a total risk per share of $0.288. The trade was closed at $0.655, yielding a reward of $0.459. This results in a Risk-Reward Ratio of 1:1.59, offering a solid reward relative to the risk taken, especially given the pattern confirmation and supporting Stop-Loss.
- Position Sizing: Determined using a 2% capital risk model, adjusted based on Stop-Loss distance.
- Volatility Consideration: The pattern formed after a strong move up, and momentum started to fade. Reversal candle gave a low-risk short opportunity.
- Confirmation Priority: Entry was deliberately taken after a bearish confirmation candle closed below the Shooting Star, improving reliability of the signal.
Volume Fall: A volume spike on the Shooting Star candlestick, followed by bearish follow-through, shoots the pattern into a bearish drop.
Pre-Trade Checklist
Shoot the Proof: Pair the pattern with volume spikes and indicators like RSI to dodge fakes and boost your odds.
Key Points
- Shadow Clarity: A long upper shadow with a small body boosts reliability - short shadows dilute it.
- Time Frame: Falls deepest on daily or weekly charts after uptrends.
- Combine with Indicators: Use moving averages or RSI to confirm the reversal.
- Breakout Confirmation: A close below the Shooting Star’s low sets the turn - don’t jump on the pattern alone.
- Price Target: Measure the upper shadow height or use support levels for a target below the close.
- Risk Management: Set a stop-loss above the Shooting Star’s high to limit losses if it fails.
Wait for the Fall: Acting before confirmation risks a star trap - let the reversal shoot down.
Conclusion
The Shooting Star pattern is a trader’s fleeting tool for catching bearish reversals. Its starry blaze, paired with volume, RSI, and moving averages, can shoot into big gains. Whether in crypto, stocks, or forex, this pattern sharpens your edge. Stay alert, manage your risk, and let the Shooting Star flicker – that failed surge often signals the start of a profitable bearish move.
Frequently Asked Questions
Quick answers based on this page's topic.
The Shooting Star features a long upper wick and a small body at the bottom, representing a classic 'bull trap.' It shows a failed breakout where buyers were lured in at the highs only to be immediately crushed by a wave of selling pressure.
For the pattern to be technically valid, the upper shadow (the wick) should be at least twice the length of the candle's real body. This ensures that the rejection was significant enough to represent a real shift in the balance of power between buyers and sellers.
Risk is typically managed by placing a stop-loss just above the tip of the upper wick. Since that wick represents the absolute point of market rejection, any price move back above it invalidates the bearish signal and suggests the uptrend may continue.