Hammer Candlestick Pattern: When Sellers Get Rejected at the Lows
A Hammer candlestick pattern is a single-candle bullish reversal formation that appears at the bottom of a downtrend. It features a small body near the top of the range and a long lower shadow at least twice the body’s length, signaling that sellers were overwhelmed by buyers during the session.
What Is the Hammer Candlestick Pattern?
The Hammer candlestick pattern is a bullish reversal signal in technical analysis, often striking at the bottom of a downtrend. Picture it as a hammer driving a nail — price forms a candlestick with a small body, a long lower shadow, and little to no upper shadow — forging a base after a bearish fall. When this pattern emerges, it’s a solid sign that bearish momentum is faltering, offering traders a chance to buy or go long as an uptrend prepares to rise.
The name “Hammer” comes from Japanese candlestick charting, where the shape resembles a hammer with a long handle pointing downward. The pattern was popularized by Steve Nison in his work on Japanese candlestick techniques, which brought this centuries-old method to Western traders.
A Hammer is most significant when it appears at a key support level, a Fibonacci retracement zone, or after an extended selloff where the market is overdue for a bounce. Without proper context, a Hammer-shaped candle in the middle of a range carries far less weight.
Psychology Behind the Hammer Pattern
Understanding why the Hammer works is as important as knowing how to trade it. The pattern captures a specific shift in market psychology within a single trading session:
-
Sellers dominate the open — The session begins and sellers aggressively push price lower, continuing the prevailing downtrend. At this point, fear is in control and it looks like the decline will continue.
-
Buyers absorb the selling — At the session low, institutional buyers begin stepping in. They see value at these prices, or short sellers begin covering positions. The aggressive buying absorbs the remaining sell orders.
-
Price recovers sharply — Buyers push price back up from the low, closing the session near the open or even slightly above it. The long lower shadow is the visual evidence of this intraday battle.
-
Sentiment shifts — The failed attempt to continue lower sends a clear message: sellers could not hold control. Traders watching the market recognize this as potential exhaustion and begin positioning for a reversal.
This is why volume confirmation matters so much — a Hammer on high volume means the rejection of lower prices was backed by real institutional participation, not just a lack of sellers.
How to Identify the Hammer Pattern in Trading
The Hammer is a bullish reversal candlestick. It forms after a downtrend when sellers drive the price lower, but buyers push it back up to close well above the low, near the open or slightly higher. It signals that sellers are losing control. Here’s the step-by-step guide.
Start with the Big Picture
This pattern appears after a downtrend. Sellers look dominant, but the Hammer shows buyers stepping back in, hinting at a potential reversal.
Trace the Candle’s Shape
The candlestick features three defining traits:
- Long lower shadow: Shows sellers drove the price down sharply.
- Small real body near the top: The close is near the open but well above the low.
- Little to no upper shadow: Buyers held the price near its high by the close.
Zero in on the Confirmation Level
The confirmation level is the Hammer’s high. A decisive close above this high validates the bullish reversal.
Watch the Breakout
The bullish trigger comes when the next candle closes above the Hammer’s high, ideally with a strong bullish candle. That’s your entry point. (Some traders wait for additional confirmation before entering.)
Check Volume for Additional Confirmation
Volume helps confirm conviction:
- Volume should be high on the Hammer candle, reflecting a strong battle between sellers and buyers at the lows.
- A surge on the confirming bullish candle reinforces the strength of the reversal.
Rise Strike: Measure the lower shadow height or use nearby resistance levels to project a realistic price target upward from the confirmation close.
How to Trade the Hammer Pattern (Trading Example)
To illustrate how the Hammer pattern can be used to enter a trade, we will choose the VeChain USDT pair. This trade setup formed on the daily chart during a market pullback and signaled a potential bottom before a multi-leg recovery.
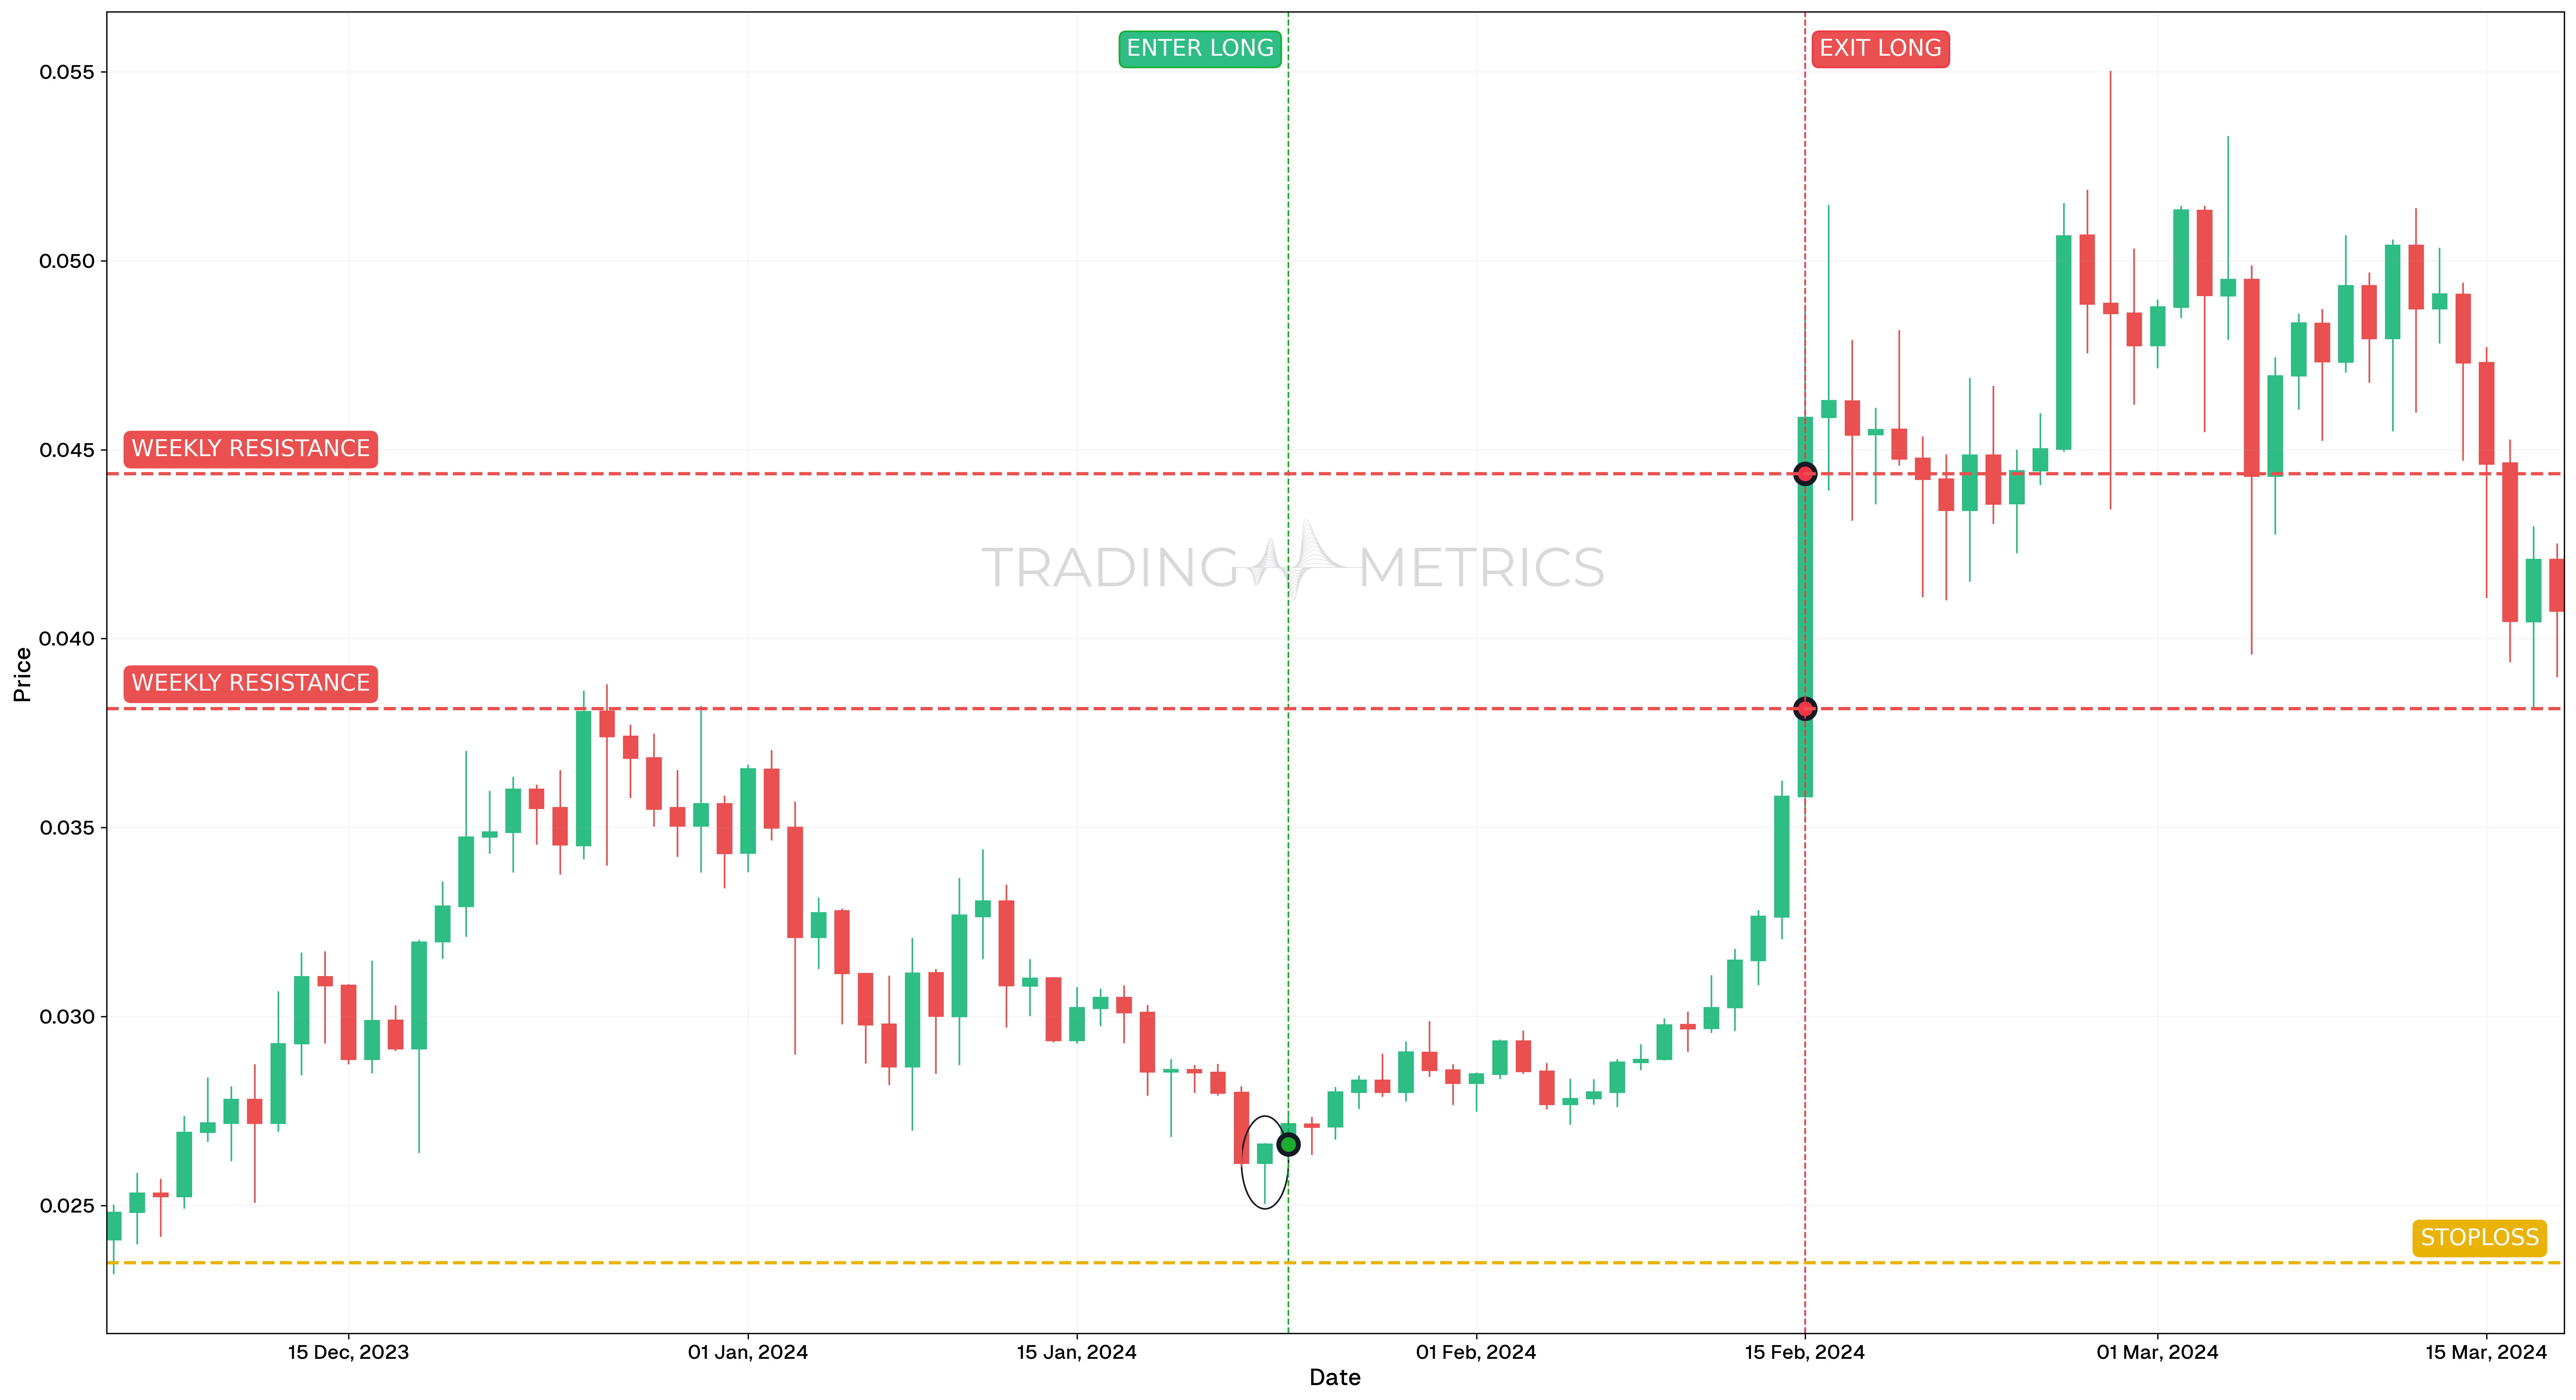
Analysis
On January 24, 2024, VeChain USDT printed a clear Hammer candlestick following a short-term downtrend. The long lower wick reflected strong buy-side rejection, and the close near the high of the candle hinted at a potential reversal. This formed at the end of a corrective move and aligned with the structure of previous support zones.
Trade Setup
-
Entry: Entered on January 24, 2024, at $0.02348 following confirmation of the Hammer. Signals included:
-
Exit: This position used multiple exits aligned with weekly resistance zones. The targets were based on horizontal levels rather than strict Fibonacci levels.
-
Outcome: The Hammer led to a bullish reversal, with price climbing through successive resistance layers. Using predefined exit zones allowed the trader to lock in gains as momentum developed.
Risk Management
- Stop-Loss placement: The stop-loss was placed at $0.02348, aligned with the Hammer candle’s low. This placement validated the reversal setup while keeping downside exposure minimal in case of pattern failure.
- Position sizing: Based on a 2% capital risk model, calculated from entry to stop-loss.
- Volatility Consideration: The pattern followed a period of declining Volatility, which compressed into the Hammer and expanded post-entry. This helped provide early trend exposure while maintaining risk discipline.
- Adaptive Exit Strategy: Exits were taken at weekly resistance zones. A more aggressive strategy could trail the stop-loss using recent swing lows or a short-term EMA.
Strategy 2: Hammer with RSI Divergence (Forex)
This strategy combines the Hammer candlestick pattern with RSI bullish divergence to filter for higher-probability reversals in forex markets.
Identify the Setup
Look for a Hammer forming at the end of a downtrend on a daily chart. Simultaneously, check whether RSI (14-period) is making a higher low while price makes a lower low — this bullish divergence signals weakening downside momentum.
Confirm the Divergence
The RSI should be in or near oversold territory (below 30) when the Hammer forms. The divergence between price and RSI adds a second layer of evidence that selling pressure is exhausting.
Enter on Confirmation
Enter long when the next candle closes above the Hammer’s high. The combination of the Hammer’s visual rejection and RSI divergence provides two independent signals pointing to the same conclusion — a reversal is likely.
Set Risk Parameters
Place your stop-loss below the Hammer’s low. Target the nearest swing high or a 1:2 risk-reward ratio, whichever comes first. This strategy works particularly well on pairs like EUR/USD, GBP/USD, and AUD/USD during pullbacks within broader uptrends.
Strategy 3: Hammer at Moving Average Confluence (Stocks)
This strategy looks for Hammer patterns that form precisely at a moving average support level, combining price structure with trend confirmation for stock trading.
Check the Trend Context
Ensure the stock is in a broader uptrend — price should be trading above the 200-day SMA. You are looking for pullback entries, not trying to catch falling knives. The pullback should bring price down toward the 50-day or 21-day EMA.
Spot the Hammer at the MA
When a Hammer forms with its lower shadow touching or piercing through a key moving average (50-day SMA or 21-day EMA), the pattern gains significant confluence. The moving average acts as dynamic support, and the Hammer’s rejection confirms that buyers are defending this level.
Confirm with Volume
Volume should spike on the Hammer day — ideally above the 20-day volume average. In stock markets, this often represents institutional accumulation at a technically important level.
Execute the Trade
Enter on a close above the Hammer’s high. Set your stop-loss below the Hammer’s low (or below the moving average if it’s tighter). Target the previous swing high or use a trailing stop based on the 21-day EMA to ride the trend continuation.
Volume Forge: A volume spike on the Hammer day, followed by bullish follow-through, hammers the pattern into a bullish surge.
Hammer vs. Related Candlestick Patterns
The Hammer is often confused with other single-candle patterns that share a similar shape. Understanding the differences helps avoid misidentification and improper trade direction.
| Feature | Hammer | Hanging Man | Inverted Hammer | Dragonfly Doji |
|---|---|---|---|---|
Direction | Bullish reversal | Bearish reversal | Bullish reversal | Bullish reversal |
Trend Context | Bottom of downtrend | Top of uptrend | Bottom of downtrend | Bottom of downtrend |
Long Shadow | Lower | Lower | Upper | Lower |
Body Size | Small, near the top | Small, near the top | Small, near the bottom | No body (open = close) |
Reliability | Moderate-High | Moderate | Moderate | Moderate-High |
Hammer vs. Hanging Man
The Hammer and Hanging Man are identical in shape — both have a small body at the top and a long lower shadow. The critical difference is context. A Hammer forms at the bottom of a downtrend and signals buyers stepping in, while a Hanging Man forms at the top of an uptrend and warns that sellers are testing the waters. Trading a Hanging Man as a Hammer (or vice versa) is one of the most common candlestick mistakes.
Hammer vs. Inverted Hammer
The Inverted Hammer is the mirror image — it has a long upper shadow and a small body near the bottom. Both appear at the end of downtrends and signal potential reversals, but the psychology differs. The Hammer shows rejection of lower prices (buyers absorbing sellers at the low), while the Inverted Hammer shows an attempt to push higher that was partially rejected. Hammers are generally considered more reliable because the rejection of the low is a stronger sign of buyer commitment.
Hammer vs. Dragonfly Doji
The Dragonfly Doji is essentially a Hammer where the open and close are at the same price (no real body). Both signal bullish reversals at the bottom of downtrends, but the Dragonfly Doji represents even more extreme indecision — sellers pushed hard but buyers brought the price all the way back to the open. When you see a Dragonfly Doji instead of a Hammer, it can signal an even sharper reversal is coming, but confirmation is equally important.
Pre-Trade Checklist
Forge the Proof: Pair the pattern with volume spikes and indicators like RSI to dodge fakes and boost your odds.
Key Points
- Shadow Clarity: A long lower shadow with a small body boosts reliability — short shadows dilute it.
- Best Timeframes: Hammers are strongest on daily and weekly charts where they reflect meaningful institutional activity. On 4-hour charts, they can work for swing entries within a confirmed trend. Avoid relying on Hammers on 1-hour or lower timeframes due to excessive noise.
- Multi-Market Application: The Hammer works across forex (EUR/USD, GBP/USD), stocks (individual equities and indices), crypto (BTC, ETH, altcoins), and commodities. Adjust your stop-loss distance to match each market’s typical volatility.
- Combine with Indicators: Use moving averages, RSI divergence, or Fibonacci levels to confirm the reversal and filter false signals.
- Breakout Confirmation: A close above the Hammer’s high sets the turn — don’t jump on the Hammer alone.
- Price Target: Measure the lower shadow height or use resistance levels for a target above the close.
- Risk Management: Set a stop-loss below the Hammer’s low to limit losses if it fails.
Wait for the Strike: Acting before confirmation risks a Hammer trap - let the reversal forge ahead.
Conclusion
The Hammer pattern is a trader’s sturdy tool for catching bullish reversals. Its hammered base, paired with volume, RSI, and moving averages, can forge big gains. Whether in crypto, stocks, or forex, this pattern sharpens your edge. Stay alert, manage your risk, and let the Hammer strike - that rejected plunge could rise into a winning trade.
Frequently Asked Questions
Quick answers based on this page's topic.
The Hammer features a small body at the top and a long lower shadow, representing 'Intraday Capitulation.' It shows that even though sellers pushed for a new low, buyers overwhelmed them and closed the price near the highs, creating a firm structural floor.
For a Hammer to be technically valid, the lower shadow (the wick) must be at least twice the length of the candle's real body. This ensures the rejection was significant enough to represent a real shift in power from sellers to buyers at the bottom of a trend.
Traders typically target the nearest major Fibonacci resistance or a previous swing high. Because the Hammer represents a 'forged bottom,' it often marks the start of a multi-day or multi-week rally, providing an excellent Risk-Reward Ratio.
Both have the same shape—small body at the top and long lower shadow—but appear in opposite contexts. A Hammer forms at the bottom of a downtrend and signals a bullish reversal, while a Hanging Man forms at the top of an uptrend and warns of a potential bearish reversal.
Yes, Hammers can fail if the broader selling pressure overwhelms the initial rejection. Traders manage this by placing a stop-loss below the Hammer's lowest wick. If the next candle closes below the Hammer's low, the reversal thesis is invalidated and the position should be exited immediately.
Daily and weekly charts produce the most reliable Hammer signals because they capture meaningful institutional participation. While Hammers can appear on 4-hour or 1-hour charts, shorter timeframes generate more false signals due to market noise. Swing traders should focus on daily charts, while position traders benefit from weekly Hammers at major support zones.
Yes, the Hammer candlestick pattern works across all liquid markets including forex pairs, individual stocks, indices, and cryptocurrencies. The underlying psychology — seller exhaustion followed by buyer absorption — is universal. However, confirmation rules and stop placement should be adapted to each market's typical volatility and session structure.