Three Black Crows: Reading a Three-Bar Bearish Cascade
The Three Black Crows pattern is a powerful bearish reversal signal in technical analysis, typically forming at the peak of an uptrend. It is made up of three consecutive long bearish candles, each opening within or near the previous candle’s body and closing progressively lower. This sequence highlights a decisive shift in sentiment, as bullish momentum fades and sellers seize control.
When the Three Black Crows appear, it signals that buyers have lost strength and a downtrend may be emerging. Traders often interpret the pattern as confirmation of exhaustion at the top, providing an opportunity to enter short positions or prepare for potential downside continuation.
How to Identify the Three Black Crows Pattern in Trading
The Three Black Crows is a bearish reversal candlestick formation. It develops over three consecutive bearish candles at the top of an uptrend, showing relentless selling pressure. The setup signals that control has shifted from buyers to sellers with strong conviction. Here’s how to spot it:
Start with the Big Picture
This pattern forms after an uptrend. Buyers lose steam, and three heavy bearish candles in a row confirm that sellers have taken charge.
Trace the Three-Candle Sequence
The structure is defined by three bearish candles, each extending the downtrend.
- First Candle: A long bearish candle, opening near the previous close and finishing much lower.
- Second Candle: Another long bearish candle, opening within the first candle’s body and closing even lower.
- Third Candle: A third long bearish candle, opening within the second candle’s body and closing lower still, sealing the reversal.
Zero in on the Confirmation Level
The confirmation level is the low of the third candle. A close below this level reinforces the pattern’s strength, though the sequence itself often provides enough confirmation.
Watch the Breakdown
The bearish trigger comes when the third candle closes below the second candle’s low.
- This decisive follow-through marks the entry point.
- Some traders act immediately after the third candle forms, given the pattern’s strength.
Check Volume for Additional Confirmation
Volume behavior strengthens the case.
- Rises across all three candles, showing consistent selling pressure.
- Spikes on the third candle, underscoring the bearish takeover.
Drop Flight: Measure the total range of the three candles or use nearby support levels to project a realistic price target downward from the third candle’s close.
How to Trade the Three Black Crows Pattern (Trading Example)
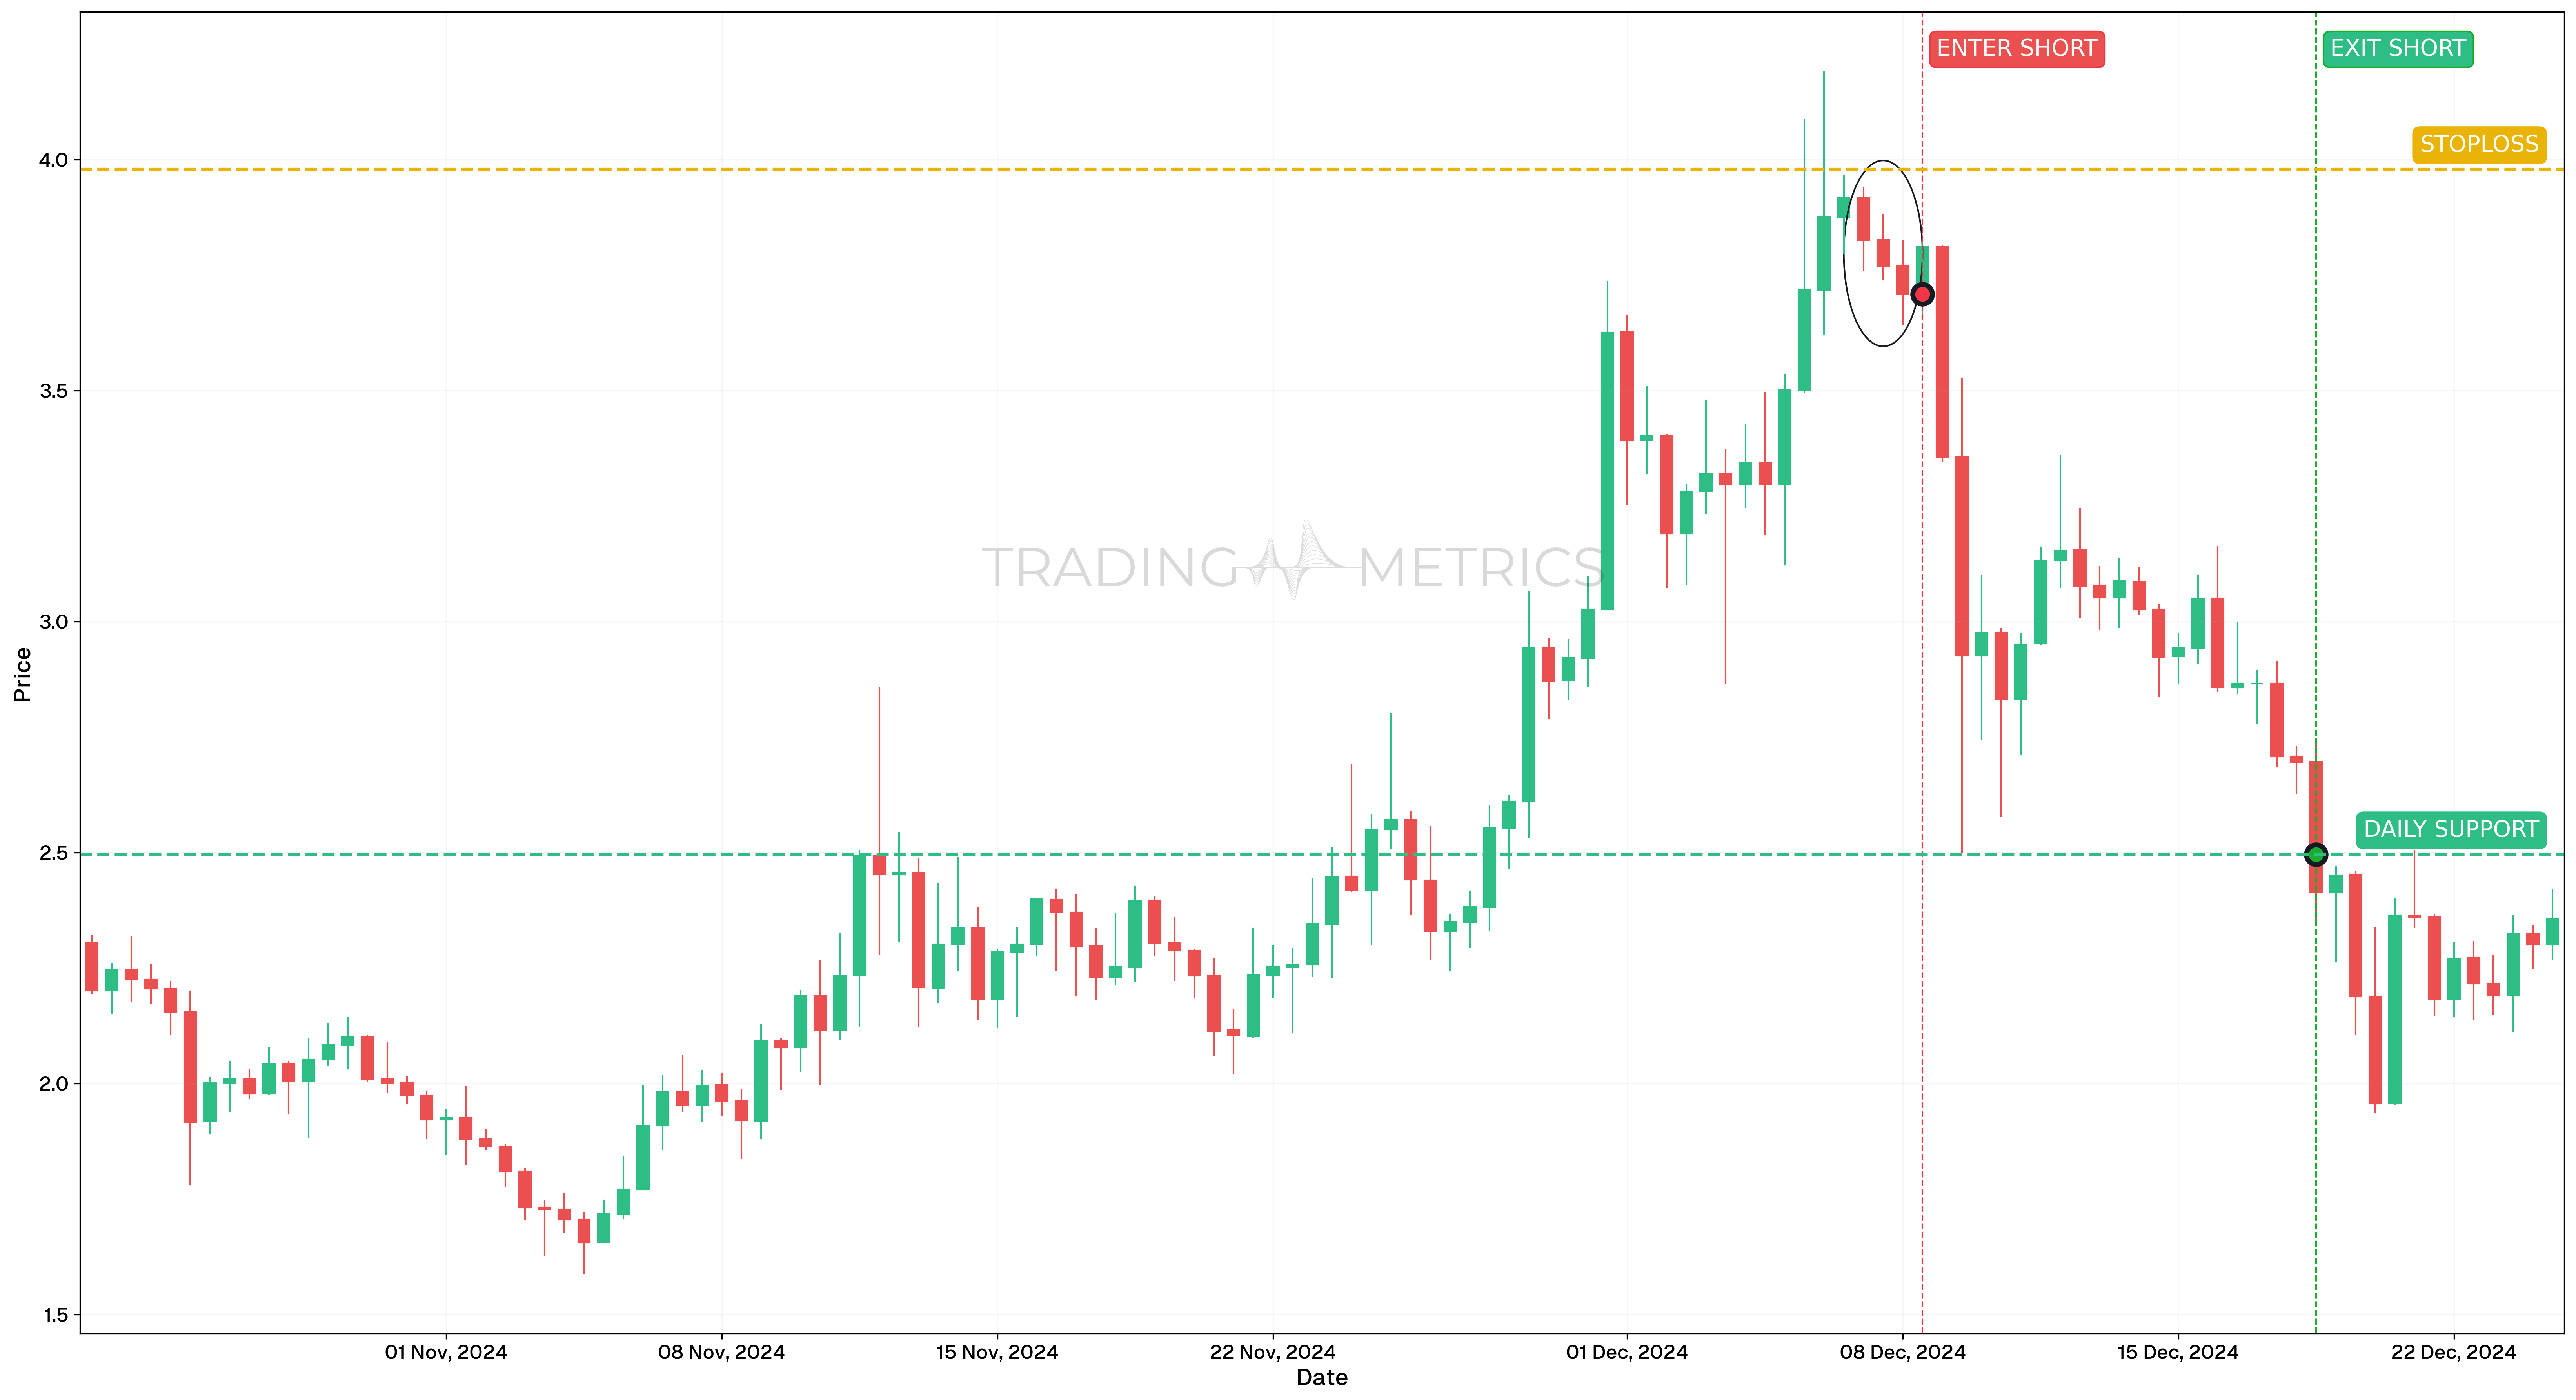
To show how the Three Black Crows bearish pattern can signal a trend reversal, we’ll examine a short trade on WLDUSDT using the 12-hour chart. This setup occurred after a local top and preceded a strong downward move.
Analysis
Between October 23 and December 24, 2024, WLDUSDT rallied and eventually formed a strong reversal pattern Three Black Crows on December 8, 2024. This bearish formation followed a failed breakout and showed sustained seller control across three consecutive candles. The structure developed during decreasing Volatility, followed by a sharp decline.
Trade Setup
-
Entry: The short position was taken on December 8, 2024, at $3.7114, following the confirmation of the Three Black Crows pattern. Key technical confirmations included:
-
Exit: The trade was exited on December 18, 2024, at $2.4954, as price reached a key daily support zone and showed temporary stabilization.
-
Outcome: The Three Black Crows pattern played out effectively, leading to a clean reversal and significant downside capture.
Risk Management
- Stop-Loss placement: The stop-loss was placed at $3.9786, just above the local swing high before the pattern began.
- Position sizing: The trade followed a 2% capital risk model, with size calculated from entry to stop-loss distance.
- Volatility Consideration: Volatility compressed near the top, then expanded sharply after pattern completion, allowing for momentum-driven confirmation.
- Risk-Reward Ratio: 1:4.55 is a strong ratio showing high efficiency and favorable downside capture from a candlestick-based reversal signal.
Volume Descent: A volume spike across the crows, especially on the third, plunges the pattern into a bearish flight.
Pre-Trade Checklist
Descend the Proof: Pair the pattern with volume surges and indicators like RSI to dodge fakes and boost your odds.
Key Points
- Crow Consistency: Three long, consecutive bearish candles boost reliability - short or uneven candles dilute it.
- Time Frame: Plunges deepest on daily or weekly charts after uptrends.
- Combine with Indicators: Use moving averages or RSI to confirm the reversal.
- Breakout Confirmation: A close below the third candle’s low sets the plunge - pattern strength may allow early entry.
- Price Target: Measure the three-candle range or use support levels for a target below the close.
- Risk Management: Set a stop-loss above the first candle’s high to limit losses if it fails.
Wait for the Flight: Acting before the third crow lands risks a crows trap - let the reversal swoop down.
Conclusion
The Three Black Crows pattern is a trader’s foreboding tool for catching bearish reversals. Its dark trio, paired with volume, RSI, and moving averages, can plunge into big gains. Whether in crypto, stocks, or forex, this pattern sharpens your edge. Stay vigilant, manage your risk, and let the crows descend - turning this powerful reversal into a winning trade.
Frequently Asked Questions
Quick answers based on this page's topic.
This pattern consists of three consecutive long-bodied red candles that open within the previous candle's body and close progressively lower. It represents 'Relentless Distribution,' proving that bulls have completely collapsed and sellers are aggressively driving the price into a new downtrend.
The key is candle quality. In a standard correction, candles are often small or mixed with green. In Three Black Crows, all three candles must be large-bodied with very short lower wicks, indicating intense and sustained selling pressure without significant intraday recovery.
Yes, because the momentum is so strong. While many patterns require a fourth confirmation candle, the sheer size and sequence of these three 'crows' often justify an entry at the close of the third candle, with a stop-loss placed above the first candle's high.