Bullish Harami Pattern: Reading Stalled Bearish Momentum
The Bullish Harami is a reversal pattern in technical analysis that signals a potential shift from bearish to bullish momentum. It often appears during a downtrend, indicating that selling pressure may be subsiding as buyers begin to re-enter the market.
Visually, it resembles a brief pause in a decline: a large bearish candle followed by a smaller bullish one contained within its body. This formation suggests hesitation among sellers and the possibility of a trend reversal. When the pattern emerges, it offers traders an early indication that bearish momentum is weakening and that conditions may be favorable to buy or go long as an uptrend starts to form.
How to Identify the Bullish Harami Pattern in Trading
The Bullish Harami is a bullish reversal candlestick formation. It develops over two candles at the bottom of a downtrend, where a strong bearish candle is followed by a smaller bullish one inside its range. It’s a signal of fading selling pressure. Here’s the step-by-step guide.
Start with the Big Picture
This pattern forms after a downtrend. Sellers appear to dominate, but the second, smaller bullish candle hints at a possible reversal upward.
Trace the Two-Candle Sequence
The structure unfolds in two steps:
- First Candle: A strong bearish candle, showing sustained downside momentum.
- Second Candle: A smaller bullish candle, fully contained within the first candle’s body. This shows that buyers are starting to resist the selling pressure.
Zero in on the Confirmation Level
The confirmation level is the high of the first candle. A subsequent close above this level signals that buyers are taking back control.
Watch the Breakout
The bullish trigger comes when a following candle closes above the first candle’s high, confirming the reversal to the upside. This is your entry point. (Some traders act earlier, entering on the smaller bullish candle with added confirmation.)
Check Volume for Additional Confirmation
Volume patterns often reveal conviction:
- High on the first candle, showing strong selling.
- Drops on the second, reflecting hesitation.
- A surge on the confirming bullish candle reinforces the reversal’s strength.
Pop Clue: Measure the height of the first candle or use nearby resistance levels to project a realistic price target upward from the confirmation close.
How to Trade the Bullish Harami Pattern (Trading Example)
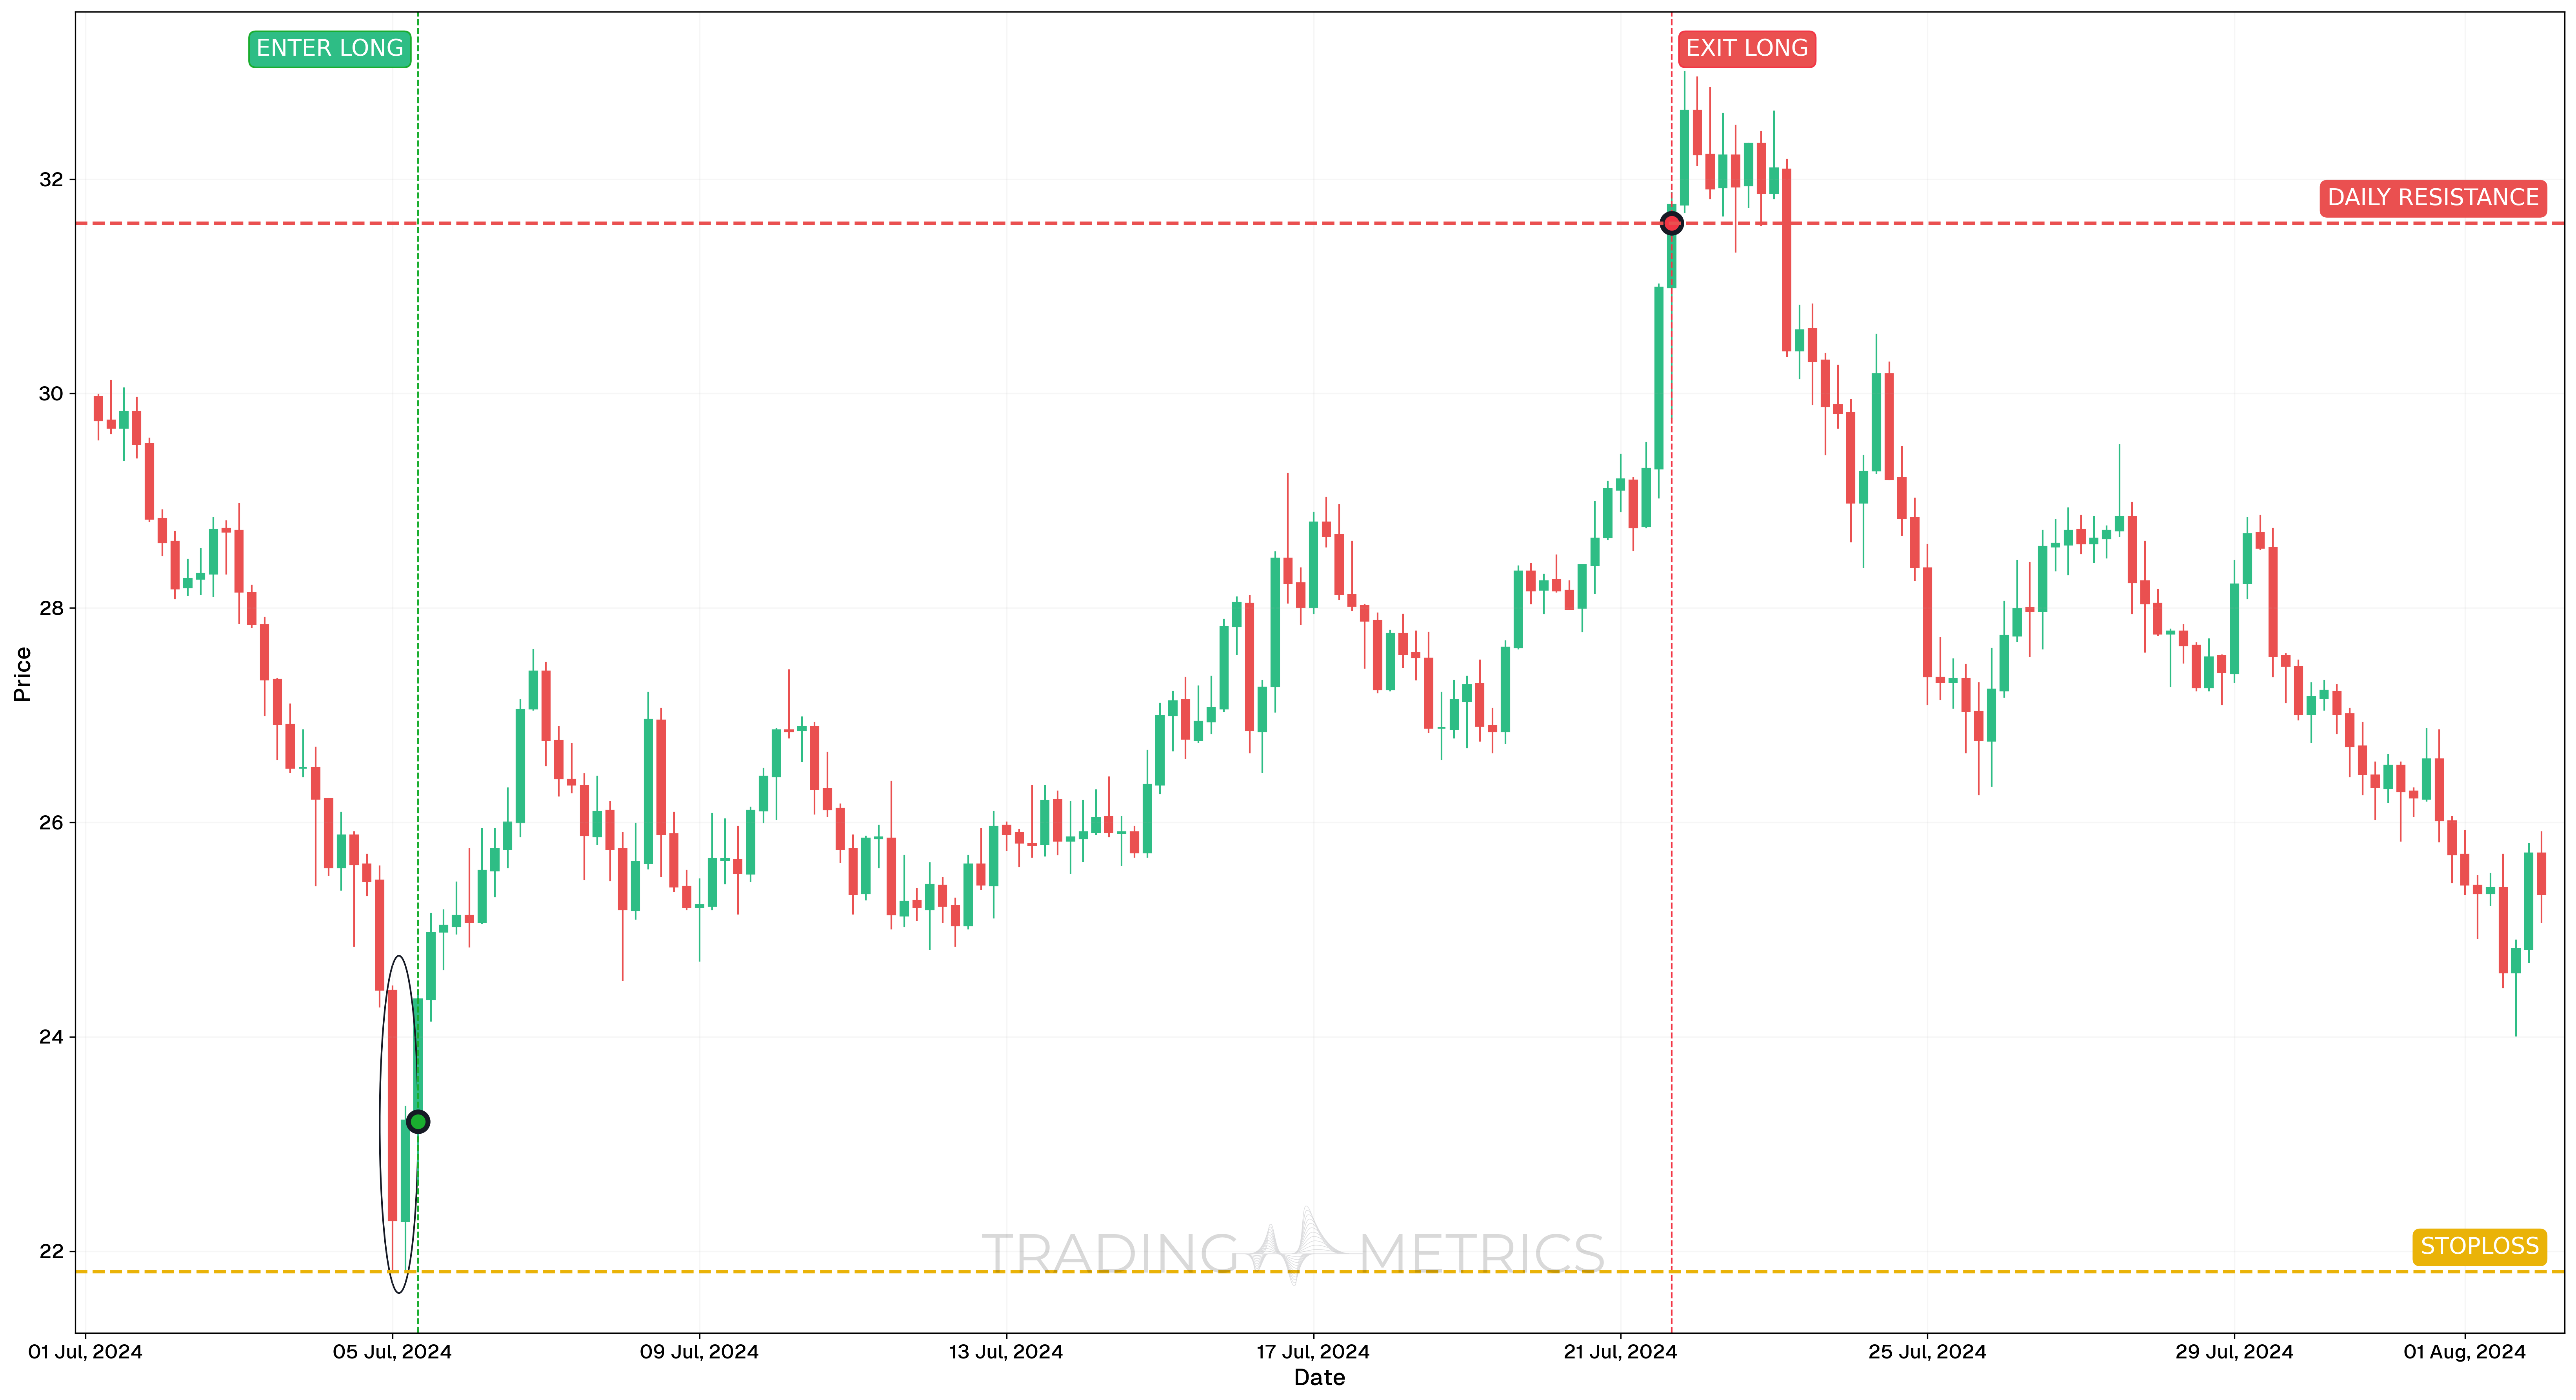
To illustrate how the Bullish Harami pattern can be used to enter a trade, we will choose the AVAXUSDT pair. This bullish reversal pattern appeared on the 4-hour chart following a steep drop, providing a controlled entry after signs of momentum reversal.
Analysis
On July 5, 2024, AVAXUSDT printed a clear Bullish Harami pattern, where a small green candle formed within the prior bearish candle’s range. This suggested potential exhaustion in selling pressure and a possible shift in market direction higher. The pattern developed at the tail end of a local downtrend, improving its reliability.
Trade Setup
-
Entry: The trade was entered on July 5, 2024, at 8:00, at $23.21, just after the pattern completed and the following candle confirmed upward pressure. This entry was supported by:
-
Exit: The position was closed on July 21, 2024, at 16:00, at $31.59, as price approached a zone of previous resistance. This level had acted as a pivot in earlier price history and offered a technically justified profit target.
-
Outcome: The Bullish Harami resulted in a 36% gain, reinforcing its value when combined with momentum and structure.
Risk Management
- Stop-Loss placement: The stop-loss was placed at $21.81, just below the low of the larger bearish candle in the Bullish Harami pair, where the pattern would be considered invalidated.
- Position sizing: Position size was based on a 2% capital risk model, with risk measured from entry to stop.
- Risk-Reward Ratio: The trade produced a Risk-Reward Ratio of 1:5.99, offering a highly favorable return relative to the risk taken.
- Volatility Consideration: The pattern emerged during a phase of contracting Volatility, with the breakout expanding range, improving momentum reliability.
- Adaptive Exit Strategy: A more aggressive exit could have trailed stops below higher lows, or used dynamic exits like EMA taps to allow for further upside while protecting capital.
Volume Ripple: A volume spike on the confirming candle ripples the pattern into a bullish turn.
Pre-Trade Checklist
Ripple the Proof: Pair the pattern with volume spikes and indicators like RSI to dodge fakes and boost your odds.
Key Points
- Candle Contrast: A large bearish candle with a small bullish one boosts reliability - similar sizes dilute it.
- Time Frame: Hits hardest on daily or weekly charts after downtrends.
- Combine with Indicators: Use moving averages or RSI to confirm the reversal.
- Breakout Confirmation: A close above the first candle’s high sets the turn - don’t jump on the Bullish Harami alone.
- Price Target: Measure the first candle height or use resistance levels for a target above the confirmation.
- Risk Management: Set a stop-loss below the first candle’s low to limit losses if it fails.
Wait for the Ripple: Acting before confirmation risks a trap - let the reversal firm up.
Conclusion
The Bullish Harami pattern is a subtle yet effective tool for identifying potential bullish reversals. When combined with volume, RSI, and moving averages, its two-candle pause can evolve into strong rallies. Whether trading crypto, stocks, or forex, this pattern can help sharpen your edge. Stay patient, manage your risk, and let the Bullish Harami form — that small retreat could be the start of a winning long trade.
Frequently Asked Questions
Quick answers based on this page's topic.
It represents 'Seller Hesitation.' After a strong push down, the market fails to make a new low and instead 'nests' inside the previous range. This balance after an impulse proves that sellers have lost their dominance and buyers are beginning to absorb the remaining supply.
Because it is a 'stall' pattern, patience is key. The best entry occurs when the price breaks and closes above the high of the first (large bearish) candle. This breakout confirms that the seller hesitation has officially evolved into a bullish trend shift.
They are opposites. In a Bullish Engulfing, the second candle swallows the first. In a Bullish Harami, the first candle swallows the second. The Harami is a subtle warning of exhaustion, while the Engulfing is a more aggressive momentum-driven reversal.