Mastering the Upside Tasuki Gap: Trend Continuation Strategy
The Upside Tasuki Gap is a bullish continuation pattern that forms during an uptrend, signaling strong and persistent momentum. It consists of three candles: two bullish candles where the second gaps up from the first, followed by a bearish candle that retraces into but does not fully close the gap. The unfilled gap confirms that buyers remain in control, reinforcing the ongoing upward move. If the bearish candle closes the gap completely, the pattern is invalidated.
How to Identify the Upside Tasuki Gap Pattern in Trading
The Upside Tasuki Gap is a three-candle continuation pattern that signals strong buying momentum within an existing uptrend. It shows that a brief pullback attempt fails, leaving the gap intact as support. Here’s the step-by-step guide.
Start with the Big Picture
This pattern forms within an active uptrend. Price gaps higher and holds that gap, confirming that bulls remain in control.
Trace the Three-Candle Sequence
The pattern unfolds in three parts:
- First Candle: A long bullish candle, driving the uptrend higher.
- Second Candle: Another bullish candle, gapped up from the first candle, extending the rally.
- Third Candle: A bearish candle that opens within the second candle’s body and closes lower, but does not fill the gap, showing sellers can’t erase the advance.
Zero in on the Confirmation Level
The confirmation level is the high of the second candle. A close above this level signals fresh strength, while the unfilled gap itself already validates the continuation.
Watch the Continuation
The bullish signal strengthens when price closes above the second candle’s high or simply continues upward. This is your entry point, with the gap acting as new support.
Check Volume for Additional Confirmation
Volume behavior usually follows this path:
- Rises on the first and second candles, confirming strong demand.
- Dips on the third candle, reflecting temporary hesitation.
- Surges again on confirmation, reinforcing the bullish continuation.
Rise Thrust: Measure the gap size, use nearby resistance levels, or apply Fibonacci extensions to project an upward price target from the third candle’s close.
How to Trade the Upside Tasuki Gap Pattern (Trading Example)
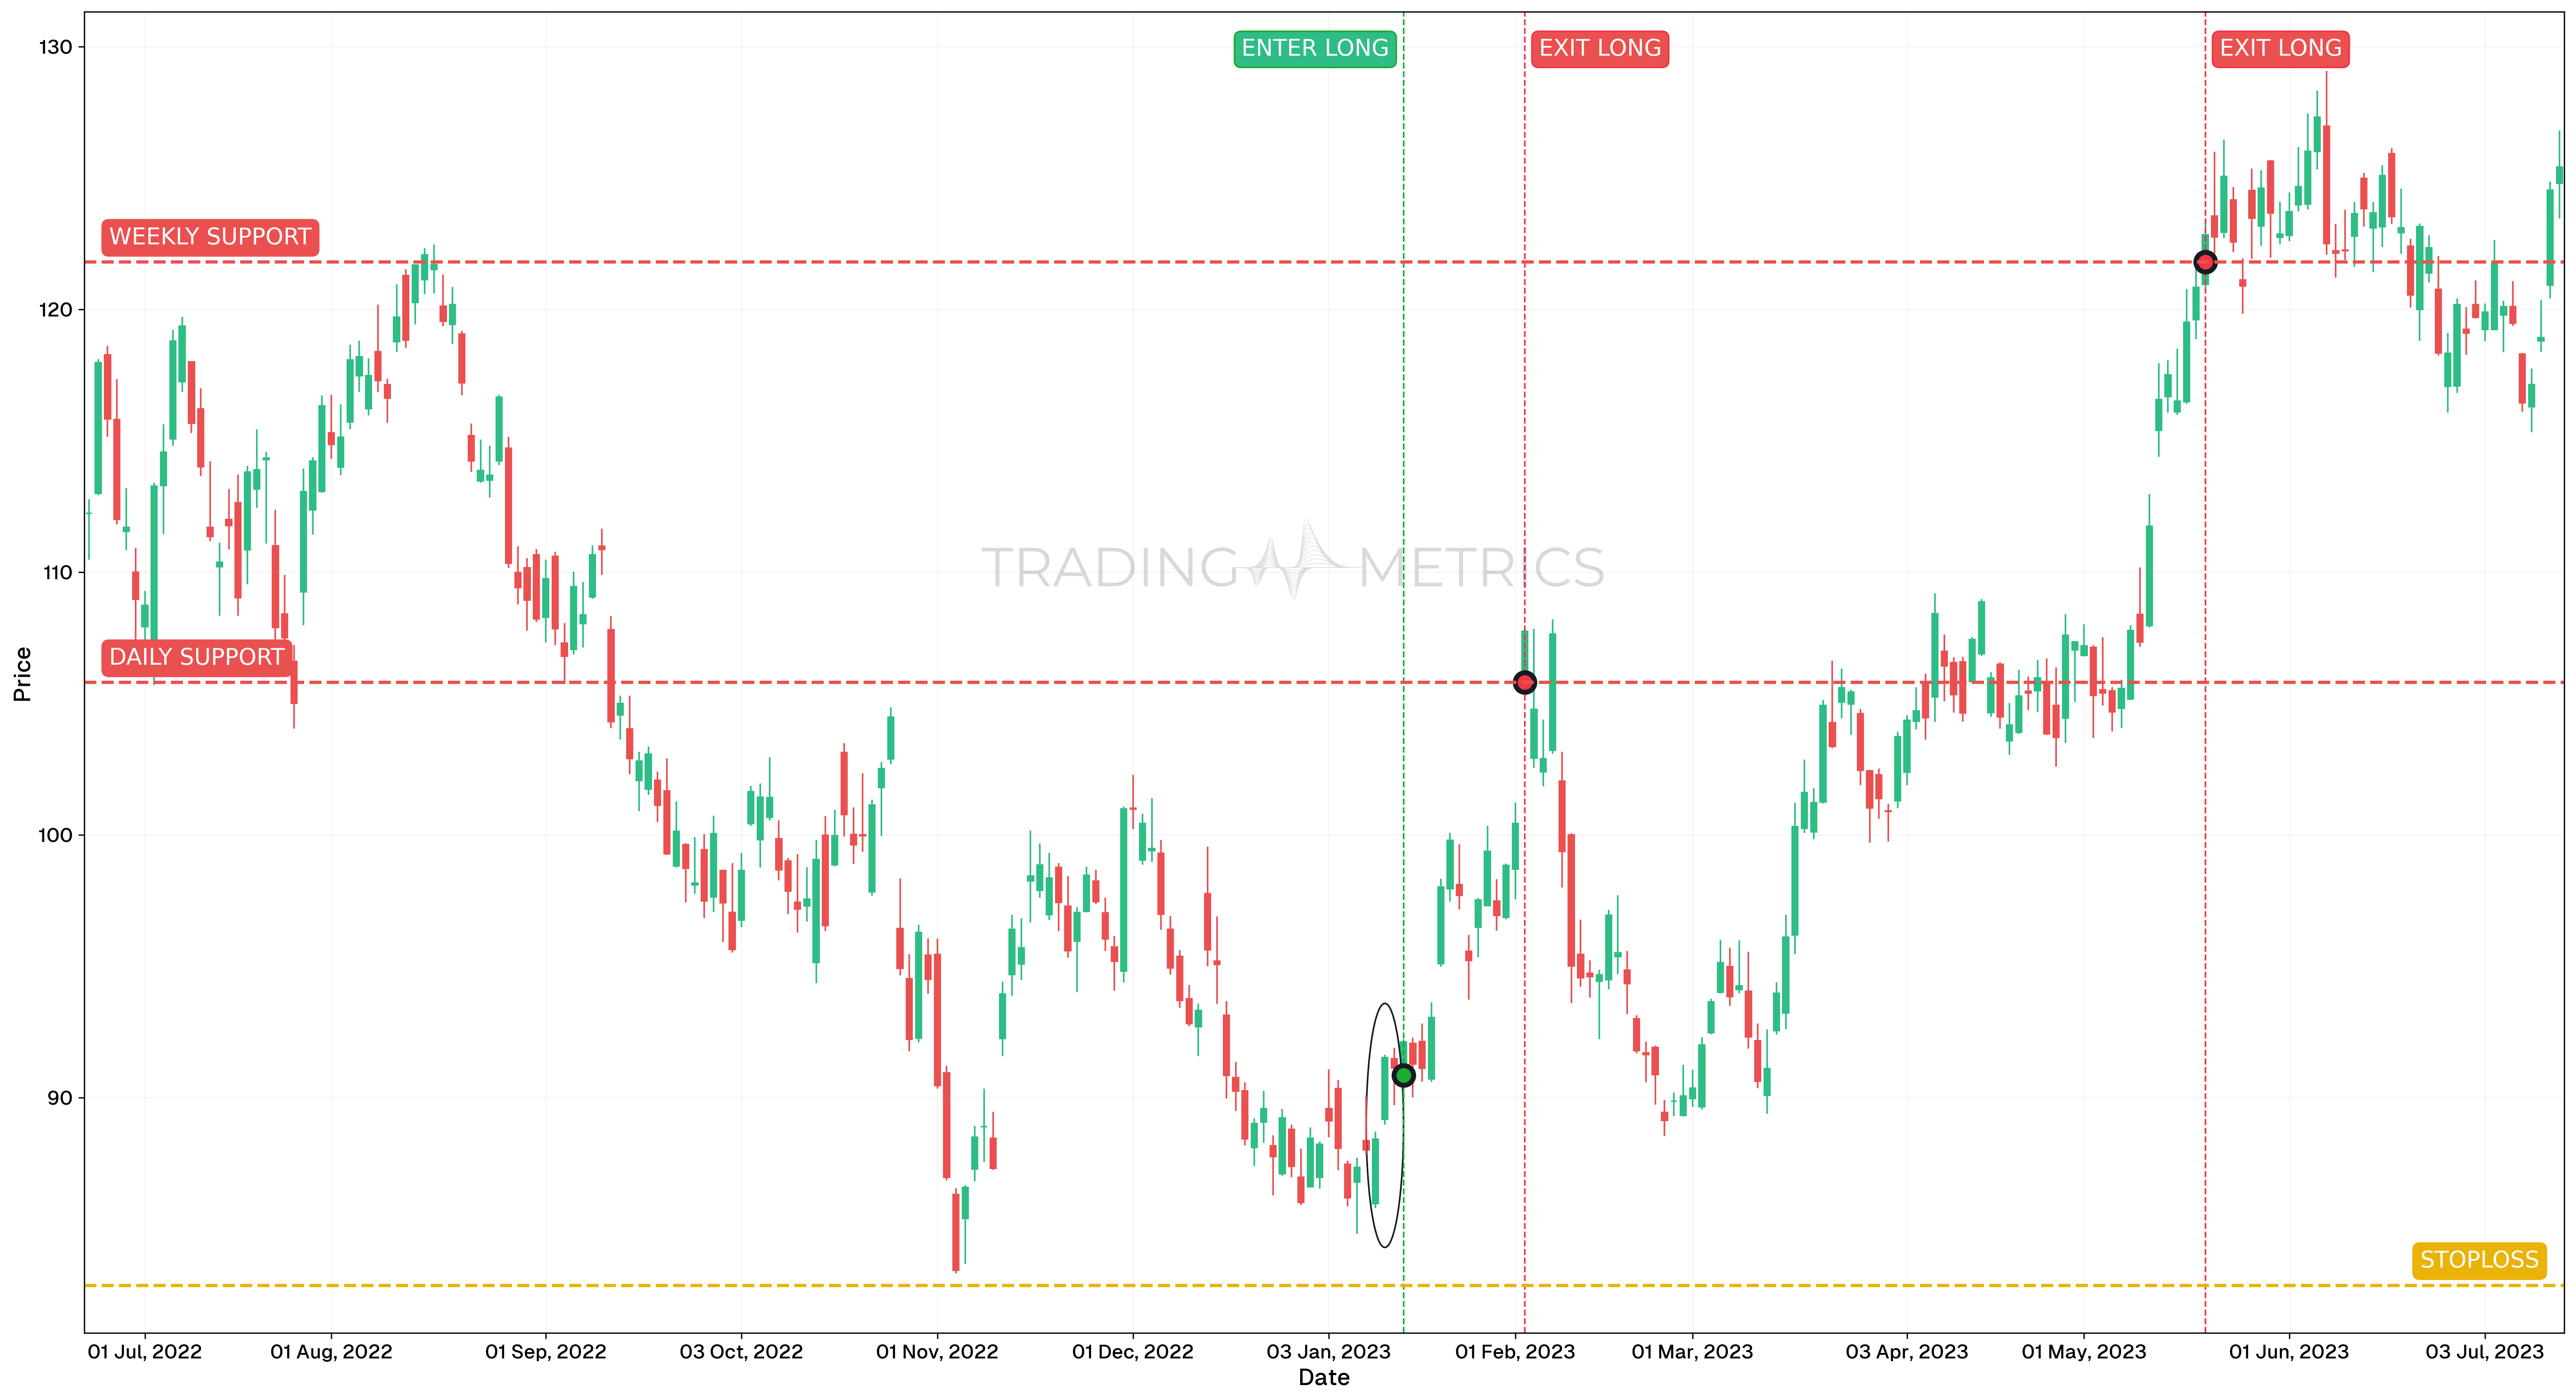
This example demonstrates the Upside Tasuki Gap pattern on GOOGL (daily chart), which appeared as a continuation signal during an active uptrend. The pattern suggested strength following a brief consolidation.
Analysis
On January 13, 2023, GOOGL formed a classic Upside Tasuki Gap pattern. This structure appeared in the middle of a growing bullish leg and confirmed trend continuation. A bullish gap was followed by a small red candle, which held support above the gap zone.
Trade Setup
-
Entry: The trade was entered on January 13, 2023, at $90.85, as the pattern completed and price continued to hold above the gap. Entry was confirmed by:
-
Exit: This position used a multiple target strategy, aligned with both daily and weekly support levels:
- TP1: February 2, 2023, at $105.80 (Daily Support)
- TP2: May 18, 2023, at $121.80 (Weekly Support)
-
Outcome: The Upside Tasuki Gap correctly signaled continuation within a broader bullish trend. Staggered exits allowed for controlled profit-taking while staying exposed to the trend.
Risk Management
- Stop-Loss placement: Just below the gap support zone, at $82.86, which would invalidate the pattern if broken.
- Position sizing: The trade was calculated using a 2% capital risk model, respecting the distance to the stop.
- Volatility Consideration: After consolidation and compression, Volatility expanded on the bullish gap, signaling renewed trend strength.
- Momentum Confluence: The confirmation from both RSI and StochRSI added conviction to the continuation thesis.
Volume Thrust: A volume spike on confirmation thrusts the pattern into a bullish climb, locking in the continuation’s force.
Pre-Trade Checklist
Thrust the Proof: Pair the pattern with volume surges and indicators like RSI to dodge fakes and boost your odds.
Key Points
- Gap Resistance: A clear gap with a failed bearish close boosts reliability - gap fills dilute it.
- Time Frame: Thrusts strongest on daily or weekly charts in uptrends.
- Combine with Indicators: Use moving averages or RSI to confirm the continuation.
- Breakout Confirmation: A close above the second candle’s high or sustained rise sets the thrust - third candle support is key.
- Price Target: Measure the gap size or use resistance levels for a target above the close.
- Risk Management: Set a stop-loss below the gap zone or the third candle’s low to limit losses if it reverses.
Wait for the Thrust: Acting before the third candle holds risks a Tasuki trap - let the continuation cut through.
Conclusion
The Upside Tasuki Gap pattern is a trader’s resilient tool for riding bullish continuations. Its gapped support, paired with volume, RSI, and moving averages, can thrust into big gains. Whether in crypto, stocks, or forex, this pattern sharpens your edge. Stay alert, manage your risk, and let the Tasuki gap hold - that persistent climb could rise into a winning trade.
Frequently Asked Questions
Quick answers based on this page's topic.
It represents a 'failed counter-attack' by bears. After a strong bullish gap, sellers attempt to drive the price back down to fill the void. When the third candle fails to close the gap, it proves that the bulls have successfully absorbed the selling pressure and are ready to resume the rally.
Look for two strong bullish candles separated by a gap, followed by a bearish candle that opens within the second candle's body. To remain valid, this third candle must not close below the high of the first candle, leaving the original gap partially open and intact.
It is most reliable on the Daily and 4-hour charts. On lower intraday timeframes, 'gaps' are often just minor liquidity voids that fill easily. On higher timeframes, the gap represents a significant institutional shift, making the Tasuki continuation much more powerful.