Trading the Bullish Abandoned Baby: Rare Reversal Pattern Guide
The Bullish Abandoned Baby is a rare bullish reversal pattern that appears at the bottom of a downtrend. It consists of a bearish candle, a Doji that gaps below, and a bullish candle that gaps back up. This signals exhausted bearish pressure and the start of an uptrend.
How to Identify the Bullish Abandoned Baby Pattern in Trading
The Bullish Abandoned Baby is a bullish reversal candlestick pattern. It appears at the bottom of a downtrend, marked by a Doji that is isolated between a bearish candle and a bullish candle, with gaps on both sides. This formation signals seller exhaustion and a sharp shift in momentum. Here’s the step-by-step guide.
Start with the Big Picture
This pattern shows up after a downtrend. It highlights seller exhaustion and a sudden bullish resurgence, making it one of the most reliable reversal signals due to its rarity.
Trace the Candle Sequence
The setup develops in three candles:
- First Candle: A long bearish candle, extending the downtrend with strong momentum.
- Second Candle: A Doji that gaps down from the first candle, with no overlap. Its isolation reflects indecision and sets the stage for reversal.
- Third Candle: A long bullish candle that gaps up from the Doji, closing well above and confirming bullish control.
Zero in on the Confirmation Level
The confirmation level is the high of the Doji. A close above this point strengthens the reversal, though the gap structure often speaks for itself.
Watch the Breakout
The bullish trigger comes when the third candle closes above the Doji’s high, completing the setup. That’s your entry point. (Because of the strong structure, traders often act immediately.)
Check Volume for Additional Confirmation
Volume behavior can validate the signal:
- Rises on the first candle, showing strong selling.
- Drops on the Doji, reflecting hesitation.
- Spikes on the third candle, reinforcing the bullish reversal.
Rise/Fall Gap: Measure the range between the Doji and the third candle or use nearby resistance levels to project a realistic price target in the direction of the breakout.
How to Trade the Bullish Abandoned Baby Pattern (Trading Example)
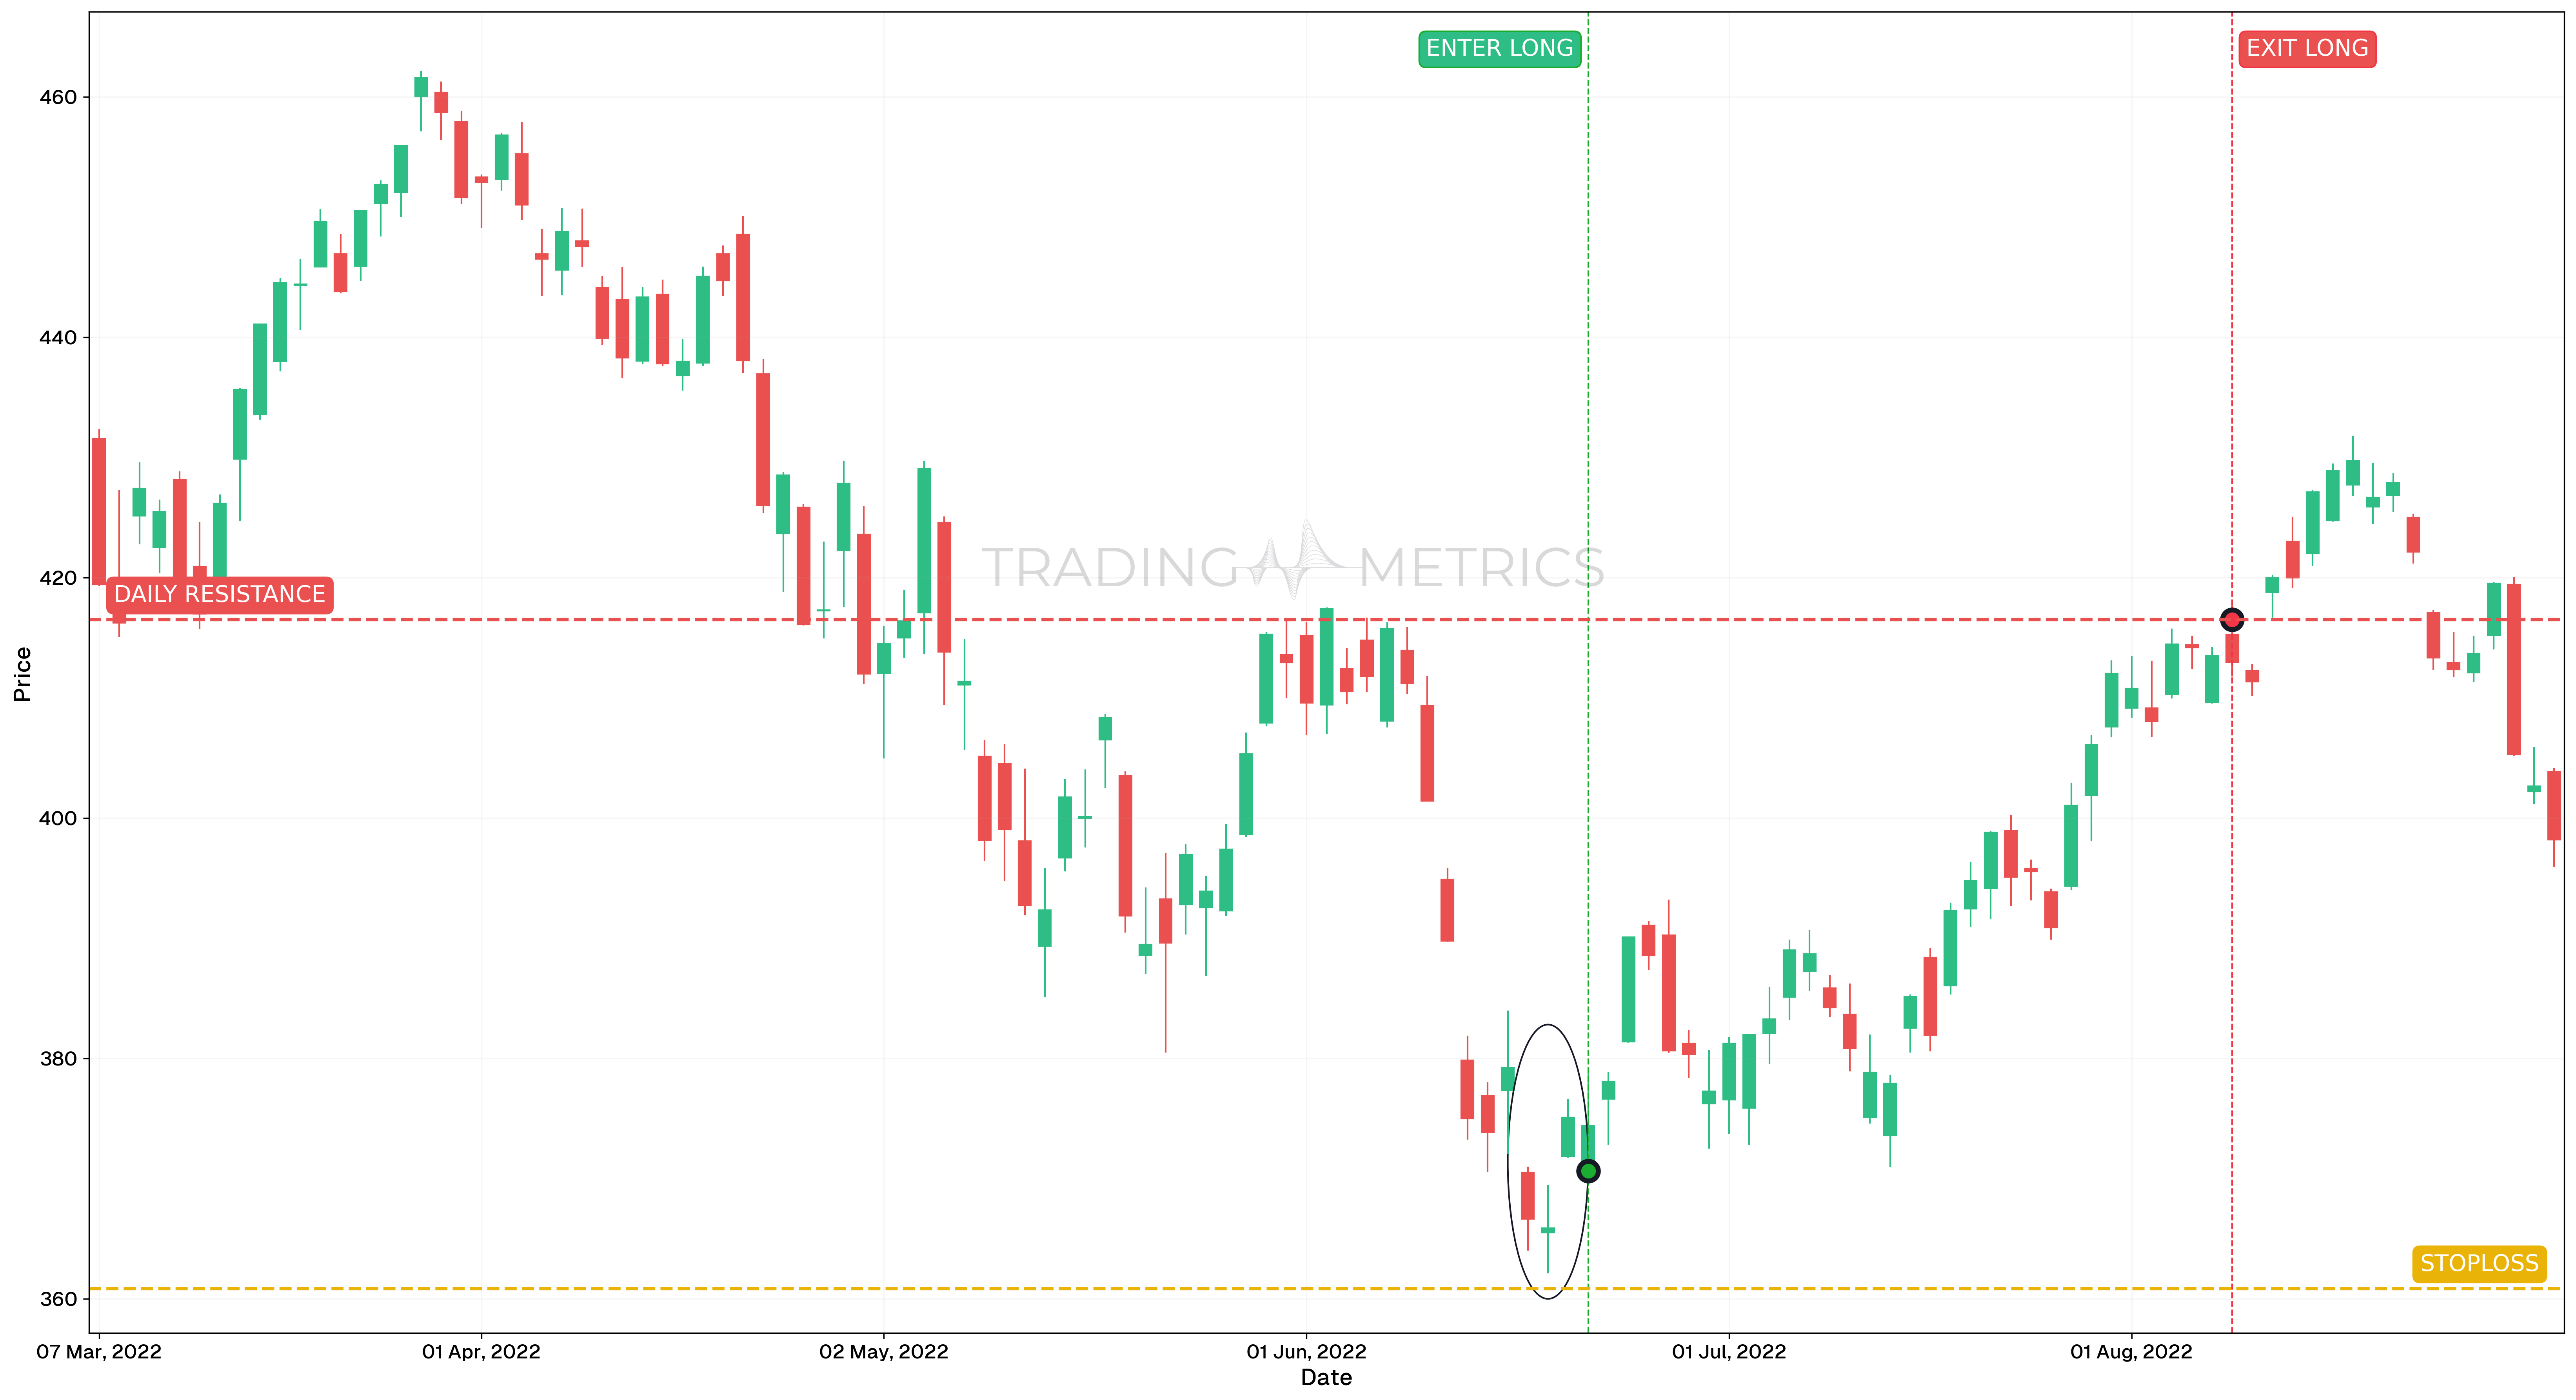
This trade example highlights a Bullish Abandoned Baby reversal pattern on the SPDR S&P 500 ETF TRUST (SPY) using the daily chart. It marked a potential bottom during a volatile correction, followed by a clean uptrend into higher resistance.
Analysis
On June 22, 2022, a textbook Bullish Abandoned Baby formed on the SPY daily chart. It followed an extended pullback and printed a gap-down doji between two strong-bodied candles. This signaled potential seller exhaustion and reversal strength.
Trade Setup
-
Entry: The trade was entered on June 22, 2022, at $370.62, immediately after the pattern completed and was confirmed by:
-
Exit: Position was closed on August 8, 2022, at $416.49, near daily resistance and following a completed measured move.
-
Outcome: The Bullish Abandoned Baby delivered a clean reversal from local lows. The upside target aligned with structural resistance, making it a high-reward exit zone.
Risk Management
- Stop-Loss placement: Below the lower wick of the abandoned doji at $360.85, invalidating the pattern if breached.
- Risk-Reward Ratio: 1:4.69, calculated based on entry, stop-loss, and the final exit at daily resistance.
- Position sizing: Based on a 2% capital risk model, the position size was tailored to the distance between entry and stop.
- Volatility Consideration: The pattern formed during heightened Volatility, followed by contraction and eventual breakout strength, confirming reversal momentum.
- Confirmation Signals: Momentum Indicators, gap structure, and bullish follow-through candle gave high confidence for this entry.
Volume Surge: A volume spike on the third candle lifts the pattern into a bullish rise, confirming the reversal’s strength.
Pre-Trade Checklist
Lift the Proof: Pair the pattern with volume surges and indicators like RSI to dodge fakes and boost your odds.
Key Points
- Gap Isolation: Distinct gaps before and after the Doji boost reliability - overlaps dilute it.
- Time Frame: Rises strongest on daily or weekly charts after downtrends.
- Combine with Indicators: Use moving averages or RSI to confirm the reversal.
- Breakout Confirmation: A close above the Doji’s high sets the rise - third candle strength is key.
- Price Target: Use resistance levels or Fibonacci Retracements of the prior downtrend as targets, rather than only the doji-to-third-candle rise.
- Risk Management: Set a stop-loss below the Doji’s low to limit losses if it fails.
Wait for the Rise: Acting before the third candle confirms risks an abandoned trap - let the reversal lift off.
Conclusion
The Bullish Abandoned Baby pattern is a trader’s rare and powerful tool for catching bullish reversals. Its isolated gaps, paired with volume, RSI, and moving averages, can soar into big gains. Whether in crypto, stocks, or forex, this pattern sharpens your edge. Stay vigilant, manage your risk, and let the abandonment resolve - that forsaken Doji could rise into a winning trade.
Frequently Asked Questions
Quick answers based on this page's topic.
It represents a 'failed liquidation.' After a long downtrend, the final sellers exhaust themselves on a gap-down (the Doji), but find no follow-through. When the next candle gaps upward, it proves that buyers have seized total control, leaving the previous sellers 'abandoned' at the lows.
The Abandoned Baby is significantly rarer. While a Morning Star requires three candles, it does not require gaps that isolate the middle candle. The strict 'no-overlap' requirement of the Abandoned Baby makes it a much stronger and more reliable signal for trend reversals.
The most objective stop-loss is placed just below the low of the isolated Doji. Since that low represents the absolute point of market capitulation, any price move back below that level invalidates the pattern and suggests the downtrend is resuming.