Rounding Bottom Pattern: A Slow Curve That Marks the Floor
The Rounding Bottom pattern is a smooth bullish reversal signal in technical analysis, often emerging after a prolonged downtrend. Picture it as a gentle U-shaped curve - price gradually bottoming out and then climbing - signaling a shift from despair to hope. When this pattern forms, it’s a quiet hint that bearish momentum is fading, offering traders a chance to buy or go long as an uptrend begins to take root.
How to Identify the Rounding Bottom Pattern in Trading
The Rounding Bottom is a bullish reversal formation. It develops slowly as a downtrend loses momentum, forming a U-shaped base before price pushes higher. The setup confirms when price breaks above resistance. Here’s how to spot it:
Start with the Big Picture
This pattern forms after a downtrend. Sellers control the market at first, but the gradual rounding action signals exhaustion and the return of buying pressure.
Trace the U-Shape
The Rounding Bottom unfolds over time. Identifying each stage confirms the setup.
- Initial Decline: Price trends steadily lower in the final phase of the downtrend.
- Bottom Formation: The descent slows, forming a curved base — the U.
- Gradual Rise: Price begins climbing, completing the structure.
Zero in on the Resistance Line
The resistance line (or neckline) is the horizontal ceiling that connects the start and end of the pattern. Once price breaks above it, the Rounding Bottom is complete.
Watch the Breakout
The bullish trigger comes when price closes above resistance.
- A decisive break over the neckline or
- A strong bullish candle
Both confirm the reversal and provide the entry.
Check Volume for Additional Confirmation
Volume behavior validates the move.
- Declines during the bottom, showing fading seller interest.
- Builds as the rise begins.
- Spikes on the breakout, confirming buyers are in control.
Aim Upward: Measure the height from the bottom to the resistance line and project it upward from the break for a realistic price target.
How to Trade the Rounding Bottom Pattern (Trading Example)
To illustrate how the Rounding Bottom pattern can be used to enter a trade, we will choose the BTCUSDT pair. This long-term structure occurred on the weekly chart, offering a rare but powerful reversal signal during Bitcoin’s early cycle.
Analysis
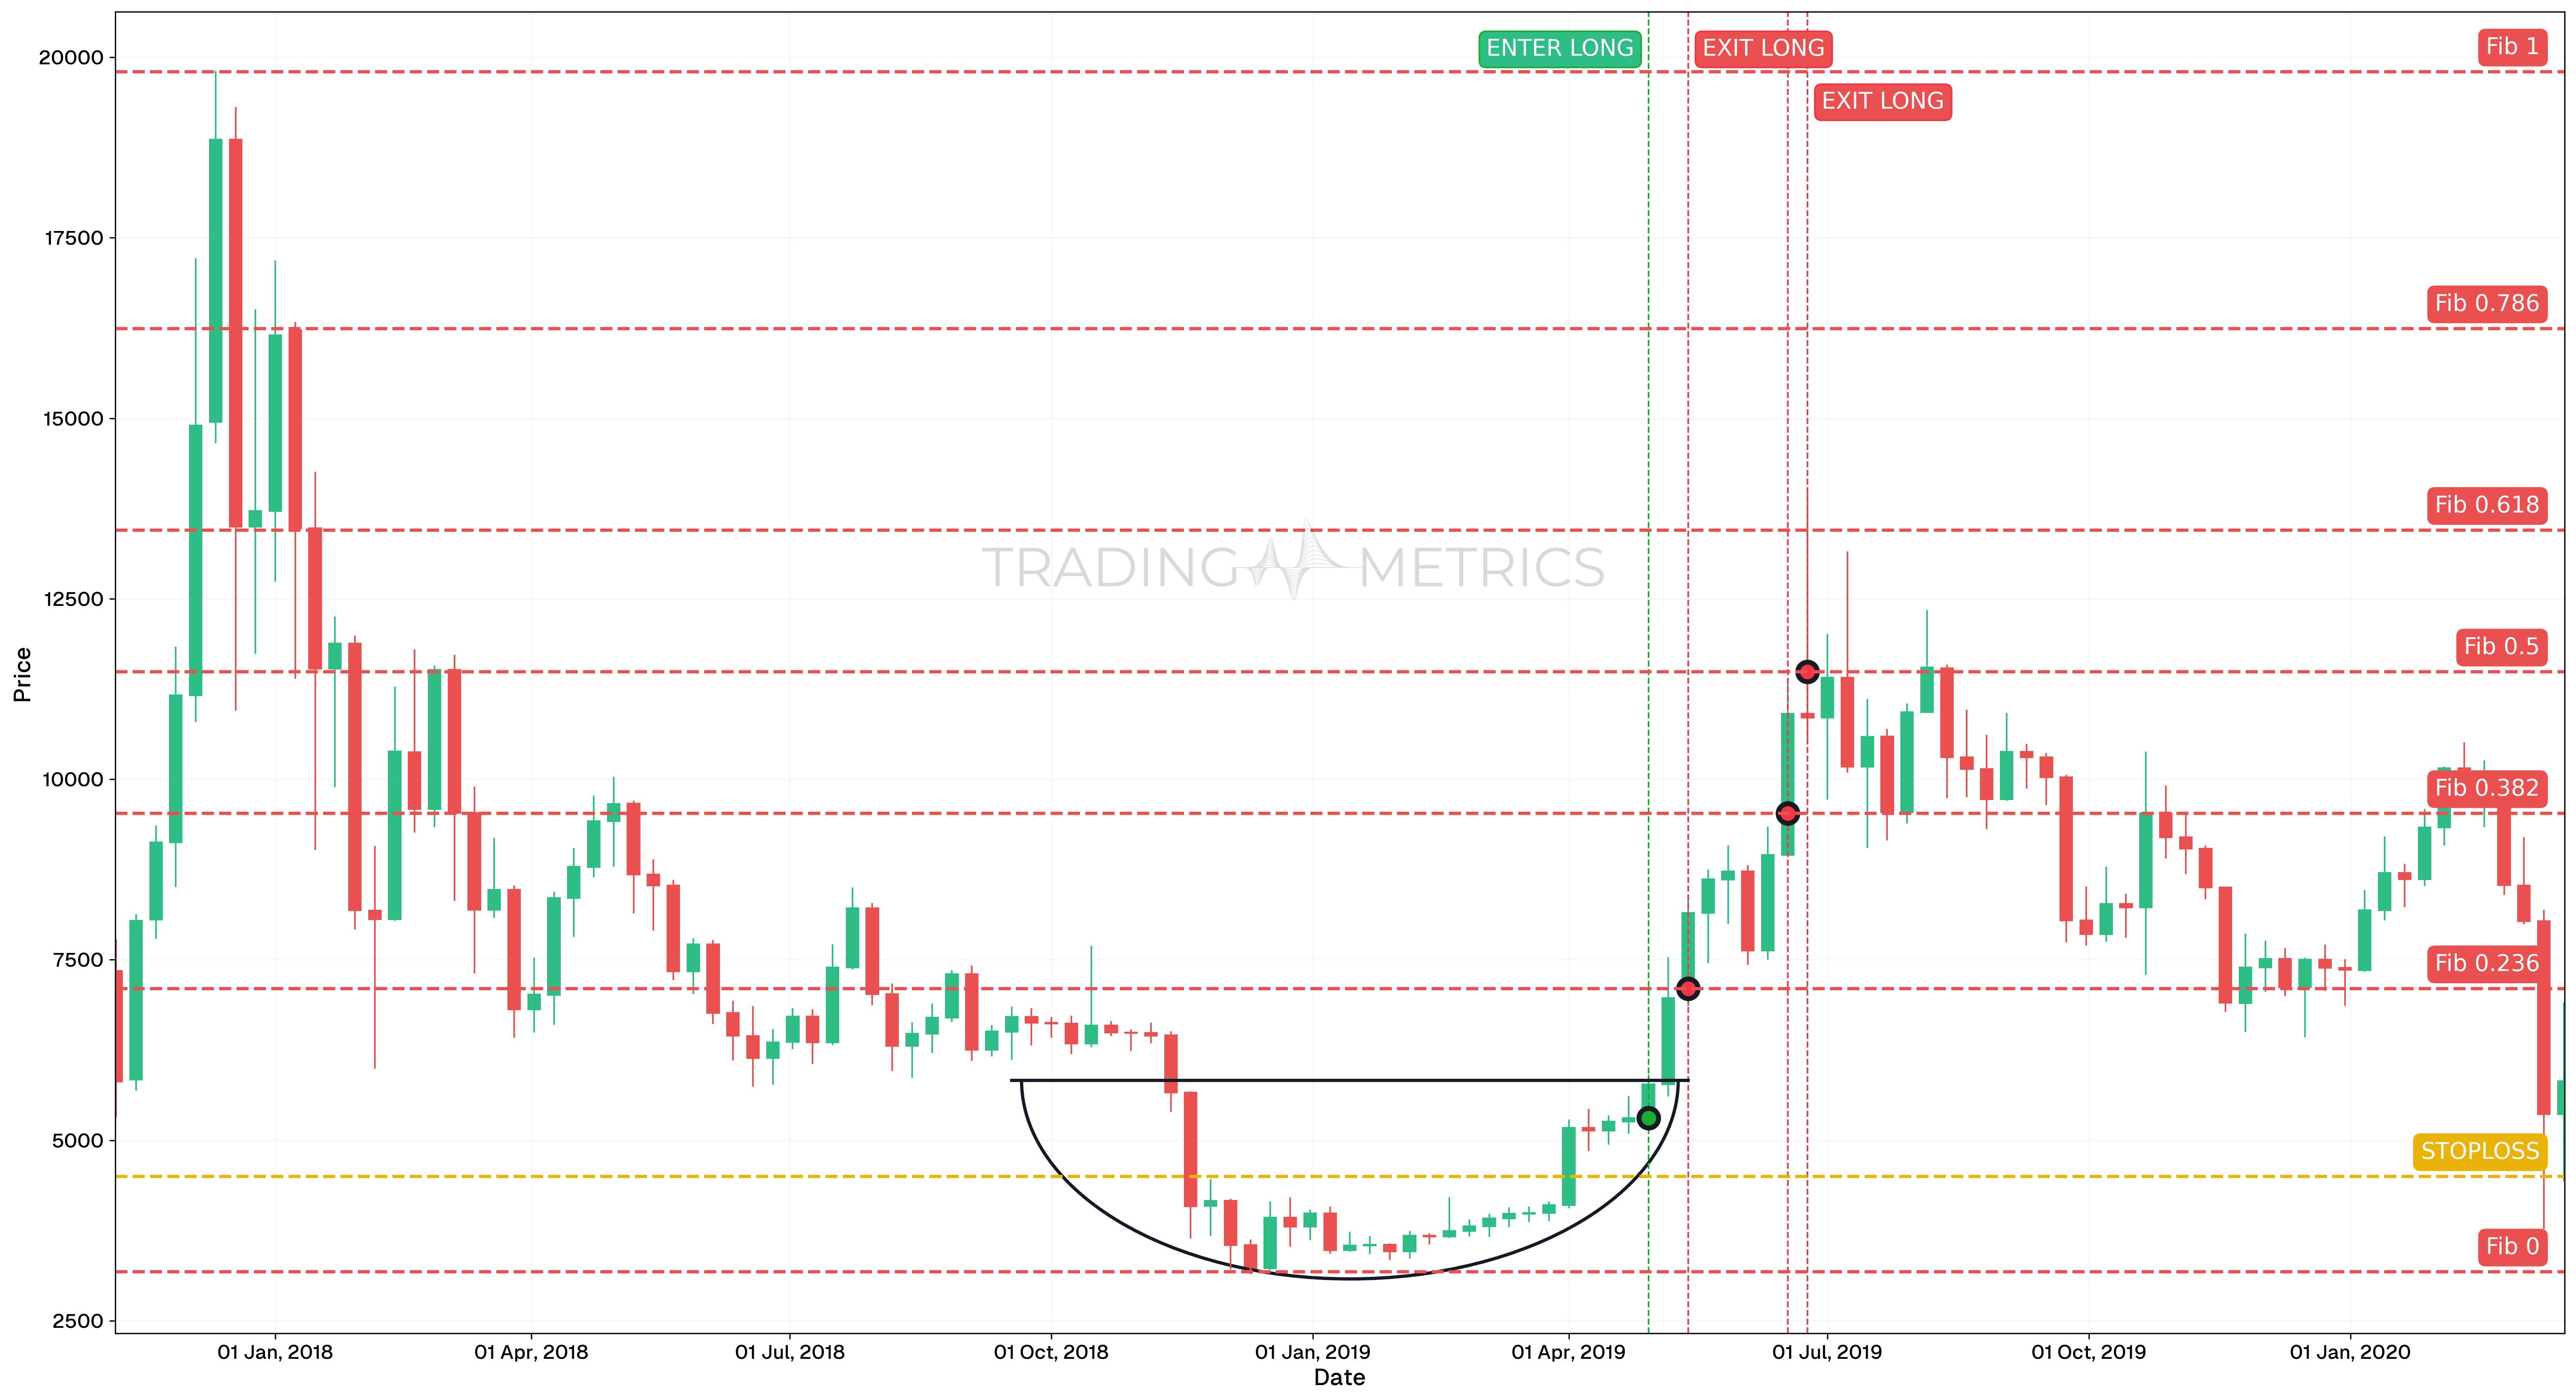
Between November 2017 and March 2020, BTCUSDT formed a textbook Rounding Bottom. After peaking in late 2017, the price declined gradually and eventually stabilized into a long accumulation curve. This structure reflected a slow shift from distribution to accumulation, with Volatility compressing toward the pattern’s base and expanding on breakout.
Trade Setup
-
Entry: The position was entered on April 29, 2019, at $4,497.79, after price moved up and away from the curve’s bottom. Entry was confirmed by multiple signals:
-
Exit: This trade was exited in multiple stages, each aligned with key Fibonacci Retracement levels:
- 13th May 2019 (TP1): 0.236 level hit at $7,099.72.
- 17th June 2019 (TP2): 0.382 level hit at $9,526.48.
- 24th June 2019 (TP3): 0.5 level hit at $11,487.84.
-
Outcome: The Rounding Bottom produced a clean and powerful reversal that was effectively captured using technical and Fibonacci-based exit strategies. Splitting exits helped lock in gains at multiple levels during the parabolic rise.
Risk Management
- Stop-Loss placement: The stop-loss was set at $4,497.79, directly at the entry candle’s low. This placement allowed tight risk control while validating the breakout beyond the rounding base structure.
- Position sizing: The trade used a 2% capital risk model, with position size calculated based on the eventual stop-loss placement.
- Volatility Consideration: Volatility was heavily compressed in the base of the pattern, and expanded aggressively on breakout. Entry was taken after structure and momentum aligned to reduce false signal risk.
- Adaptive Exit Strategy: Staggered Fibonacci exits allowed the trader to manage uncertainty, locking in profit while maintaining exposure as the trend extended.
Volume Curve: A volume spike on the resistance break smooths the pattern into a bullish lift.
Pre-Trade Checklist
Curve the Odds: Pair the pattern with volume surges and indicators like RSI to cut noise and boost accuracy.
Key Points
- Curve Clarity: A smoother U-shape strengthens the signal - jagged moves dilute it.
- Time Frame: Best on daily or weekly charts for clear trends.
- Combine with Indicators: Use moving averages or RSI to refine your entry.
- Breakout Confirmation: The resistance break flips the switch - don’t move too soon.
- Price Target: Measure from bottom to resistance, project up from the break for your goal.
- Risk Management: Set a stop-loss below the bottom to cap losses if it fails.
Wait for It: Acting before the resistance break risks a flat curve - let it round out.
Conclusion
The Rounding Bottom pattern is a subtle yet potent tool for catching bullish reversals. Its gentle U-shape, paired with volume, RSI, and moving averages, can pave the way for big gains. Whether in crypto, stocks, or forex, this pattern sharpens your play. Be patient, manage your risk, and let the curve deepen - that slow turn could lift you to a winning rise.
Frequently Asked Questions
Quick answers based on this page's topic.
The Rounding Bottom (or 'Saucer') represents a gradual, long-term shift in sentiment. Instead of a sharp bounce, sellers slowly lose interest as buyers gradually increase their accumulation. This smooth transition creates a U-shape that signals a sustainable trend change.
The reversal is confirmed when the price breaks and closes above the 'neckline' resistance level at the base of the saucer. Because the bottom took a long time to form, the resulting breakout is often the start of a prolonged bull market.
Yes. Volume typically mirrors the price curve: falling as the price reaches the bottom (neutrality) and steadily surging as the price begins its gradual ascent toward the breakout point.