Falling Wedge Pattern: A Slow-Decline Setup That Breaks Up
The Falling Wedge pattern is a sly bullish reversal signal in technical analysis, often sneaking in after a downtrend. Visualize it as a narrowing descent - price squeezing between converging trendlines - before breaking upward. When this pattern appears, it’s a subtle clue that bearish momentum is tapering off, giving traders a shot to buy or go long as an uptrend looms on the horizon.
How to Identify the Falling Wedge Pattern in Trading
The Falling Wedge is a bullish reversal formation. It develops when price trends lower inside a narrowing channel, with lower highs and lower lows converging. The setup confirms when price breaks above resistance. Here’s how to spot it:
Start with the Big Picture
This pattern appears after a downtrend. Sellers remain active, but the contracting structure shows their pressure is fading, signaling a potential shift toward buyers.
Trace the Converging Trendlines
The wedge is defined by two lines moving closer together. Spotting this compression is key to identifying the setup.
- Upper Trendline: Price makes lower highs, sloping downward.
- Lower Trendline: Price makes lower lows, but at a slower pace, converging toward the upper line.
- Wedge Formation: The channel tightens as both lines draw together, reflecting weakening selling pressure.
Zero in on the Resistance Line
The resistance line is the upper boundary of the wedge. It marks the level where sellers have repeatedly capped rallies. Once this line is tested, the pattern nears completion.
Watch the Breakout
The bullish trigger comes when price closes above resistance.
- A decisive break over the upper trendline or
- A strong bullish candle
Both confirm the wedge has resolved upward and provide the entry.
Check Volume for Additional Confirmation
Volume action helps validate the reversal.
- Declines as the wedge narrows, showing fading participation.
- Spikes on the breakout, confirming that buyers are back in control.
When that surge appears, the Falling Wedge’s bullish reversal is confirmed.
Reach Up: Measure the height of the wedge at its widest point and project it upward from the break for a reliable price target.
How to Trade the Falling Wedge Pattern (Trading Example)
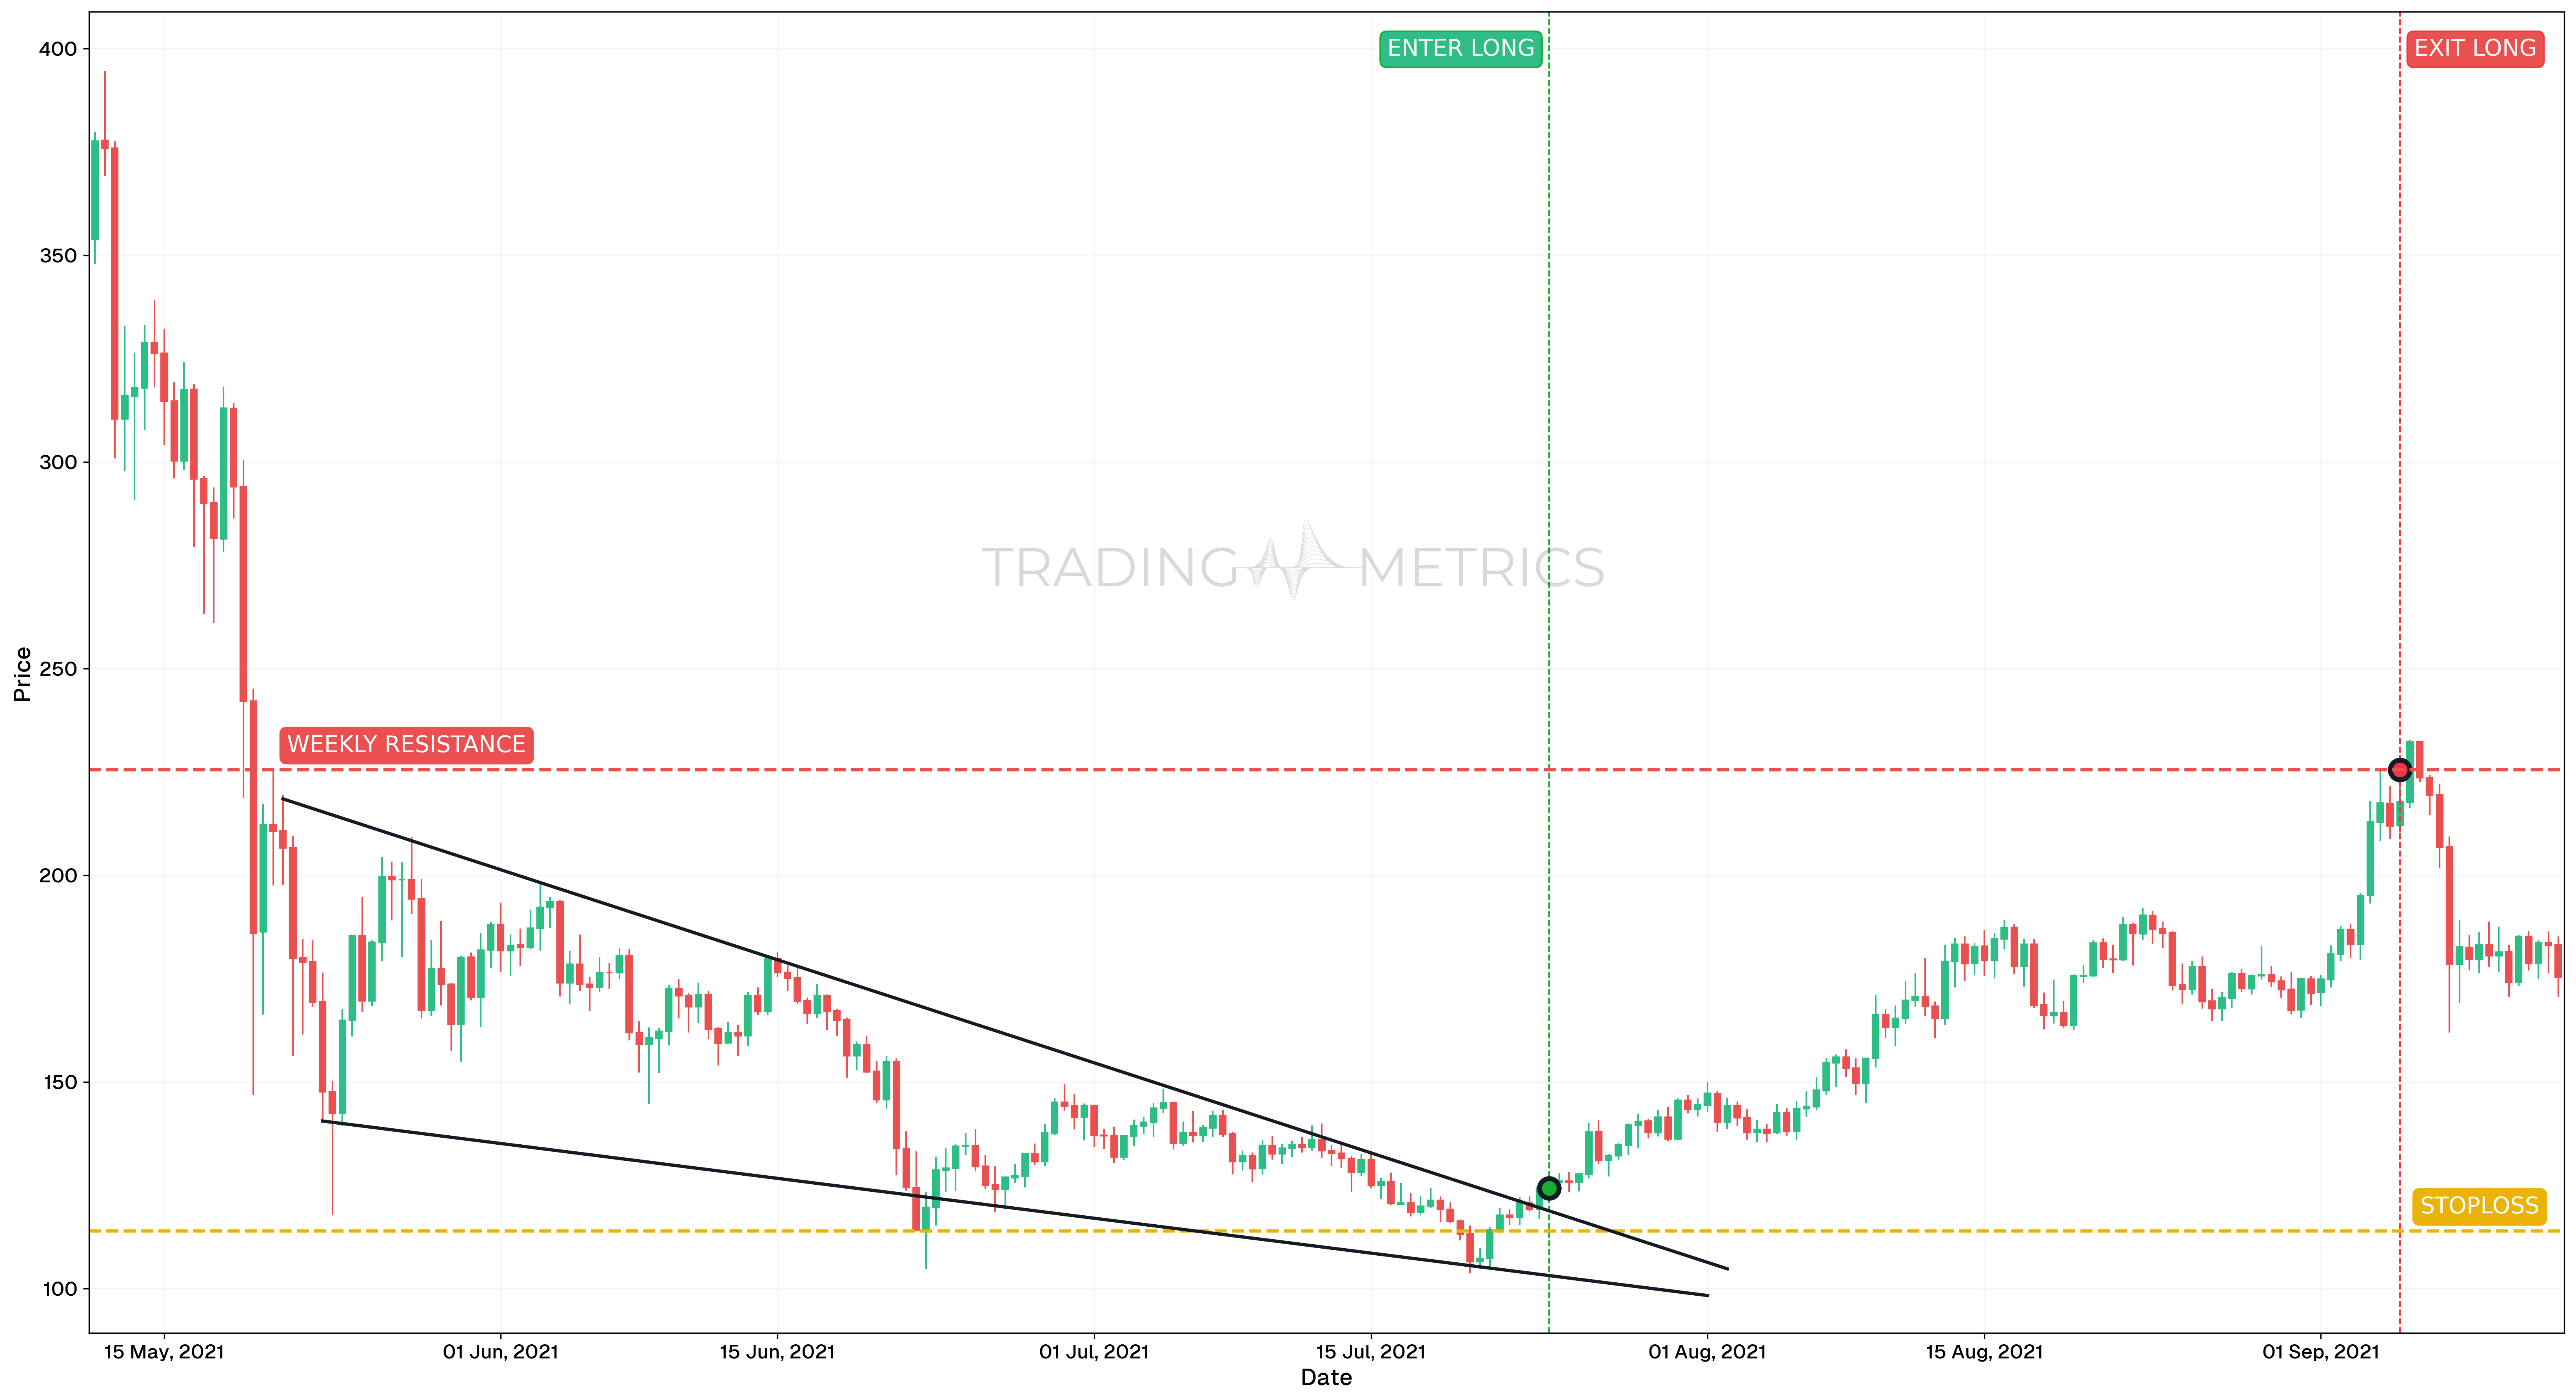
To illustrate how the Falling Wedge pattern can be used to enter a trade, we will choose the LTCUSDT pair. This setup occurred on the 12-hour chart, offering a medium-term breakout opportunity within a broader downtrend.
Analysis
Between May and late July 2021, LTCUSDT formed a classic Falling Wedge pattern. The price consolidated with lower highs and lower lows, but with range contraction suggesting diminishing bearish momentum. Volume declined during the wedge formation, which is typical for this reversal structure. The breakout in late July completed the pattern.
Trade Setup
- Entry: The long position was entered on July 24, 2021, at $124.27, immediately following a breakout above the wedge’s upper boundary. Several confluences supported this entry:
- A Bullish Harami Cross candlestick pattern appeared a few candles earlier
- RSI had crossed above 50, showing strengthening bullish momentum
- The price had cleanly broken out of the descending structure, signaling trend reversal
- Exit: The position was closed on September 5, 2021, at $225.50, as price reached a previous support-turned-resistance zone. This structural level was used to protect gains after a strong rally.
- Outcome: The Falling Wedge breakout produced an 81.4% gain from entry to exit. The pattern offered excellent risk efficiency and clean momentum alignment.
Risk Management
- Stop-Loss placement: The stop-loss was placed at $113.89, just below the wedge’s lower boundary and recent swing low. This protected the trade in case the breakout failed.
- Position sizing: A 2% capital risk model was used, with position size based on the entry-to-stop distance.
- Risk-Reward Ratio: The setup delivered a Risk-Reward Ratio of 1:9.75, making it a high-efficiency trade with strong reward-to-risk dynamics.
- Volatility Consideration: The wedge formed during declining Volatility, which then expanded significantly on breakout. This helped confirm strength and gave price room to trend.
- Adaptive Exit Strategy: A more aggressive exit could have targeted the $250-$260 region, but exiting at the structural resistance offered a disciplined, high-probability closure point.
Volume Wedge: A volume spike on the resistance break wedges the pattern into a bullish rise.
Pre-Trade Checklist
Wedge It Tight: Pair the pattern with volume pops and indicators like RSI to cut fakes and boost your edge.
Key Points
- Line Convergence: The tighter the wedge, the stronger the signal - sloppy lines dilute it.
- Time Frame: Hits hardest on daily or weekly charts.
- Combine with Indicators: Use moving averages or RSI to nail the timing.
- Breakout Confirmation: The resistance break turns the tide - don’t jump early.
- Price Target: Measure the wedge’s widest height, project up from the break for your mark.
- Risk Management: Set a stop-loss below the lowest low to cap losses if it flops.
Hold the Line: Acting before the resistance break risks a wedge-shaped trap - wait for the snap.
Conclusion
The Falling Wedge pattern is a clever tool for snagging bullish reversals. Its narrowing descent, paired with volume, RSI, and moving averages, can carve out big wins. Whether in crypto, stocks, or forex, this pattern hones your game. Stay cool, manage your risk, and let the wedge tighten - that squeeze could spring into a profitable rise.
Frequently Asked Questions
Quick answers based on this page's topic.
The narrowing range indicates 'selling exhaustion.' Even though prices are dropping, the distance between lower highs and lower lows is shrinking, showing that sellers are struggling to maintain momentum. This pressure cooker effect usually results in a sharp breakout to the upside.
A Descending Triangle has a flat support floor, which is bearish. A Falling Wedge has two downward-sloping lines that converge. Because the sellers are being forced into a tighter corner at lower prices, it is almost always a bullish reversal signal.
To find the target, measure the vertical distance between the two trendlines at the widest point of the wedge (its start). Project that same distance upward from the resistance break for your objective 1:1 mathematical goal.