Master the Marubozu Candlestick: Trading Strong Trend Momentum
The Marubozu is a powerful candlestick with a long body and no shadows, showing complete control by either buyers or sellers. A Bullish Marubozu signals strong buying pressure, often driving continuation in an uptrend or reversal from a decline. A Bearish Marubozu reflects aggressive selling, pointing to downside continuation or reversal from a rally. Because of its clarity, this pattern highlights dominant momentum and is most effective when aligned with key support or resistance levels.
How to Identify the Marubozu Pattern in Trading
Spotting a Marubozu means recognizing a single candlestick with a long body and minimal shadows, signaling strong momentum in its direction - bullish or bearish - depending on context. It’s about unwavering force. Here’s the step-by-step guide.
Understand the Basics of the Marubozu Pattern
The Marubozu is a decisive candlestick that reflects dominant market pressure — either buying or selling — depending on context.
- Bullish Marubozu: Appears in an uptrend, showing strong buying and likely continuation, or after a downtrend, hinting at a reversal if confirmed.
- Bearish Marubozu: Appears in a downtrend, showing strong selling and likely continuation, or after an uptrend, suggesting a reversal if confirmed.
Look for the Candlestick Shape in Price Movement
A single candle with a long body and little to no shadows.
- Bullish Marubozu: Opens near the low, closes near the high → relentless buying.
- Bearish Marubozu: Opens near the high, closes near the low → persistent selling.
Identify the Confirmation Level
- Bullish Marubozu: Close above the Marubozu’s high confirms buying strength.
- Bearish Marubozu: Close below the Marubozu’s low confirms selling pressure.
Confirm the Pattern with Post-Marubozu Action
- Bullish Marubozu: Next candle closing strong above the high signals continuation or reversal up.
- Bearish Marubozu: Next candle closing strong below the low signals continuation or reversal down.
Check Volume for Extra Confidence
Marubozu candles often come with rising volume, signaling conviction. Confirmation with steady or increasing volume strengthens both bullish and bearish outcomes.
Range Thrust: Measure the Marubozu body height and project it upward from the close, or use nearby resistance levels for a potential price target.
How to Trade the Marubozu Pattern (Trading Example)
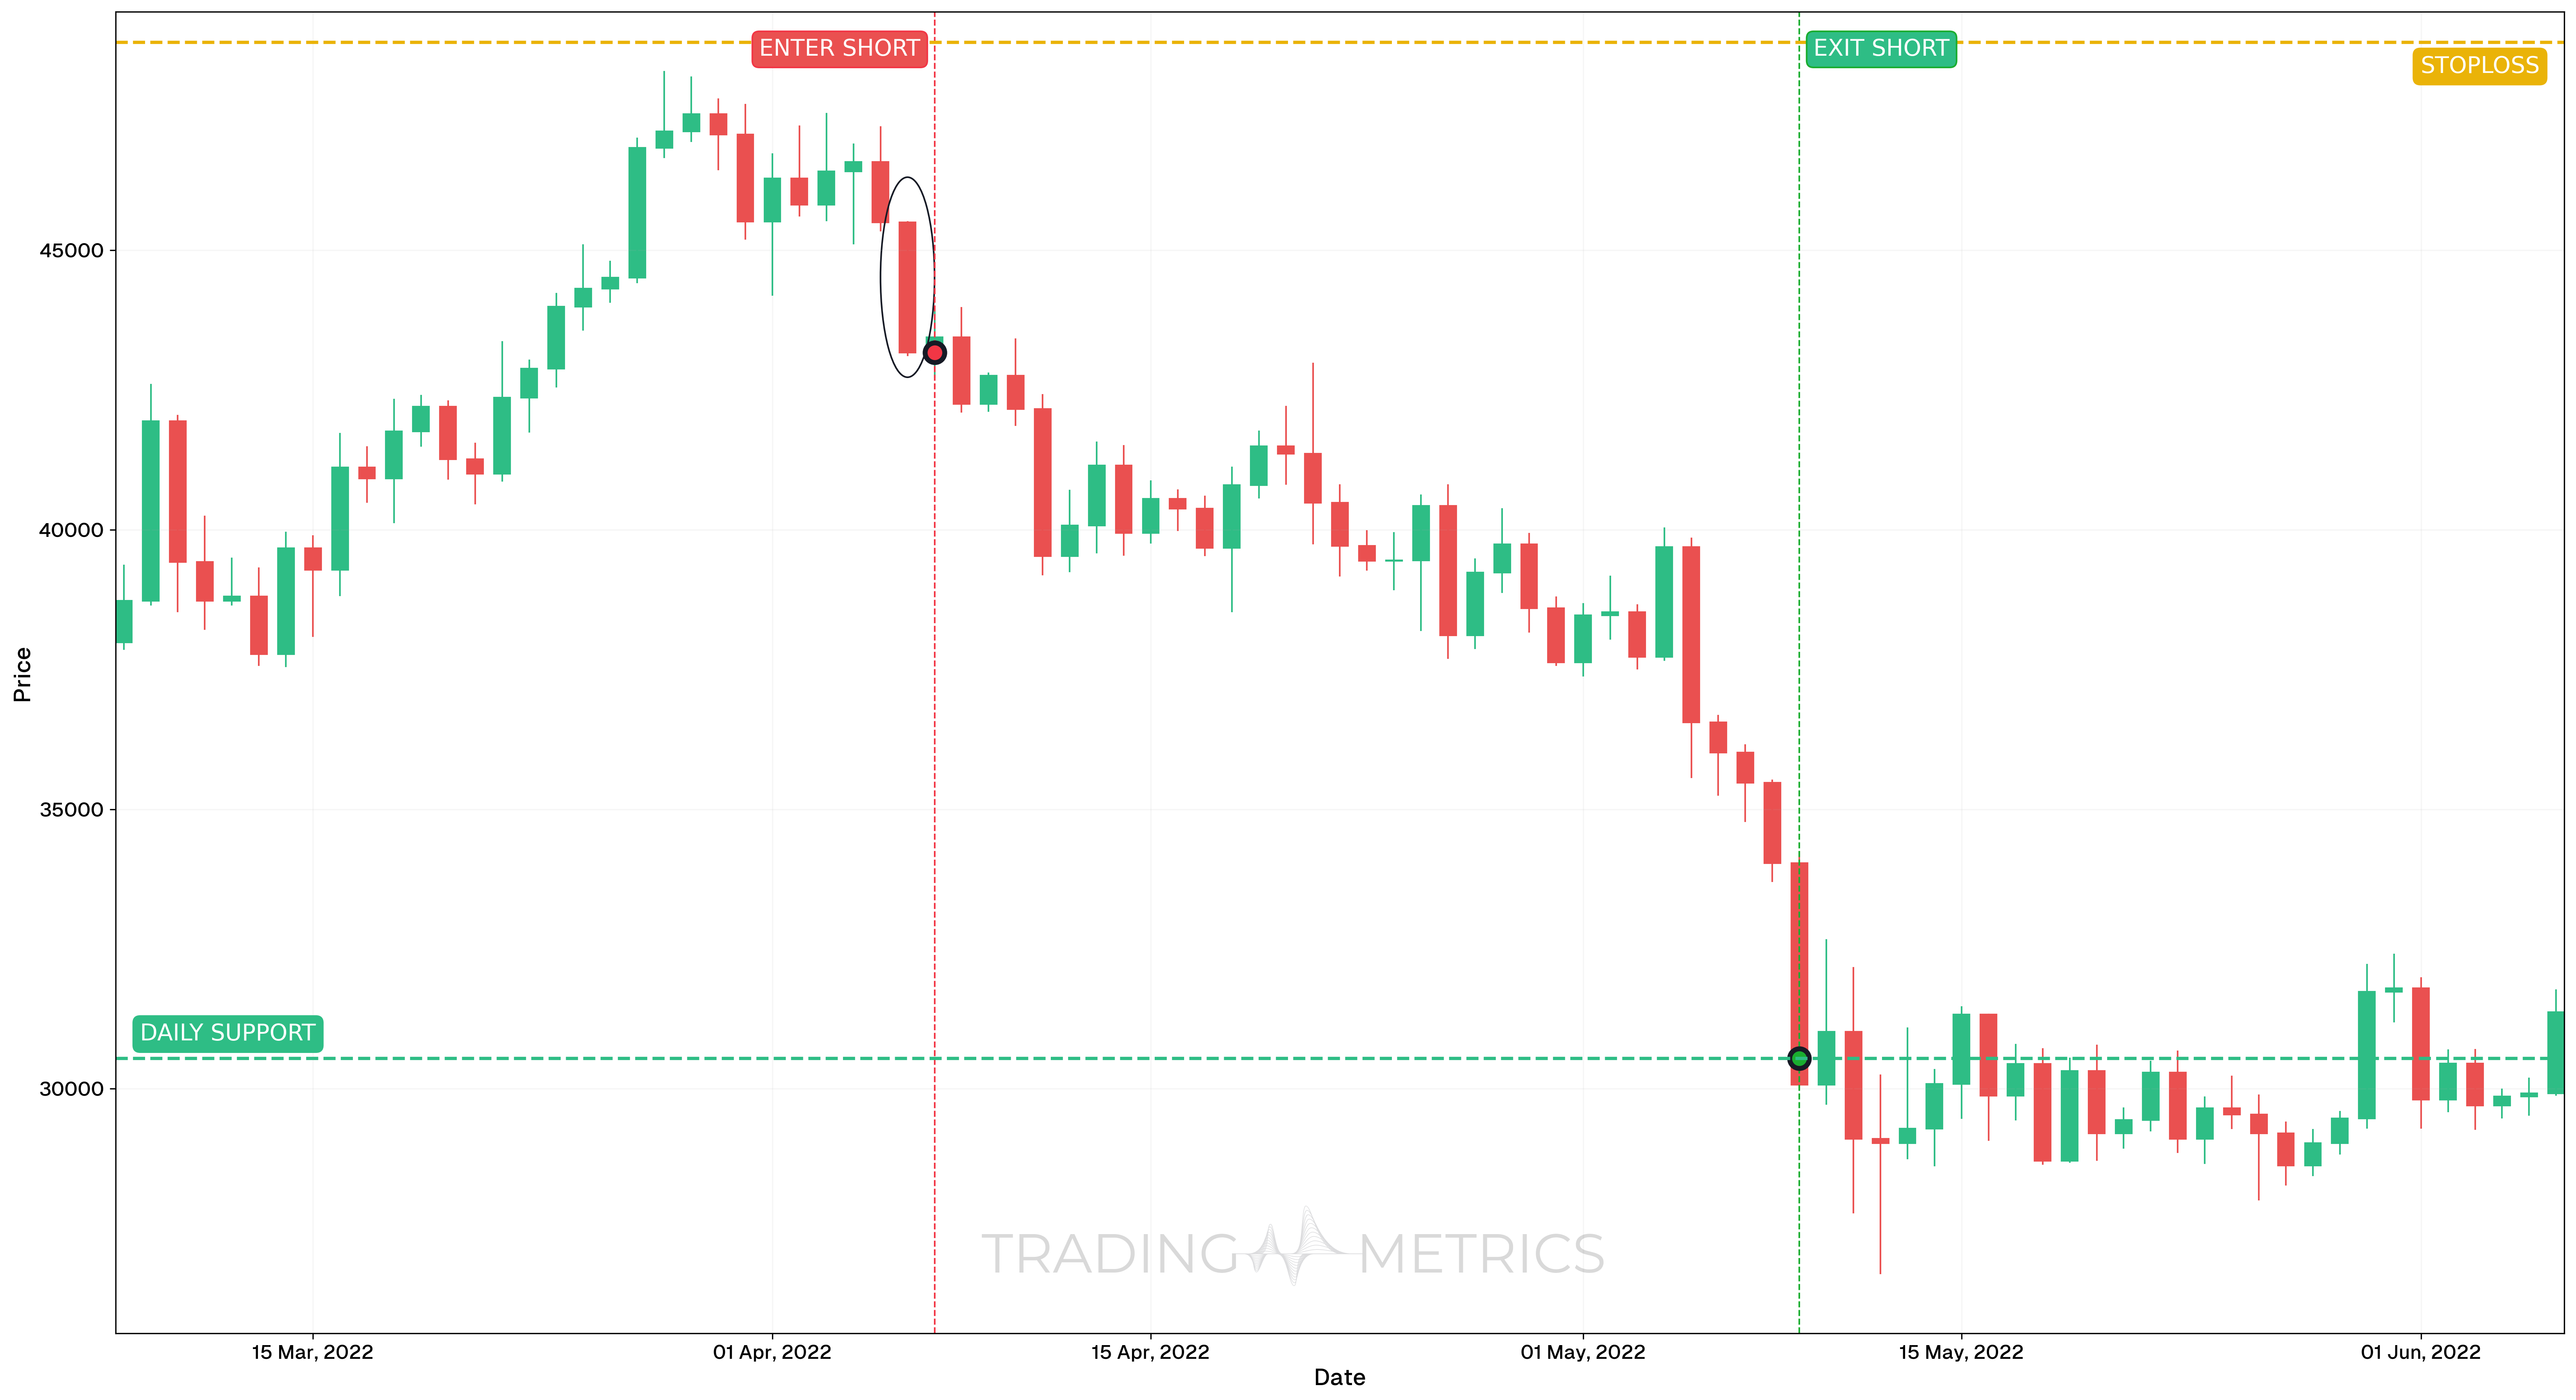
To illustrate how the Marubozu pattern can be used to enter a trade, we will choose the BTCUSDT pair. This pattern appeared on the daily chart during a shift in trend, offering a high-conviction bearish entry with momentum confirmation.
Analysis
On April 7, 2022, BTCUSDT printed a strong Marubozu candle with virtually no wicks, signaling aggressive selling pressure and a clear shift in control to bears. The formation followed a period of upward exhaustion, breaking down from local structure support.
Trade Setup
-
Entry: The short position was initiated on April 7, 2022, at $43,191.57, following the formation of the Marubozu candle. The following confluence supported the setup:
- RSI had crossed below 50 and was falling, indicating growing downside momentum
-
Exit: The position was closed on May 9, 2022, at $30,545.50, near a previous support/resistance zone. This was a logical structural level that had acted as a base during prior consolidation.
-
Outcome: The Marubozu setup produced a 29.3% decline, reflecting strong momentum continuation from the breakdown candle.
Risk Management
- Stop-Loss placement: The stop-loss was placed at $51,161.60, just above the recent high and invalidation level for the setup.
- Position sizing: A 2% capital risk model was used to size the position according to the distance between entry and stop.
- Risk-Reward Ratio: The trade delivered a Risk-Reward Ratio of 1:2.29, offering a solid risk-managed outcome with clear pattern-based conviction.
- Volatility Consideration: The trade occurred during a high Volatility phase, which is typical for Marubozu signals. This heightened volatility allowed for rapid movement once the candle confirmed breakdown.
- Adaptive Exit Strategy: While the trade used a fixed structure level for exit, further downside could have been targeted using Fibonacci extensions or a dynamic trailing method.
A volume spike on the Marubozu candle reinforces the move, whether bullish or bearish.
Pre-Trade Checklist
Prove the Thrust: Combine the pattern with volume surges and indicators like RSI to avoid traps and enhance precision.
Key Points
- Body Power: A long body with minimal shadows defines its strength - shadows reduce impact.
- Time Frame: Most effective on daily or weekly charts in trending markets.
- Combine with Indicators: Pair with moving averages or RSI to confirm momentum.
- Breakout Confirmation: A close above the high (bullish) or below the low (bearish) confirms direction - don’t guess early.
- Price Target: Use the body height or nearby support/resistance levels to estimate targets.
- Risk Management: Place a stop-loss outside the Marubozu’s range to protect against false moves.
Wait for Context: Entering without trend or structure risks misreading the Marubozu - let confirmation define the trade.
Conclusion
The Marubozu pattern, whether bullish or bearish, signals strong directional momentum. Its clean structure, backed by volume, RSI, and moving averages, makes it a reliable tool across markets. In bullish form, it highlights buying dominance and trend continuation or reversal from lows. In bearish form, it reflects strong selling pressure and potential breakdowns. Whether trading crypto, stocks, or forex, the Marubozu provides clarity for decisive entries. Stay disciplined, manage risk, and use confirmation to harness its power.
Frequently Asked Questions
Quick answers based on this page's topic.
A Marubozu is a single-candle pattern with a long real body and little to no wicks. It signals 'Total Conviction,' showing that one side of the market dominated from the opening bell to the closing bell without any significant retracement. It is the purest visual representation of directional momentum.
While usually a continuation signal in the middle of a move, a Marubozu appearing after an extended trend can signal 'Exhaustion' or a 'Blow-off top.' Its meaning depends on context: a breakout Marubozu is a high-probability entry, while a climax Marubozu suggests the move is overextended.
The most objective method is the 'Body Thrust' projection. Measure the vertical height of the Marubozu body and project that distance in the direction of the breakout. Because Marubozus represent strong institutional flow, price often reaches these targets quickly before encountering the next consolidation zone.