Rate of Change (ROC): How to Time Price Acceleration
The Rate of Change (RoC) is a momentum oscillator that measures the percentage change between the current price and the price a certain number of periods ago. It’s like the speedometer of trading - telling you how fast the price is moving in a particular direction.
In trading, it's not just about where the price is but how quickly it got there.
- Anonymous
How to Use Rate of Change?
The RoC helps traders identify trends, potential reversals, and the strength of price movements.
Here’s a step-by-step guide:
- Identify Trends: When RoC is above zero, the price is in an uptrend; below zero, it’s in a downtrend.
- Spot Reversals: Divergences between RoC and price may indicate a potential reversal. If prices are making new highs but RoC isn’t, it could signal a bearish reversal.
- Gauge Momentum: A rising RoC indicates increasing momentum, while a falling RoC shows decreasing momentum.
Lookback Period Flexibility: Adjust the ROC calculation period to suit your trading style - shorter periods capture quicker price shifts, while longer ones smooth out noise.
How to Calculate Rate of Change?
Here is step-by-step calculation of Rate of Change (RoC):
Determine the Time Period
Decide the number of periods (days, weeks, etc.) over which you want to measure the rate of change. Common periods include 10, 14, or 20 days for short-term analysis. In this example, we’ll use 10 days.
Find the Current Price
Identify the price of the asset at the end of the current period. Let’s say we’re analyzing a stock, and today’s closing price is $110.
Find the Price from the Previous Period
Look up the closing price of the asset from 10 periods ago. Assume the price 10 days ago was $100.
Apply the Rate of Change Formula
Use the RoC formula:
Plug in the values:
Calculate the Result
Perform the subtraction and division:
Simplify the calculation:
Interpret the Result
A RoC of 10% means that the price of the stock has increased by 10% over the last 10 days.
Combine for Clarity: Pair ROC with other indicators like moving averages or RSI to reduce false signals and enhance decision-making.
Importance of Rate of Change in Trading
The Rate of Change (ROC) is a important momentum indicator that measures the speed at which a security’s price changes over a specific period. It helps traders identify overbought or oversold conditions, trend strength, and potential reversals, much like StochRSI. By analyzing ROC, traders can better time their entries and exits while complementing other technical tools.
Bullish Momentum Trading
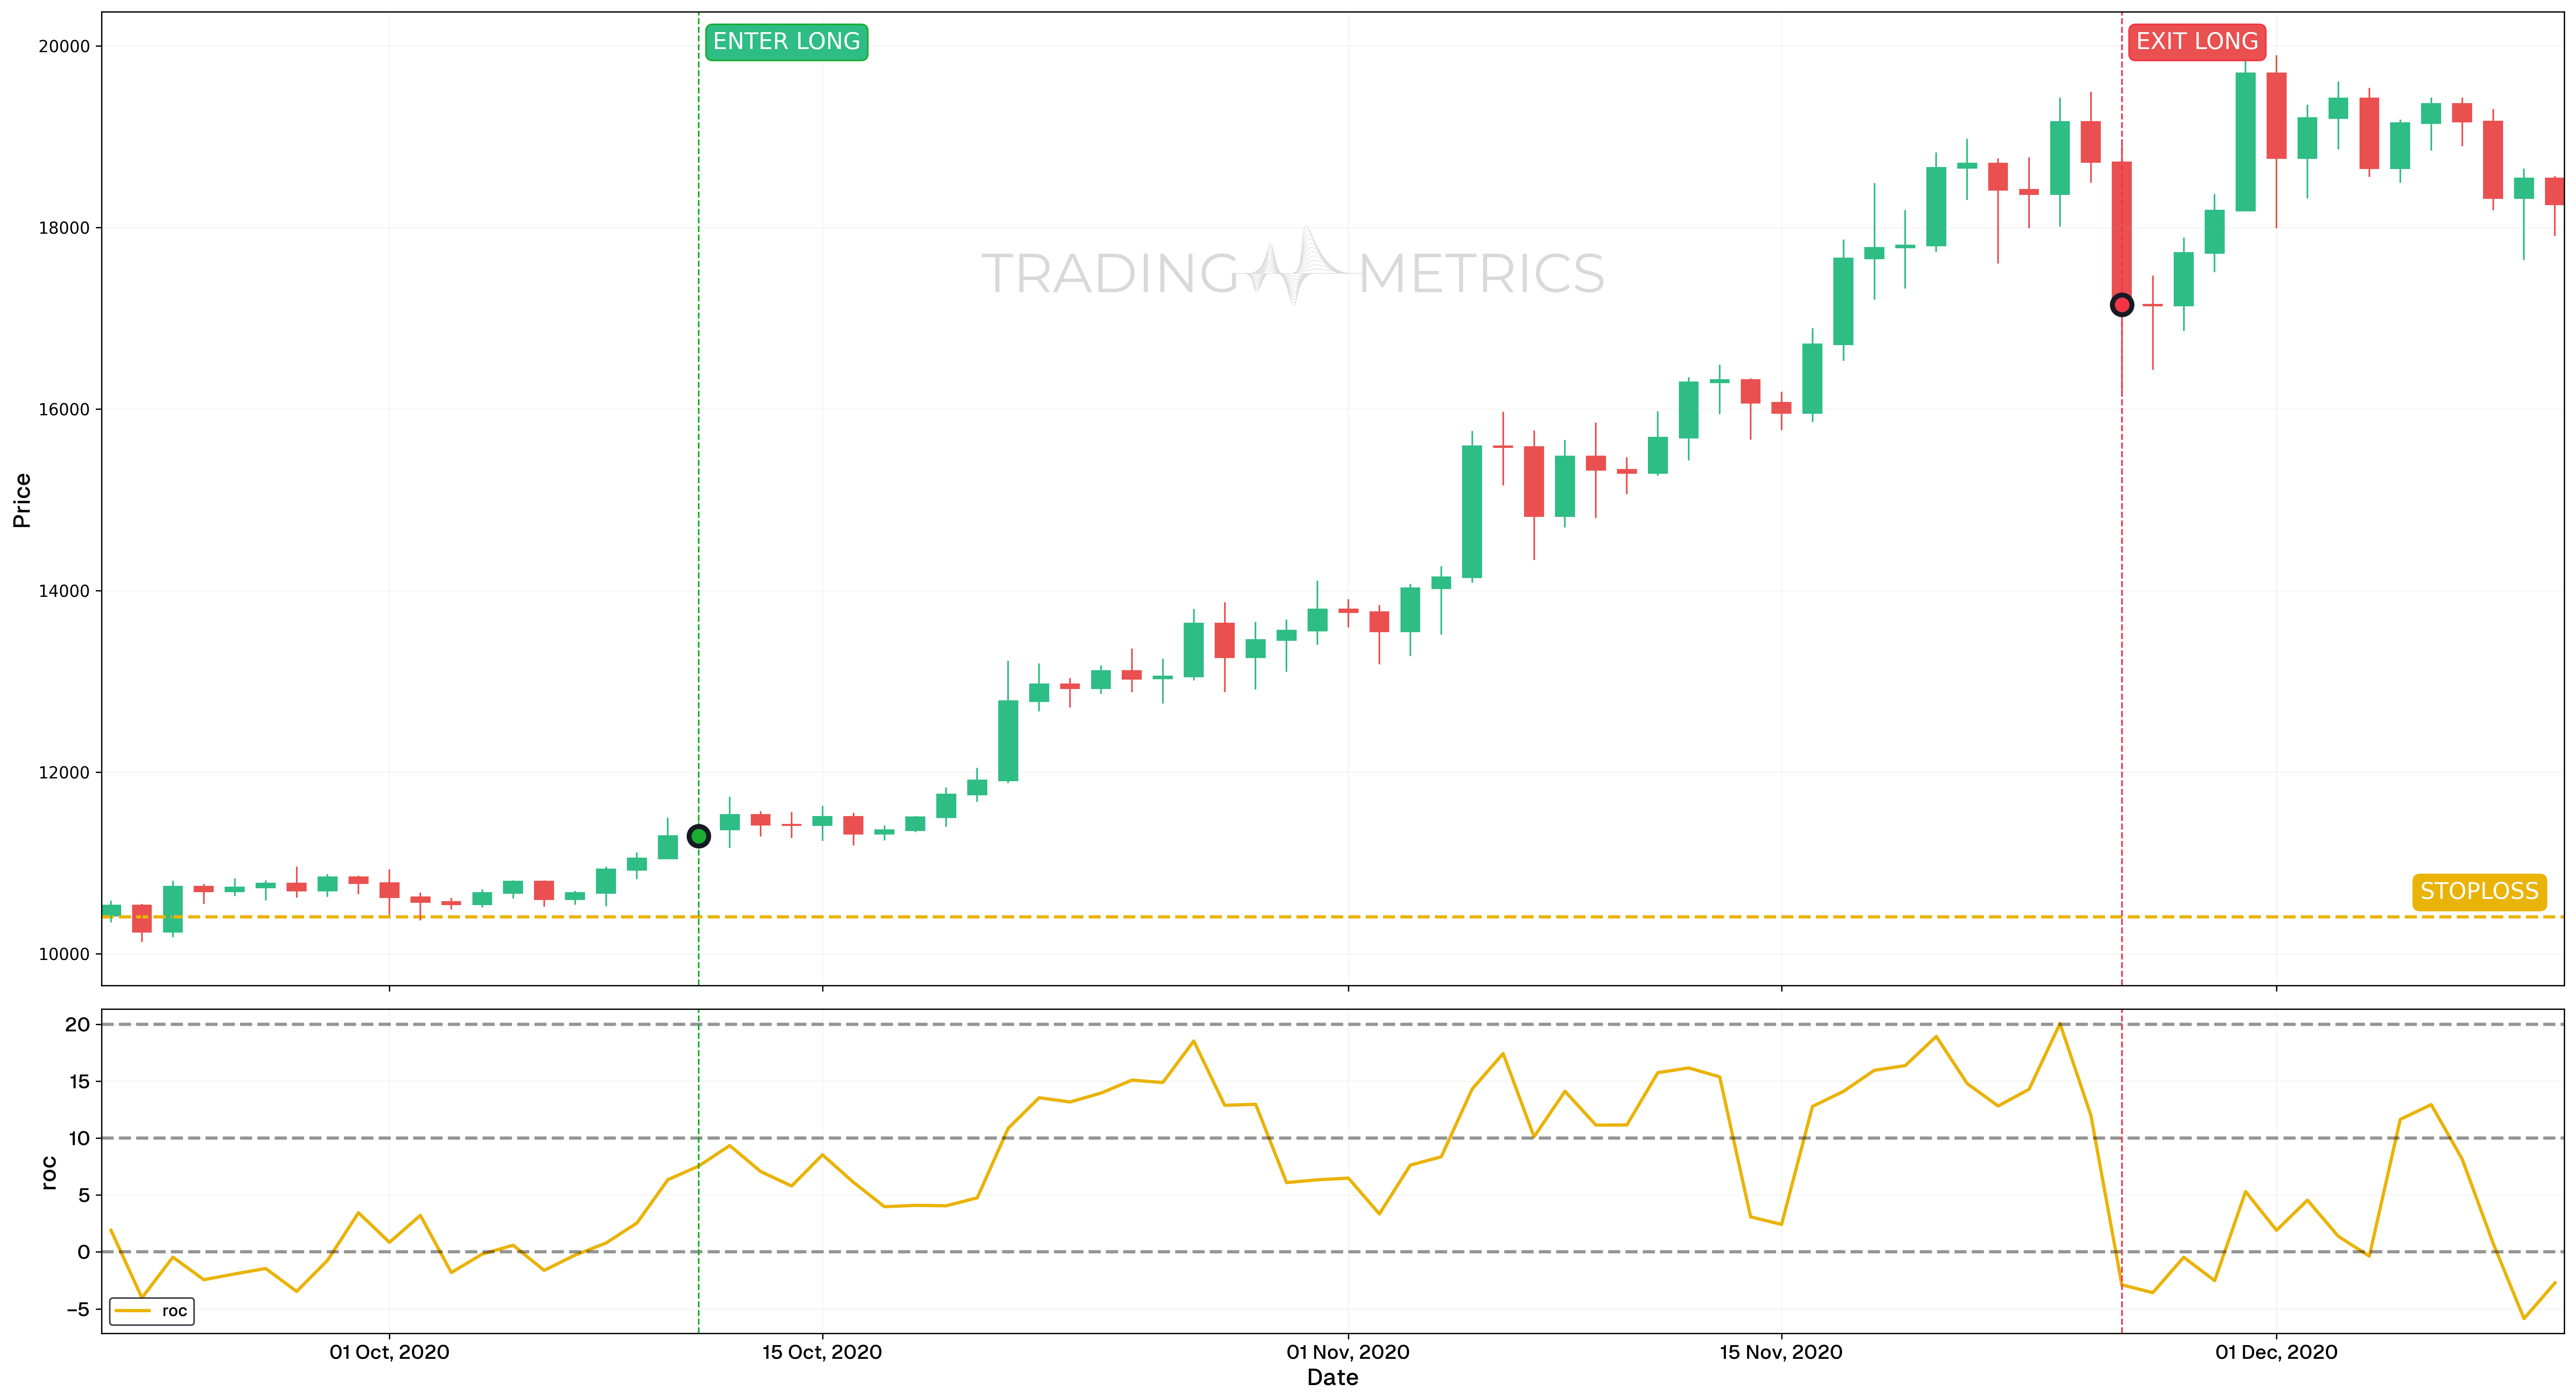
In this analysis, we examine a bullish momentum trading strategy using the Rate of Change (RoC) indicator over the period from September 22, 2020 to November 26, 2020.
Analysis
- The chart analysis focuses on the price movements and the behavior of the Rate of Change (RoC) indicator between October 11, 2020, and November 26, 2020.
- On October 11, 2020, a buy signal was generated when the RoC indicator value crossed above 0, confirming renewed bullish momentum. The signal was further validated by the appearance of a Three White Soldiers candlestick pattern, providing additional confirmation for a long trade entry. The close price of the candle on this date served as the entry point.
- A sell signal occurred on November 26, 2020, when the RoC indicator value dropped below 0, signaling a potential momentum shift and marking the end of the bullish phase. The close price of the candle on this date was used as the exit point.
Trade Setup
- Entry: The long trade was initiated on October 11, 2020, at $11,293.22, after the RoC crossed above 0 and the Three White Soldiers pattern confirmed a strong bullish reversal.
- Exit: The trade was closed on November 26, 2020, at $17,149.47, when the RoC dropped below 0, signaling the end of the bullish trend.
- Outcome: The trade captured a 51.88% price increase, demonstrating the strength of combining RoC with candlestick confirmation to identify entry and exit points in a bullish momentum setup.
Risk Management
- Stop-Loss Placement: The stop-loss was placed at $10,406, slightly below the start of the Three White Soldiers pattern, offering a logical safety margin against downside volatility.
- Position sizing: Position size was calculated to ensure a maximum risk exposure of 2% of trading capital, aligning with disciplined risk management practices.
- Risk-Reward Analysis: With an entry at $11,293.22, a Stop-Loss at $10,406, and an exit at $17,149.47, the trade achieved a Risk-Reward Ratio of approximately 1:7.9.
- Managing Volatility: Active management of the stop-loss was crucial to protect gains as volatility increased throughout the uptrend.
- Exit Strategy: As the price approached key resistance levels, partial profits were secured while allowing the trade to reach its final exit target.
Conclusion
This example demonstrates how the RoC indicator can be effectively utilized to time entries and exits, maximizing returns during periods of strong bullish momentum.
Bearish Momentum Trading
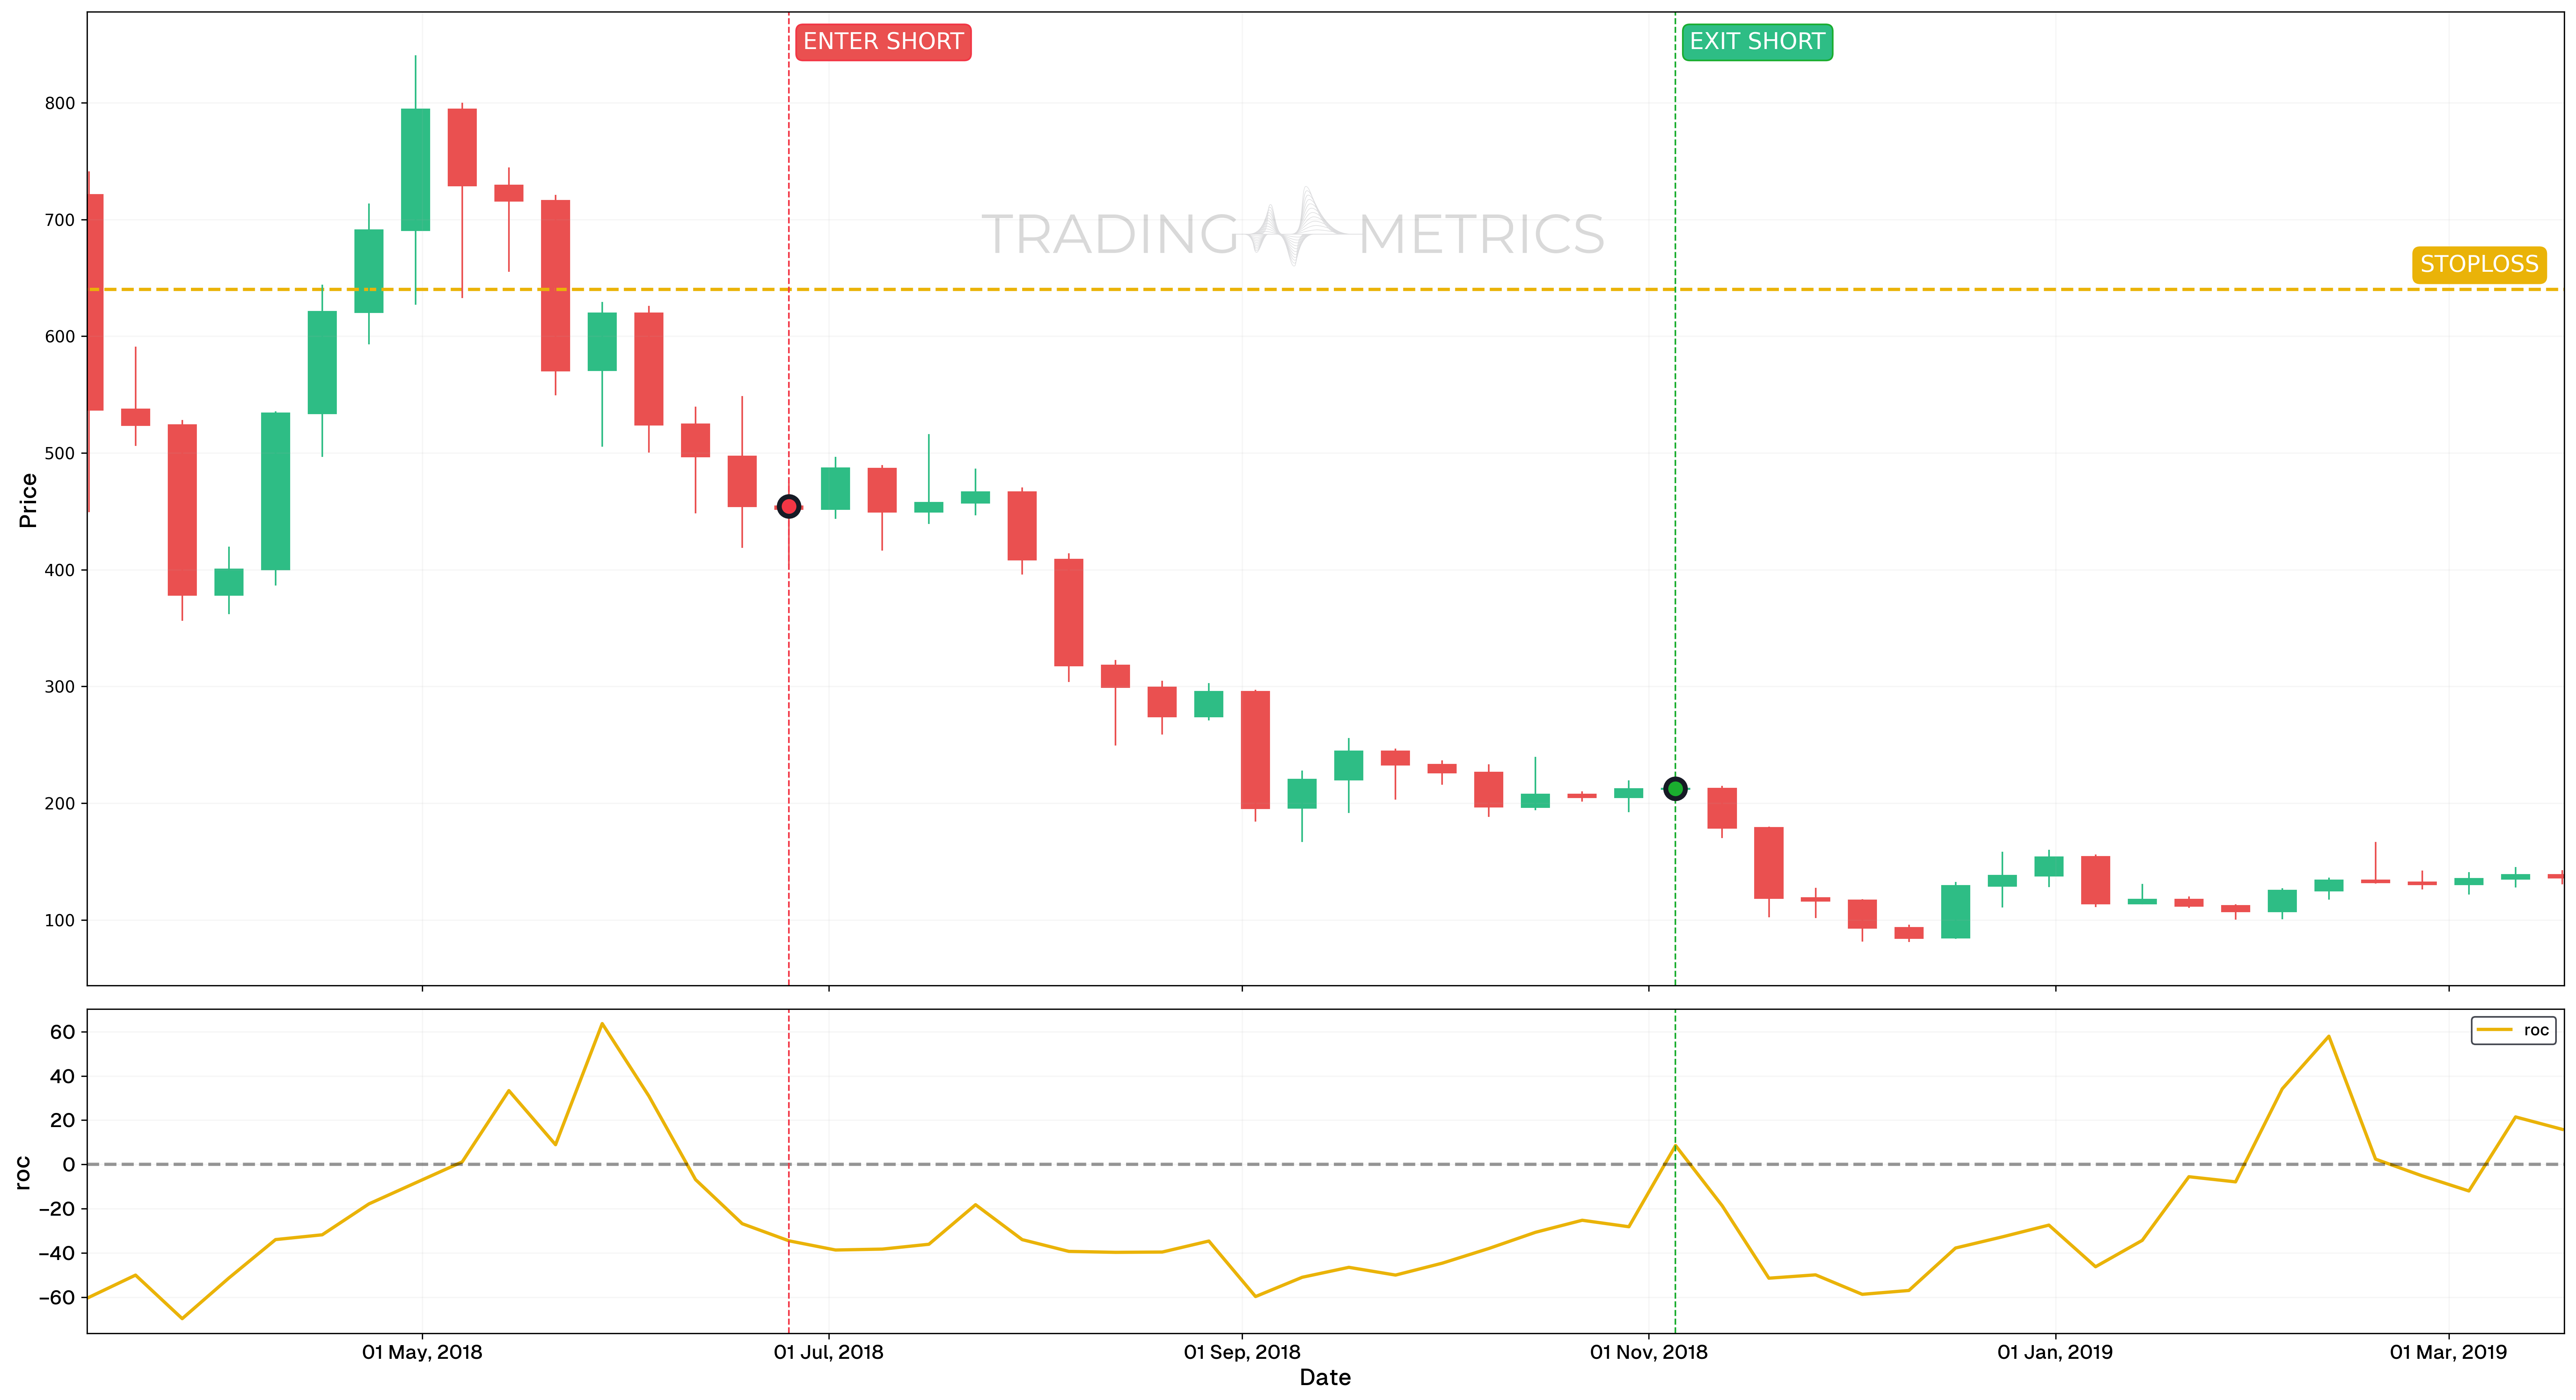
In this analysis, we explore a bearish momentum trading strategy that leverages the Rate of Change (RoC) indicator to identify key sell signals. The period covered by the chart is from March 12, 2018, to March 18, 2019. As the analysis shows, the price dropped significantly, falling 54.08% from the point of entry to the point of exit. This decline validated the effectiveness of using the RoC indicator to identify bearish momentum.
Analysis
- The trading strategy focused on taking a short position based on the behavior of the Rate of Change (RoC) indicator in relation to the 0 line, signaling periods of downward momentum.
- On June 25, 2018, a short entry signal was generated when the RoC crossed below 0 and remained there, confirming sustained bearish momentum. This was supported by the appearance of a Three Black Crows candlestick pattern, further validating the short entry. The close price of the candle on this date served as the entry point.
- The short position exit signal occurred on November 5, 2018, when the RoC indicator value rose above 0, indicating a potential end to the downward momentum. The close price of the candle on this date was used as the exit point.
Trade Setup
- Entry: The short position was initiated on June 25, 2018, at $454.29, following confirmation of bearish momentum by the RoC remaining below 0 and a Three Black Crows pattern.
- Exit: The trade was exited on November 5, 2018, when the RoC indicator rose above 0, signaling a potential reversal or weakening of the downward trend.
- Outcome: This trade successfully captured a significant downward price movement, demonstrating the strength of combining RoC and candlestick confirmation for short entries.
Risk Management
- Stop-Loss Placement: The stop-loss was set at $640, slightly above the high of the Three Black Crows pattern, providing a buffer against potential retracements while respecting the bearish structure.
- Position sizing: Position size was calculated to ensure a maximum risk exposure of 2% of trading capital, maintaining strict risk management practices.
- Risk-Reward Analysis: With an entry at $454.29, a Stop-Loss at $640, and a short exit at $208.99 (approximate based on the stated 54.08% drop), the trade achieved a Risk-Reward Ratio of approximately 1:1.6.
- Managing Volatility: Active adjustments to the stop-loss helped secure profits and protect against sudden volatility.
- Exit Strategy: As the price approached key support zones, partial profit-taking was considered while allowing the trade to run toward the final exit point based on momentum signals.
Conclusion
This example highlights how the RoC indicator can be a valuable tool in identifying opportunities for short trades by leveraging momentum shifts around the 0 line.
Combining RoC with Other Tools
RoC is often used alongside other indicators to confirm signals and enhance accuracy:
- Moving Averages: Using a moving average crossover with RoC can filter out false signals. For instance, a buy signal is stronger if RoC is positive and the price is above a moving average.
- Relative Strength Index (RSI): Combining RoC with RSI helps confirm overbought or oversold conditions. If both indicate overbought, it’s a stronger sell signal.
- MACD: RoC can validate MACD signals. For example, if MACD shows a bullish crossover and RoC is positive, it strengthens the buy signal.
Avoid Signal Traps: ROC can be prone to whipsaws in choppy markets. Always confirm signals with additional analysis.
Key Points
- Momentum Indicator: The Rate of Change (ROC) measures the percentage change in price over a specified period, highlighting the strength and direction of price momentum.
- Positive and Negative Values: Positive ROC values indicate upward momentum. Negative ROC values suggest downward momentum.
- Zero Line as a Pivot: The zero line represents a neutral point - crossing above signals bullish momentum, while crossing below indicates bearish momentum.
- Overbought and Oversold Conditions: Extreme ROC values can indicate overbought or oversold conditions, signaling potential reversals or corrections.
- Trend Confirmation: Use ROC to confirm the strength of a trend when combined with other trend-following indicators, like moving averages.
- Divergence Signals: Divergences between ROC and price (e.g., price making higher highs while ROC makes lower highs) can indicate potential trend reversals.
- Customizable Periods: Adjust the period used in the calculation to match your trading style: Shorter periods make ROC more responsive but prone to noise. Longer periods smooth out fluctuations but may lag.
- Effective in Trending Markets: ROC works well in trending markets but may give false signals in choppy or range-bound conditions.
- Combine with Other Indicators: Pair ROC with oscillators like RSI or MACD to filter signals and improve decision-making.
- Backtesting and Fine-Tuning: Test ROC - based strategies in different market environments to validate their effectiveness and refine parameters for optimal performance.
Conclusion
RoC is a versatile tool that helps traders understand the speed and direction of price changes. By identifying trends and potential reversals, traders can make more informed decisions. Understanding and using RoC effectively can give traders an edge in predicting price movements. By combining it with other technical tools, traders can gain deeper insights and improve their trading strategies. Always remember, no single indicator is foolproof, so a holistic approach is best for successful trading.
Frequently Asked Questions
Quick answers based on this page's topic.
The ROC indicator calculates the percentage difference between the current price and the price from a specific number of periods ago. It creates a momentum oscillator that fluctuates around a zero line, showing how fast the price is rising or falling.
The zero line acts as a pivot point for trend direction. When the ROC crosses above zero, it confirms that prices are accelerating upward; a cross below zero indicates that bearish momentum is increasing, often serving as a lead signal for trend changes.
Extreme ROC readings—either very high or very low—often coincide with market exhaustion. When the ROC reaches an unsustainable peak and begins to turn back toward zero, it suggests that the current move is overextended and a correction or consolidation is likely.