Falling Three Methods: A Brief Pause in a Bearish Trend
The Falling Three Methods pattern is a precise bearish continuation signal in technical analysis, often emerging within a downtrend. Visualize it as a brief interruption - three small upward candles sandwiched between two larger downward ones - before the decline resumes. When this pattern takes hold, it’s a clear sign that bearish momentum is pausing only to regroup, offering traders a chance to sell or short the asset as the downtrend presses on.
How to Identify the Falling Three Methods Pattern in Trading
The Falling Three Methods is a bearish continuation candlestick formation. It develops during a downtrend as sellers pause briefly before resuming control. The setup confirms when the final candle closes below prior support. Here’s how to spot it:
Start with the Big Picture
This pattern forms during a downtrend. Sellers dominate first, then step aside briefly while buyers attempt a small counter-move, before pressure resumes to the downside.
Trace the Five-Candle Sequence
The structure unfolds in five distinct candles. Identifying each stage confirms the setup.
- First Candle: A long bearish candle driving the trend lower.
- Second, Third, and Fourth Candles: Three smaller bullish candles that climb modestly but stay within the first candle’s body.
- Fifth Candle: A strong bearish candle that closes below the first candle’s low.
Zero in on the Confirmation Level
The confirmation level is the low of the first candle. The fifth candle must break and close below this level to complete the pattern.
Watch the Breakdown
The bearish trigger comes when the fifth candle closes under the first candle’s low.
- A decisive close below prior support or
- A large bearish candle
Both confirm continuation of the downtrend and provide the entry.
Check Volume for Additional Confirmation
Volume behavior reinforces the continuation.
- Spikes on the first candle as selling pressure dominates.
- Declines during the three middle candles while the market pauses.
- Surges on the fifth candle, confirming sellers have regained control.
Drop Down: Measure the height of the first candle and project it downward from the fifth candle’s close for a realistic price target.
How to Trade the Falling Three Methods Pattern (Trading Example)
To illustrate how the Falling Three Methods pattern can be used to enter a trade, we will choose the ETHUSDT pair. This bearish continuation pattern appeared on the daily chart, offering a short-term breakdown opportunity within an ongoing downtrend.
Analysis
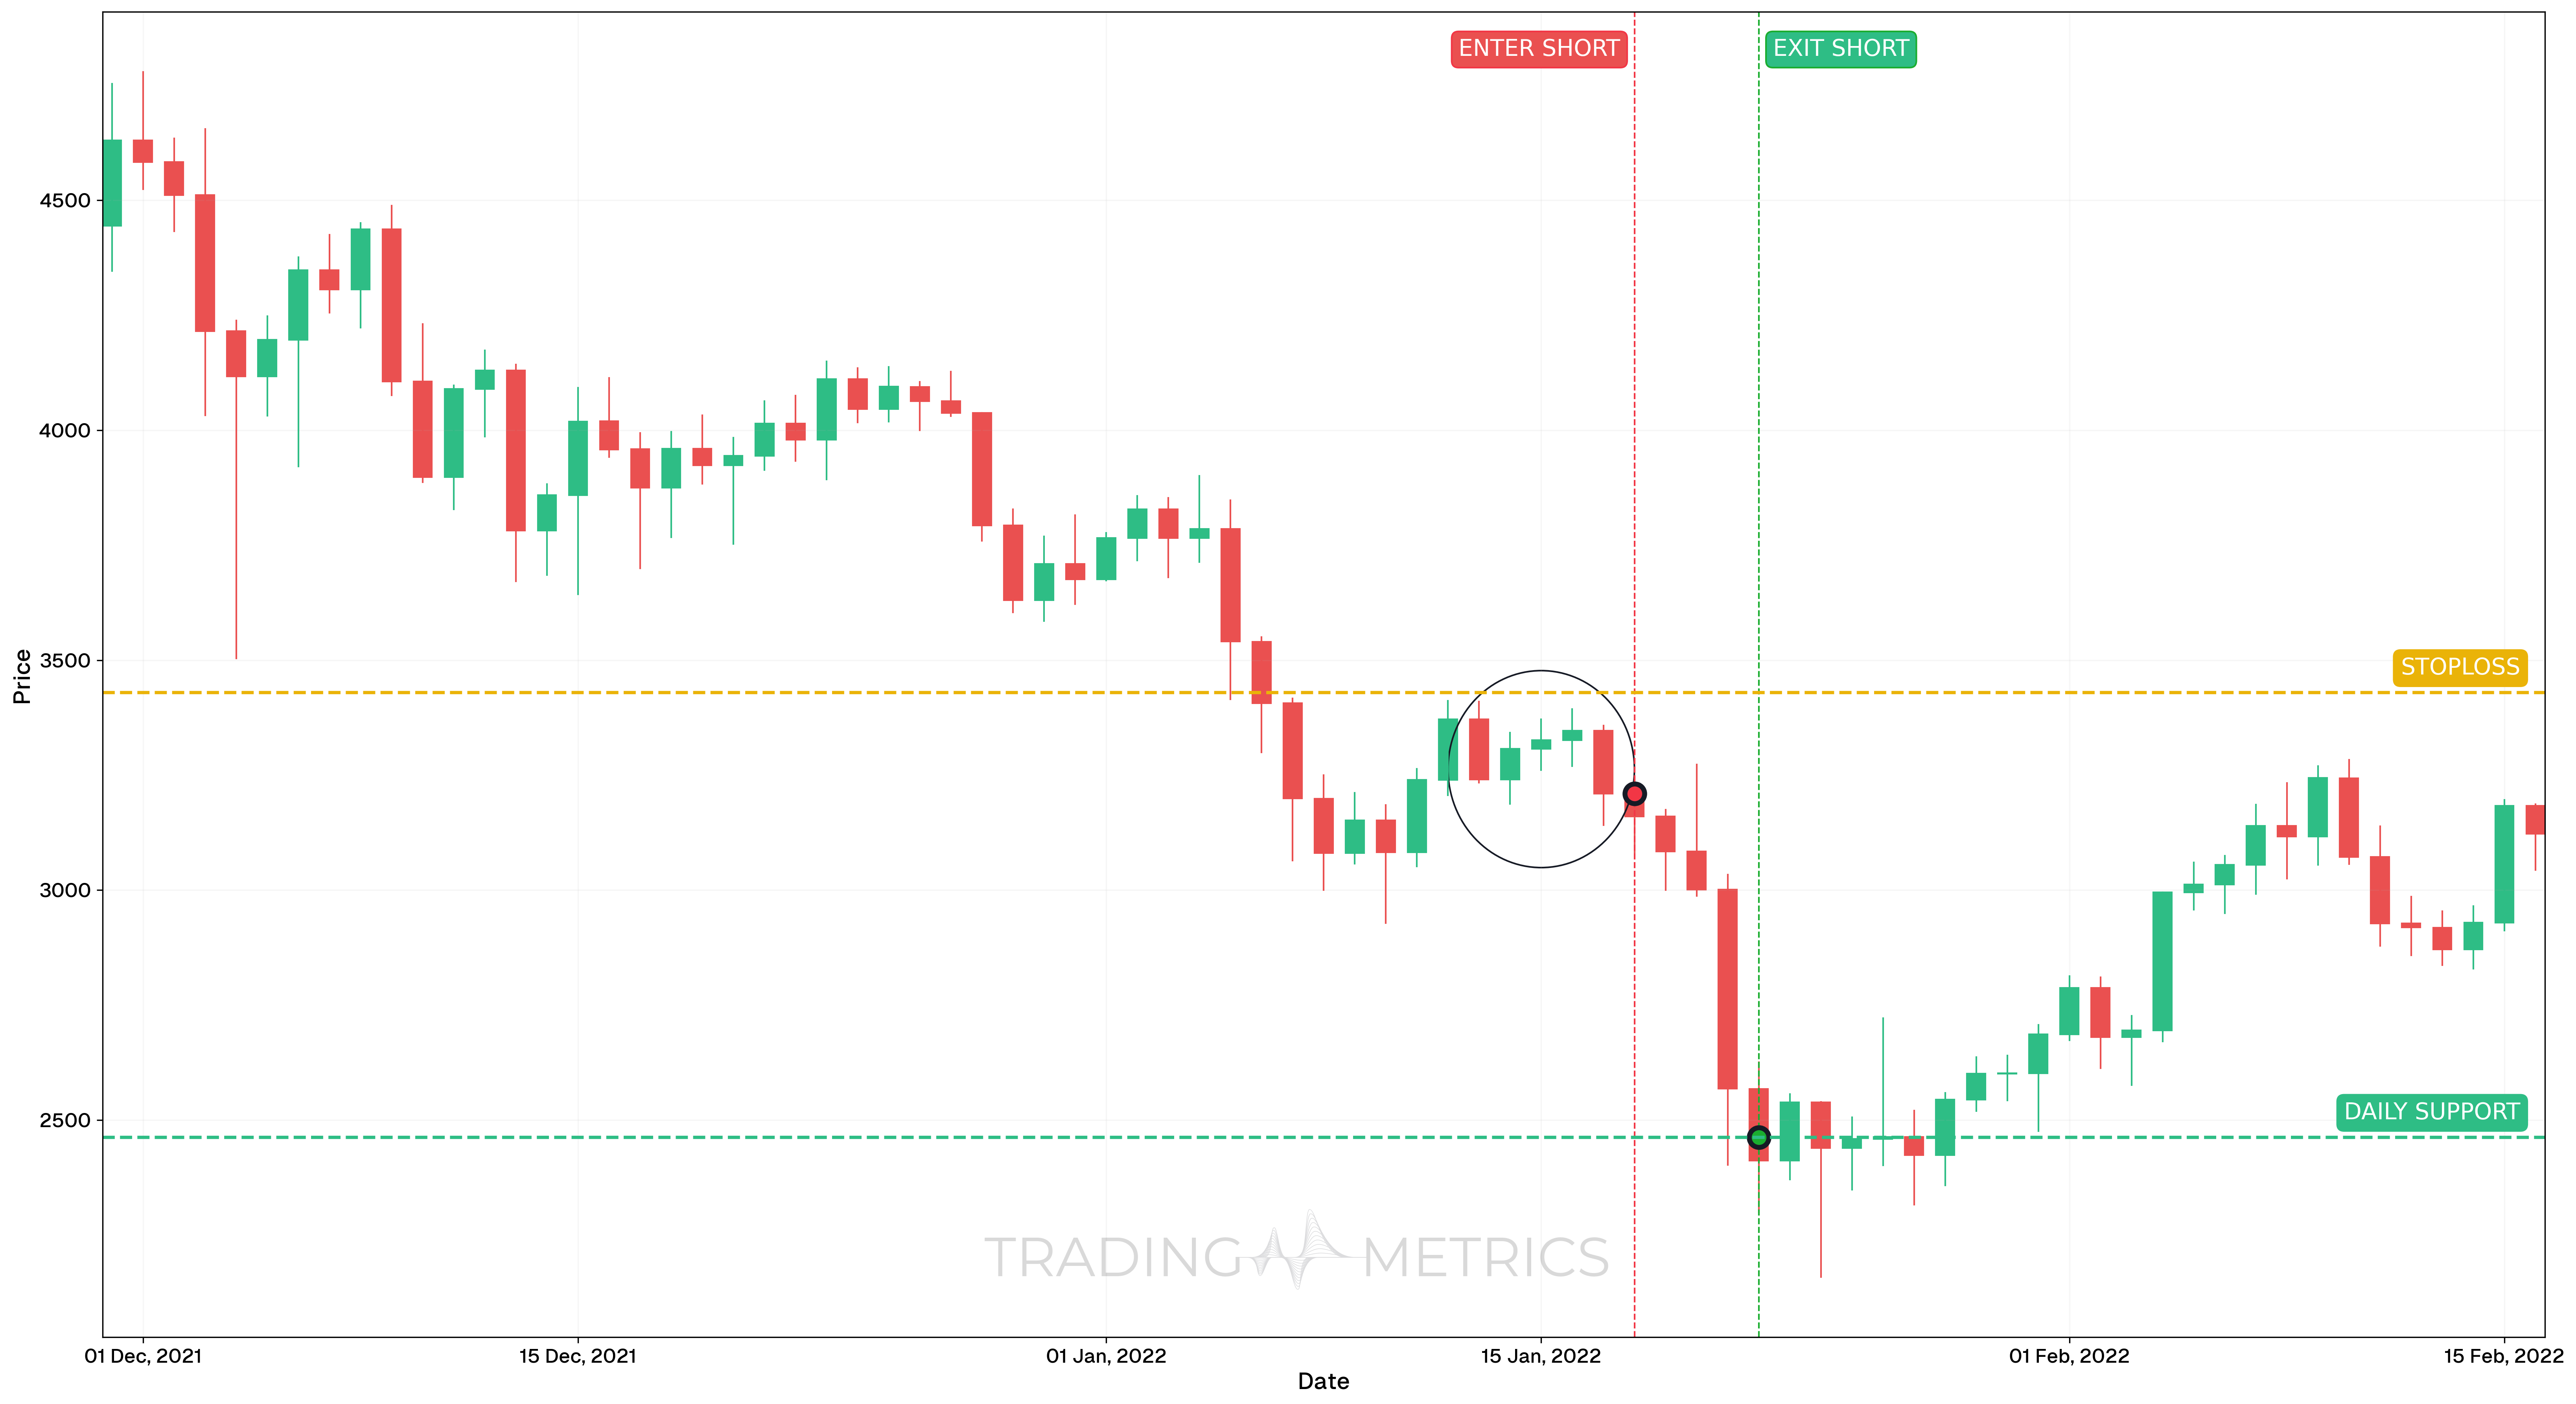
Between late November 2021 and mid-January 2022, ETHUSDT formed a textbook Falling Three Methods pattern. The setup included a strong bearish candle, followed by three small-bodied candles moving slightly higher within the range, and finally a strong bearish continuation candle that confirmed the pattern and signaled momentum resumption.
Trade Setup
- Entry: The trade was entered on January 18, 2022, at $3209.68, as the confirmation candle closed below the consolidation range. Entry was supported by:
- RSI below 50 and falling, indicating sustained bearish momentum
- Exit: The trade was closed on January 22, 2022, at $2462.94, at a prior support/resistance level that had historically attracted buying pressure. The target was conservative and aligned with structural price behavior.
- Outcome: The Falling Three Methods setup yielded a 23.2% gain within a few days, capturing a sharp breakdown during heightened momentum.
Risk Management
- Stop-Loss placement: The stop-loss was set at $3429.84, just above the pattern’s high and previous minor resistance zone. This invalidated the setup if price reversed above the range.
- Position sizing: A 2% capital risk model was applied, based on the risk distance between entry and stop-loss.
- Risk-Reward Ratio: The trade achieved a Risk-Reward Ratio of 1:3.39, representing high reward efficiency with a tightly controlled downside.
- Volatility Consideration: The pattern formed in contracting Volatility, followed by an aggressive breakout that confirmed continuation. Managing risk through pattern confirmation ensured better entry timing.
- Adaptive Exit Strategy: While the exit was based on horizontal structure, traders could have extended the target using Fibonacci projections or trailed based on swing highs.
Volume Press: A volume spike on the fifth candle presses the pattern into a bearish plunge.
Pre-Trade Checklist
Press the Proof: Pair the pattern with volume spikes and indicators like RSI to dodge fakes and stack your odds.
Key Points
- Candle Structure: A long first and fifth candle with small middle ones boosts reliability - uneven sizes dilute it.
- Time Frame: Shines on daily or hourly charts in active downtrends.
- Combine with Indicators: Use moving averages or RSI to sharpen your entry.
- Breakout Confirmation: The fifth candle break keeps the trend rolling - don’t jump too soon.
- Price Target: Measure the first candle height, project down from the fifth candle’s close for your aim.
- Risk Management: Set a stop-loss above the highest middle candle to limit losses if it fails.
Wait for the Fall: Acting before the fifth candle break risks a method misstep - let it confirm.
Conclusion
The Falling Three Methods pattern is a trader’s precise tool for riding bearish continuations. Its five-candle dance, paired with volume, RSI, and moving averages, can press out big drops. Whether in crypto, stocks, or forex, this pattern hones your edge. Stay steady, manage your risk, and let the methods fall - that brief pause could plunge into a winning trade.
Frequently Asked Questions
Quick answers based on this page's topic.
This pattern signals that a downtrend is resting before resuming its move. The three small middle candles represent a weak, low-volume 'relief rally' or profit-taking phase. When the fifth candle breaks the low of the first, it proves sellers are still in full control.
Look for a long red candle followed by three small candles (usually green) that stay entirely within the high-low range of that first candle. The pattern is confirmed when a fifth large red candle closes below the first candle's low, signaling trend resumption.
The most technical stop-loss placement is above the high of the first long bearish candle. Since the pattern's validity depends on the downtrend remaining intact, a move above that peak suggests the bearish thesis has failed and the trend may be reversing.