Common Doji Pattern: A Single Candle of Pure Indecision
The Common Doji is a candlestick pattern that represents market indecision. It forms when the open and close are nearly identical, leaving a very small or nonexistent body with upper and lower shadows of similar length. This balance between buyers and sellers signals a pause in momentum, where the next candles determine whether the trend will continue or reverse.
How to Identify the Common Doji Pattern in Trading
Spotting a Common Doji involves recognizing a single candlestick with a near-equal open and close, signaling a pause in momentum. It’s neutral, with its direction - bullish or bearish - revealed by context and confirmation. Here’s the step-by-step guide.
Understand the Basics of the Common Doji Pattern
The Common Doji reflects market indecision, appearing in uptrends, downtrends, or consolidation:
- Bullish Scenario: Forms after a downtrend, hinting that selling pressure may ease, potentially leading to a reversal if confirmed upward.
- Bearish Scenario: Forms after an uptrend, suggesting buying pressure may wane, possibly signaling a reversal if confirmed downward.
Look for the Candlestick Shape in Price Movement
The pattern features a single candle:
- Common Doji: A candlestick where the open and close are equal or very close, forming a small body, with short upper and lower shadows of roughly equal length - price wavers slightly but settles near its start, showing balance.
Identify the Confirmation Level
- Bullish Scenario: The confirmation level is the high of the Common Doji - a subsequent close above indicates bullish intent.
- Bearish Scenario: The confirmation level is the low of the Common Doji - a subsequent close below suggests bearish intent.
Confirm the Pattern with a Follow-Up Close
- Bullish Scenario: A bullish signal emerges when the next candle closes above the Common Doji’s high, often with a bullish candle, signaling a potential reversal or continuation. This is your entry point for a long trade.
- Bearish Scenario: A bearish signal emerges when the next candle closes below the Common Doji’s low, often with a bearish candle, indicating a potential reversal or continuation. This is your entry point for a short trade. (Note: The Common Doji’s neutrality requires confirmation.)
Check Volume for Extra Confidence
Volume often dips on the Common Doji, reflecting hesitation:
- Bullish Scenario: A rise on confirmation with increasing volume supports a bullish shift.
- Bearish Scenario: A rise on confirmation with increasing volume reinforces a bearish shift. A volume increase in either case enhances the signal’s strength.
Next Move: Gauge the prior trend’s range or nearby support/resistance to estimate where price might head once the Common Doji resolves.
How to Trade the Common Doji Pattern (Trading Example)
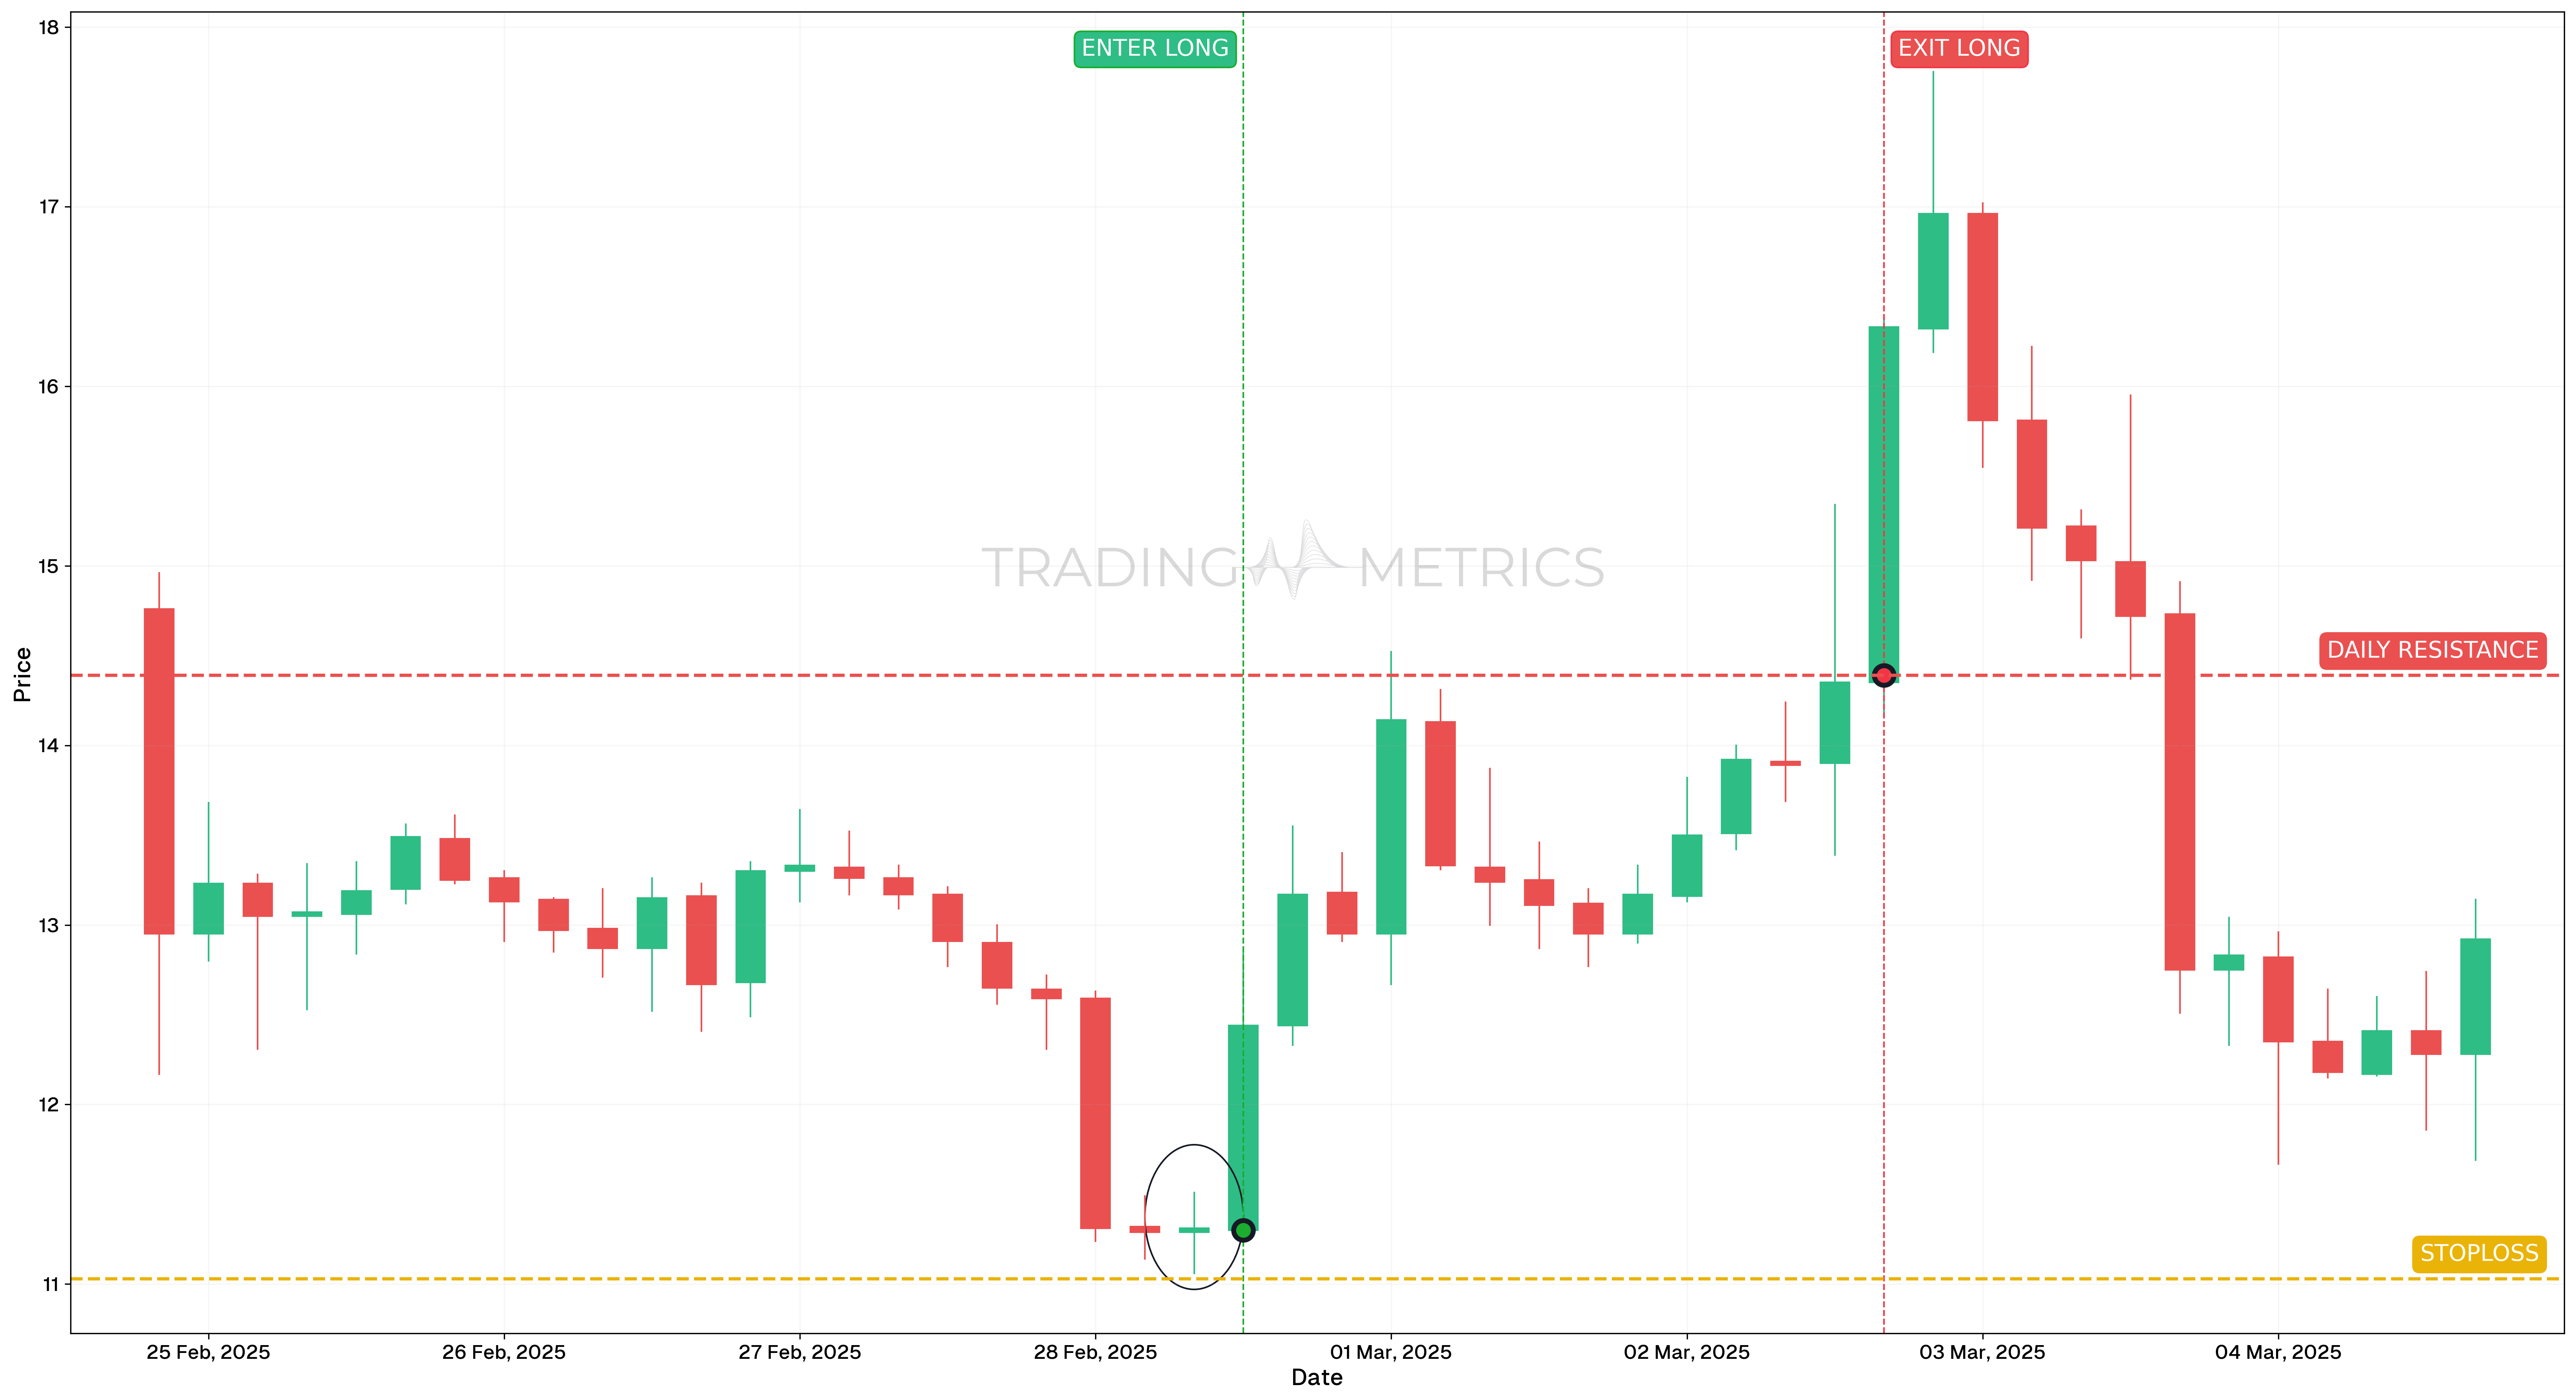
To illustrate how the Common Doji pattern can be used to enter a trade, we will choose the TRUMPUSDT pair. This neutral candlestick appeared on the 4-hour chart and served as a pivot signal during a market pause before a breakout.
Analysis
On February 28, 2025, TRUMPUSDT printed a clear Common Doji candle. The tight open and close, combined with upper and lower shadows, signaled indecision between buyers and sellers. However, the market context indicated a likely resolution to the upside as price coiled under resistance.
Trade Setup
-
Entry: The trade was entered on February 28, 2025, at 12:00, at $11.30, just after the confirmation breakout candle following the Common Doji. Supporting conditions included:
- RSI was rising from oversold levels toward 50, signaling strengthening bullish momentum.
-
Exit: The position was closed on March 2, 2025, at 16:00, at $14.39, near a previous support/resistance zone that had historically acted as a local cap. This provided a clean and disciplined exit point before potential profit-taking.
-
Outcome: The confirmed Common Doji setup produced a 27.3% move, showing how a neutral candle can trigger a strong trend shift when confirmed.
Risk Management
- Stop-Loss placement: The stop-loss was set at $11.03, just below the Common Doji’s low and minor structural support, protecting against false breakouts.
- Position sizing: Position size was calculated using a 2% capital risk model, taking into account the risk between entry and stop.
- Risk-Reward Ratio: The trade achieved a Risk-Reward Ratio of 1:11.44, offering an exceptional risk-adjusted outcome for a short-term setup.
- Volatility Consideration: The signal formed after a period of compressed Volatility, allowing a tight entry and strong expansion on breakout.
- Adaptive Exit Strategy: This trade could have also been extended with Fibonacci targets or a trailing stop under higher lows, depending on risk preference.
Volume Cue: A volume rise on confirmation turns the Common Doji’s indecision into a actionable signal.
Pre-Trade Checklist
Pinpoint the Shift: Pair the Common Doji with volume and indicators like RSI to cut through the noise.
Key Points
- Body Balance: A near-zero body with short shadows defines its neutrality - bigger bodies weaken it.
- Time Frame: Stands out on daily or weekly charts in any trend context.
- Combine with Indicators: Use moving averages or RSI to decode its direction.
- Breakout Confirmation: A close above the high or below the low sets the course - don’t guess early.
- Price Target: Estimate from the prior range or nearby levels once confirmed.
- Risk Management: Set a stop-loss outside the Common Doji’s range to guard against misfires.
Hold for Proof: Jumping in before confirmation risks a Common Doji fakeout - wait for the market to tip its hand.
Conclusion
The Common Doji pattern is a trader’s lens on market indecision. Its neutral stance, clarified by volume, RSI, and moving averages, can unlock trades in any direction. Across crypto, stocks, or forex, it’s a flexible tool. Stay disciplined, manage your risk, and let the Common Doji resolve - that pause could lead to your next smart move.
Frequently Asked Questions
Quick answers based on this page's topic.
A Common Doji represents a state of perfect equilibrium where the opening and closing prices are virtually identical. It signals that neither buyers nor sellers could gain structural control during the session, proving that the previous trend has hit a 'moment of silence' and lost its immediate conviction.
It is a neutral 'pause' signal that requires confirmation. A Doji acts as a pivot point: if the subsequent candle breaks and closes above the Doji's high, it signals a bullish resolution. If it breaks the low, it signals a bearish move. The direction of the breakout defines the trade, not the candle itself.
A valid Doji pause is often accompanied by contracting volume. This indicates a temporary withdrawal of market participants as they wait for a fresh catalyst. If a Doji forms on high volume, it signals a 'churning' market where massive buying and selling effort resulted in no price progress, often preceding a major reversal.