Bearish Flag Pattern: Trading the Counter-Trend Pause
The Bearish Flag pattern is a sharp bearish continuation signal in technical analysis, often popping up during a downtrend. Picture it as a brief pause - price consolidating in a small, upward-sloping channel - before resuming its plunge. When this pattern forms, it’s a quick heads-up that bearish momentum is still alive, offering traders a chance to sell or short the asset as the downtrend rolls on.
How to Identify the Bearish Flag Pattern in Trading
The Bearish Flag is a continuation formation. It forms when price pauses briefly after a steep decline, consolidating in a small channel before resuming the downtrend. The setup confirms when price breaks below support. Here’s how to spot it:
Start with the Big Picture
This pattern develops during a downtrend. Sellers dominate with a strong move lower, followed by a short consolidation that signals only a pause — not a reversal.
Trace the Flagpole and Flag
The Bearish Flag is built from two clear parts. Recognizing both confirms the structure.
- Flagpole: A sharp, steep decline driven by heavy selling.
- Flag: A short consolidation that slopes upward or moves sideways, forming a tight rectangle or parallelogram.
Zero in on the Support Line
The support line is the lower boundary of the Bearish Flag. Buyers step in temporarily here, but once this line gives way, the pattern nears completion.
Watch the Breakdown
The bearish trigger comes when price closes below support.
- A decisive break under the lower boundary or
- A strong bearish candle
Both confirm continuation of the downtrend and trigger the entry.
Use Volume as a Lie Detector
Volume action helps confirm the setup.
- Spikes on the flagpole as sellers drive the decline.
- Drops during the Bearish Flag as price consolidates.
- Surges on the breakdown, confirming renewed bearish momentum.
Set Your Drop: Measure the height of the flagpole and project it downward from the break for a realistic price target.
How to Trade the Bearish Flag Pattern (Trading Example)
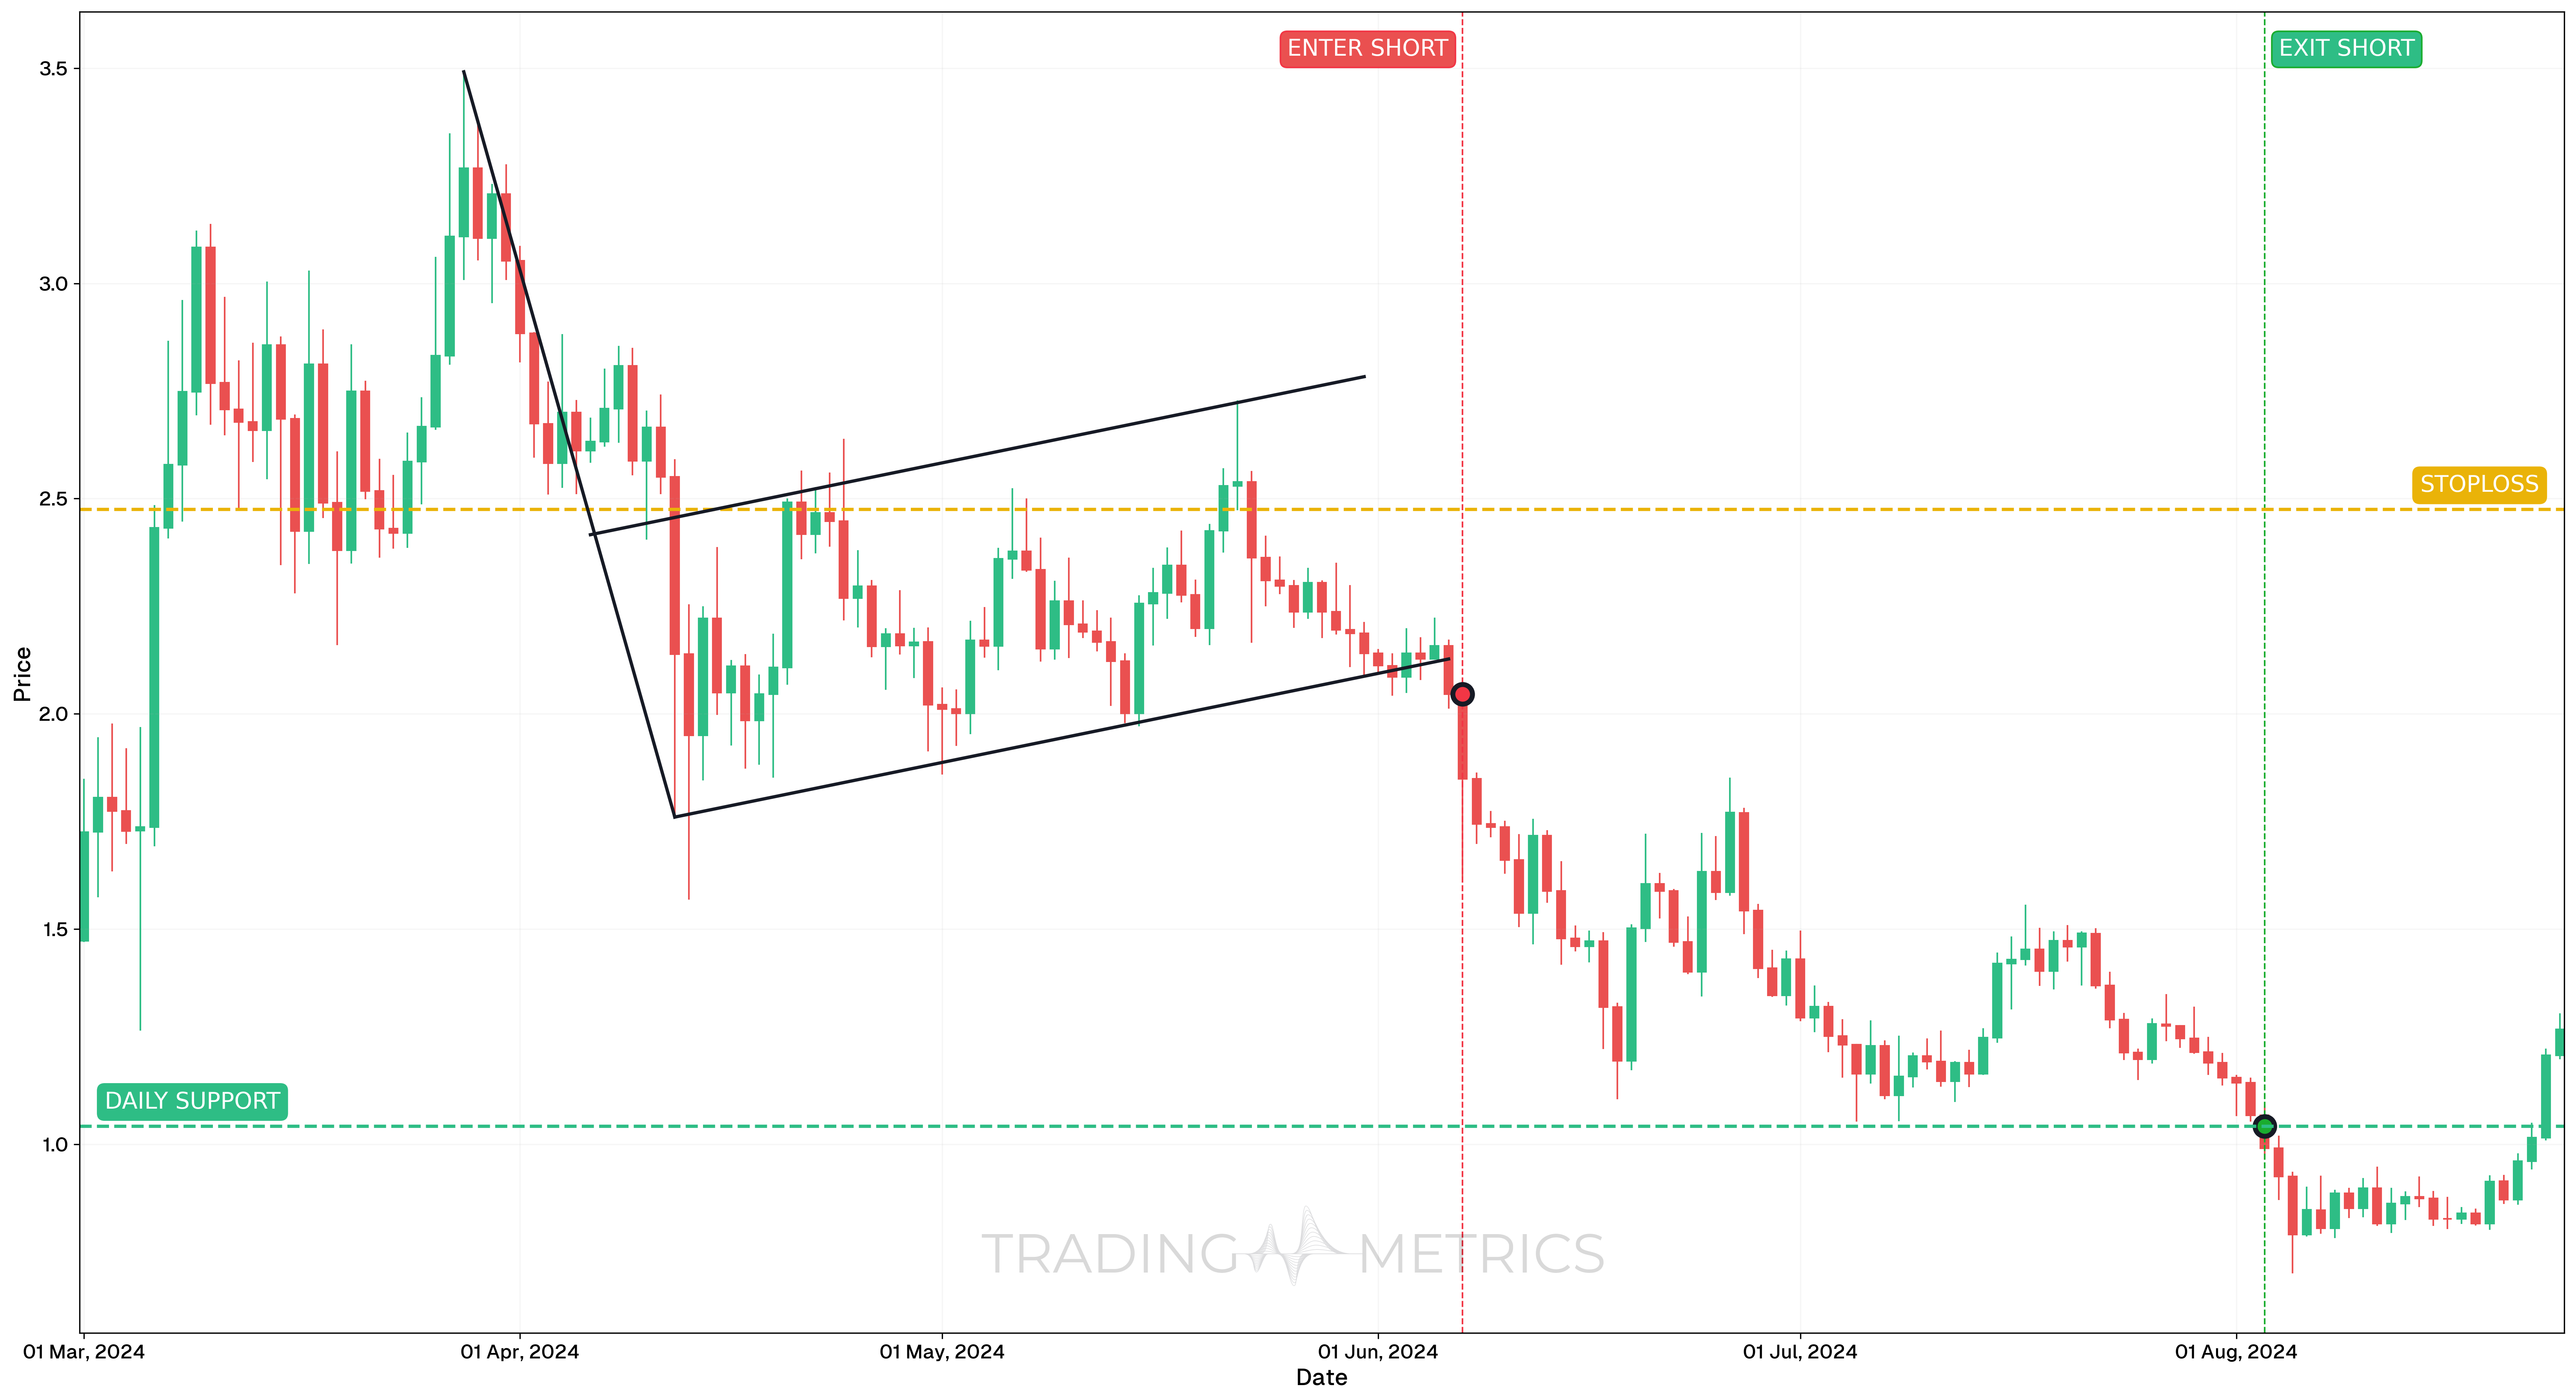
To illustrate how the Bearish Flag pattern can be used to enter a trade, we will choose the FETUSDT Perp pair. This altcoin futures contract formed a trend continuation setup on the daily chart, signaling downside momentum after a period of consolidation.
Analysis
From March to early June 2024, FETUSDT Perp trended downward, followed by a brief consolidation period into a tight Bearish Flag. The Bearish Flag sloped upward in low volume, characteristic of a weak retracement. On June 7, price broke down decisively from the Bearish Flag, confirming the continuation of the dominant bearish trend.
Trade Setup
- Entry: The short position was opened on June 7, 2024, at $2.0454, as price broke below the lower boundary of the Bearish Flag. Momentum supported the entry:
- RSI was below 50 and falling
- The breakout candle closed strong and below Bearish Flag support
- Exit: The trade was closed on August 3, 2024, at $1.0416, at a major support-turned-resistance zone. This level had previously acted as support during the broader trend and was used as a conservative target.
- Outcome: The Bearish Flag setup delivered a 49.08% gain from entry to exit, confirming the value of Bearish Flag breakouts in strong directional markets.
Risk Management
- Stop-Loss placement: The stop-loss was placed at $2.4745, above the Bearish Flag’s upper boundary and local swing high. This protected the trade from invalidation in the event of a failed breakdown.
- Position sizing: A 2% capital risk model was used, with position size based on the distance from entry to stop-loss.
- Risk-Reward Ratio: The trade produced a Risk-Reward Ratio of 1:2.34, offering a well-balanced setup with strong downside potential relative to risk.
- Volatility Consideration: The Bearish Flag formed during a period of decreasing Volatility, which then expanded sharply on breakdown. Waiting for the breakout reduced the chance of getting trapped inside the pattern.
- Adaptive Exit Strategy: More aggressive exits could have been held for the next major weekly support zone, but the conservative target aligned with high-probability structural levels.
Volume Drop: A volume spike on the support break flies the Bearish Flag into a bearish plunge.
Pre-Trade Checklist
Flag the Proof: Pair the pattern with volume surges and indicators like RSI to dodge fakes and stack your odds.
Key Points
- Channel Clarity: A tight, upward-sloping Bearish Flag strengthens the signal - messy shapes weaken it.
- Time Frame: Shines on daily or hourly charts in active downtrends.
- Combine with Indicators: Use moving averages or RSI to refine your entry.
- Breakout Confirmation: The support break keeps the trend alive - don’t jump too soon.
- Price Target: Measure the flagpole height, project down from the break for your target.
- Risk Management: Set a stop-loss above the Bearish Flag’s high to limit losses if it fails.
Wait for the Fall: Acting before the support break risks a flag-waving fakeout - let it drop.
Conclusion
The Bearish Flag pattern is a trader’s quick pick for riding bearish continuations. Its brief pause, paired with volume, RSI, and moving averages, can fuel big drops. Whether in crypto, stocks, or forex, this pattern sharpens your play. Stay alert, manage your risk, and let the Bearish Flag fly - that short breather could plunge into a winning trade.
Frequently Asked Questions
Quick answers based on this page's topic.
The upward slope represents a 'relief rally' driven by weak buying and short-sellers covering their positions. Because this rally lacks aggressive volume, it is seen as a temporary pause. Once the weak buying is exhausted, the primary downward momentum typically resumes with force.
The most technical stop-loss is placed just above the highest point of the flag's upper resistance line. This ensures that if the 'relief rally' turns into a genuine trend reversal, your capital is protected and your bearish thesis is invalidated early.
A valid breakout is confirmed when a candle closes decisively below the flag's lower support line, preferably accompanied by an increase in selling volume. This close proves that the consolidation is over and the sellers have regained control of the market.