Flags and Pennants: Trading the Pause Before the Continuation
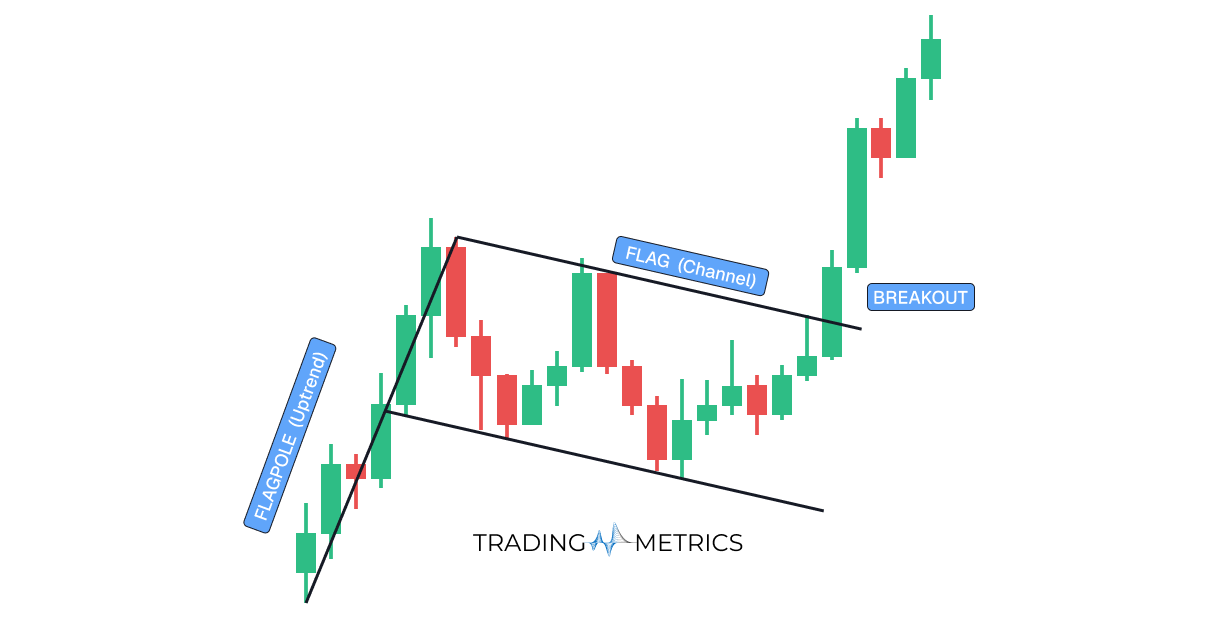
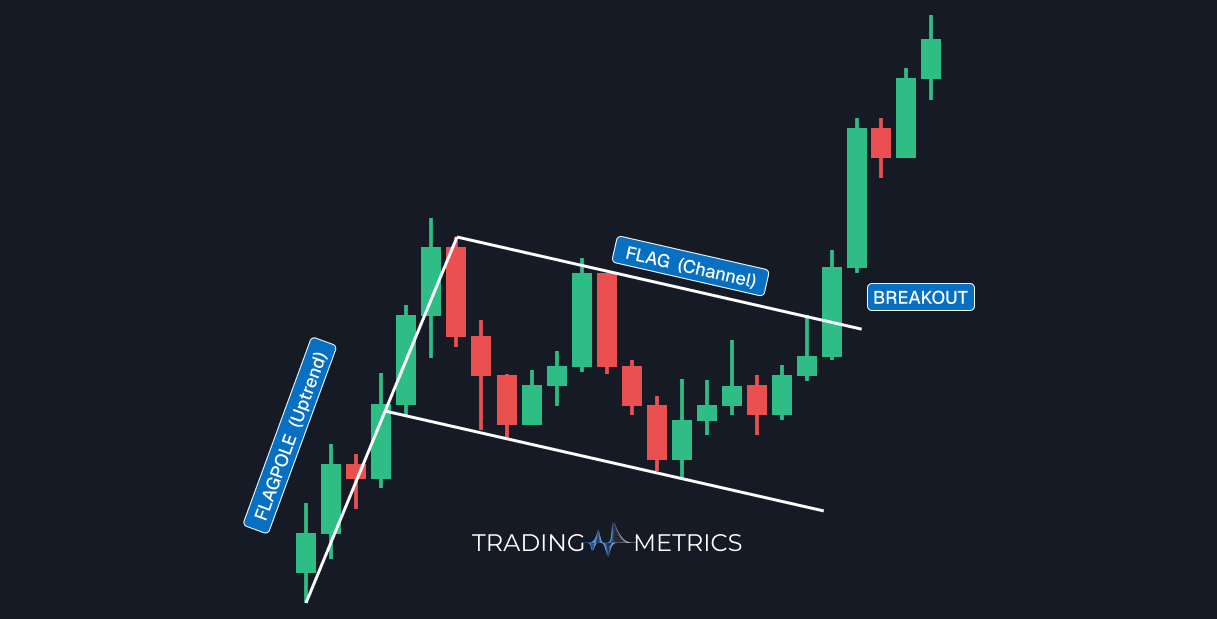
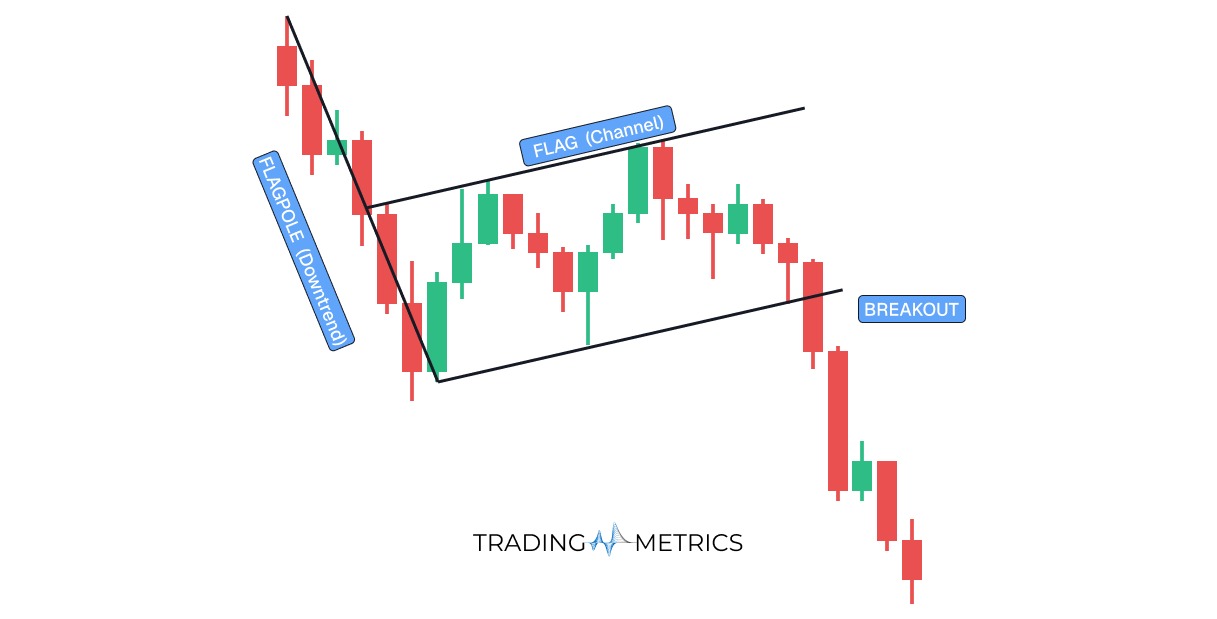
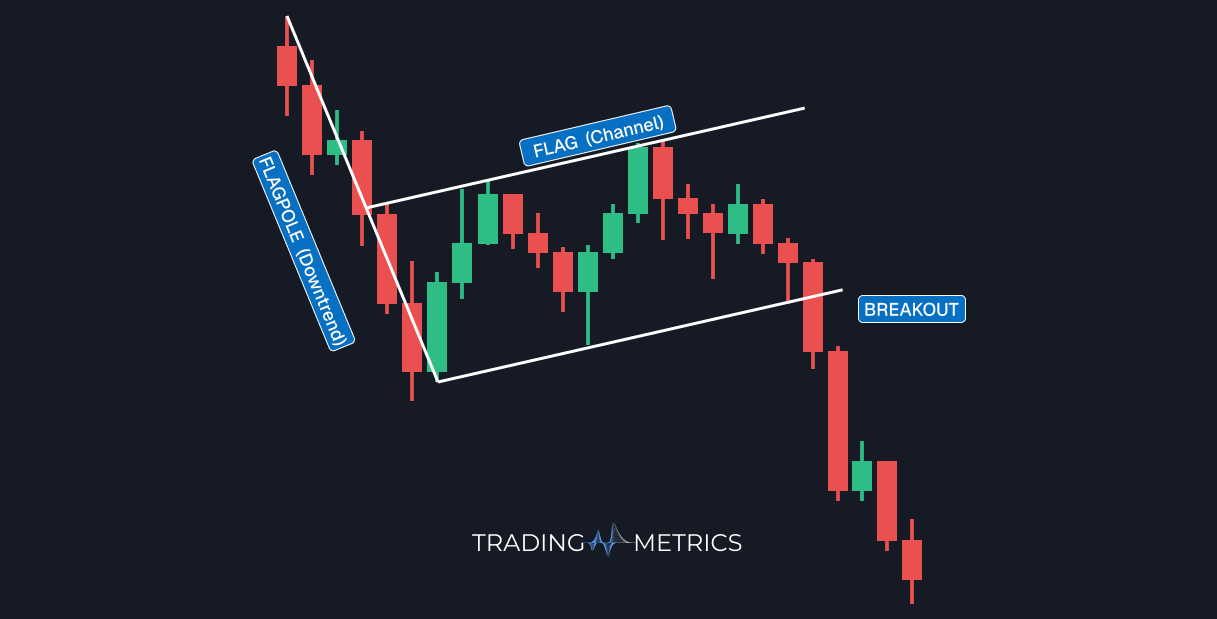
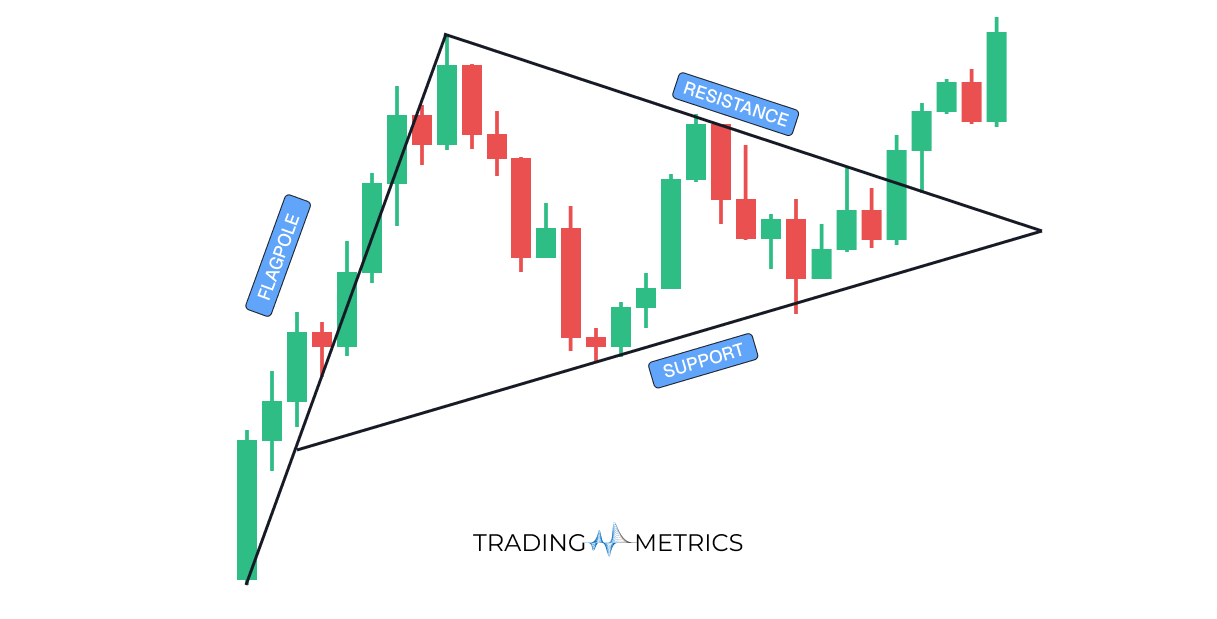
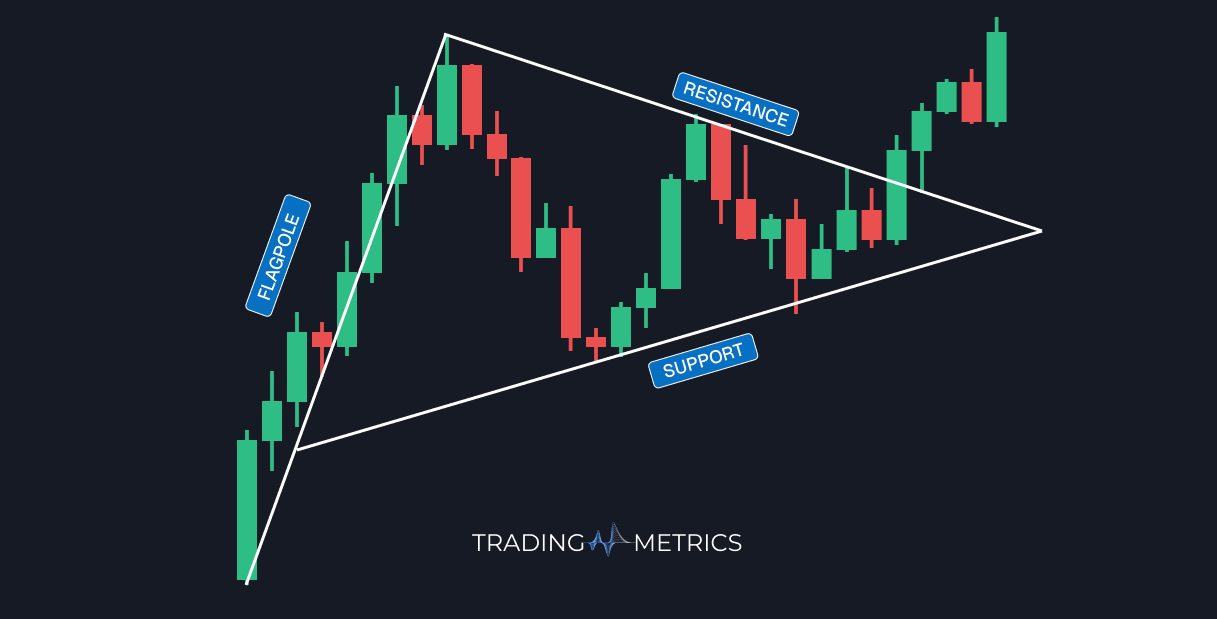
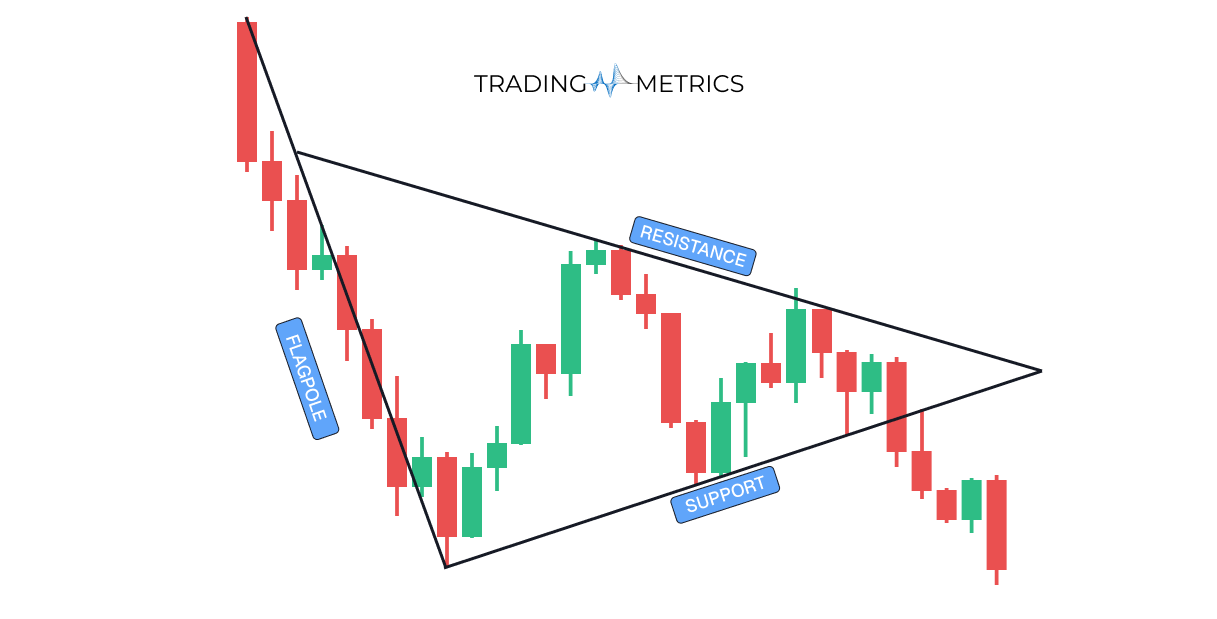
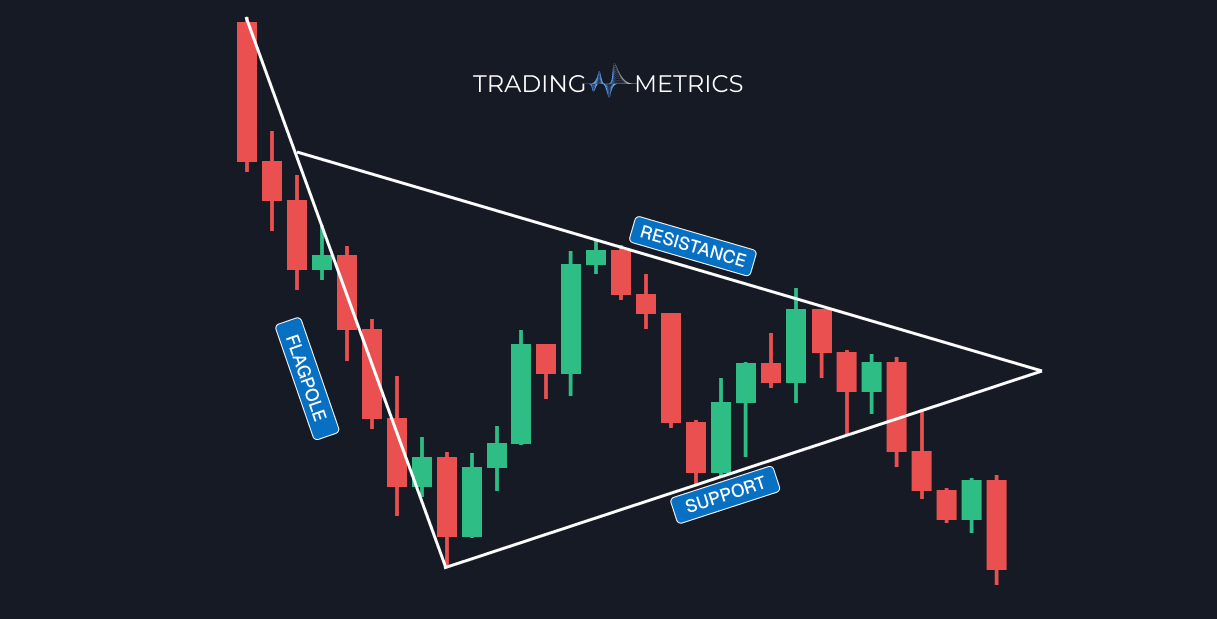
Flag and pennant patterns are continuation patterns in technical analysis that indicate a brief consolidation before the prevailing trend resumes. These patterns typically form after a strong price movement and suggest that the market is pausing before continuing in the same direction.
Frequently Asked Questions
Quick answers based on this page's topic.
These patterns represent very brief pauses in an intense market move. Because the consolidation is short-lived, it indicates that the prevailing momentum is so strong that buyers or sellers are eager to resume the trend, often leading to explosive breakouts that mirror the initial 'pole' move.
Ideally, these patterns should form over 1 to 3 weeks on a daily chart. If the consolidation lasts too long, it may signal a loss of momentum and transform into a different structure, like a rectangle or a reversal pattern, reducing the probability of a sharp continuation.
The flagpole is the sharp, nearly vertical move that precedes the consolidation. It serves as the 'momentum engine' for the pattern. In technical analysis, the height of this pole is used to project the profit target for the next leg of the move after the breakout.