Stochastic RSI (StochRSI): A Faster Read on Momentum Shifts
The Stochastic Relative Strength Index, often referred to as Stochastic RSI, is a technical analysis tool that combines elements of the Stochastic Oscillator and the Relative Strength Index (RSI). Created by Tushar Chande and Stanley Kroll in 1994, the Stochastic RSI is designed to increase sensitivity to market movements, providing traders with more precise signals for overbought and oversold conditions.
In simple terms, the Stochastic RSI measures the level of Relative Strength Index (RSI) relative to its range over a specific period. This means it oscillates between 0 and 1 (or 0 and 100 when expressed as a percentage) and can provide faster signals compared to the traditional Relative Strength Index (RSI).
Markets are driven by emotions, but the Stochastic RSI reminds us to focus on momentum and timing, not just trends
- Anonymous
How to Use Stochastic RSI?
Using Stochastic RSI involves interpreting its values and trends to make trading decisions. Here’s how you can use it:
Identify Oversold and Overbought Conditions
Generate Buy and Sell Signals
Spot Divergences
Learn the full divergence taxonomy. See Full Divergence Guide.
Optimize Timeframes: Shorter timeframes amplify noise - focus on higher timeframes for more reliable signals.
How to Calculate the Stochastic RSI?
The Stochastic RSI is calculated using the following steps:
Calculate the RSI
First, calculate the Relative Strength Index (RSI) over a specified period (usually 14 days). The RSI is calculated as:
Where RS (Relative Strength) is the ratio of the average gains to average losses over the period.
Determine the Stochastic RSI
Once the RSI values are calculated, the Stochastic RSI is determined by applying the Stochastic Oscillator formula to the RSI values:
Where:
- RSI is the current RSI value.
- Lowest RSI is the lowest RSI value over the specified period.
- Highest RSI is the highest RSI value over the specified period.
This formula gives you a value that ranges between 0 and 1, which is often multiplied by 100 to get a percentage.
Adjust Your Periods: Experiment with different StochRSI settings (e.g., 14, 21) to match your trading style.
Importance of Stochastic RSI in Trading
The StochRSI is a important momentum oscillator that combines the benefits of the Stochastic Oscillator and the Relative Strength Index (RSI), offering enhanced sensitivity to price movements. It helps traders identify overbought and oversold conditions, making it a valuable tool for timing entries and exits in highly volatile markets. By emphasizing short-term trends, the StochRSI provides a nuanced view of market momentum, improving decision-making in dynamic trading environments.
Trend matters: Use StochRSI signals in the direction of the prevailing trend for higher accuracy.
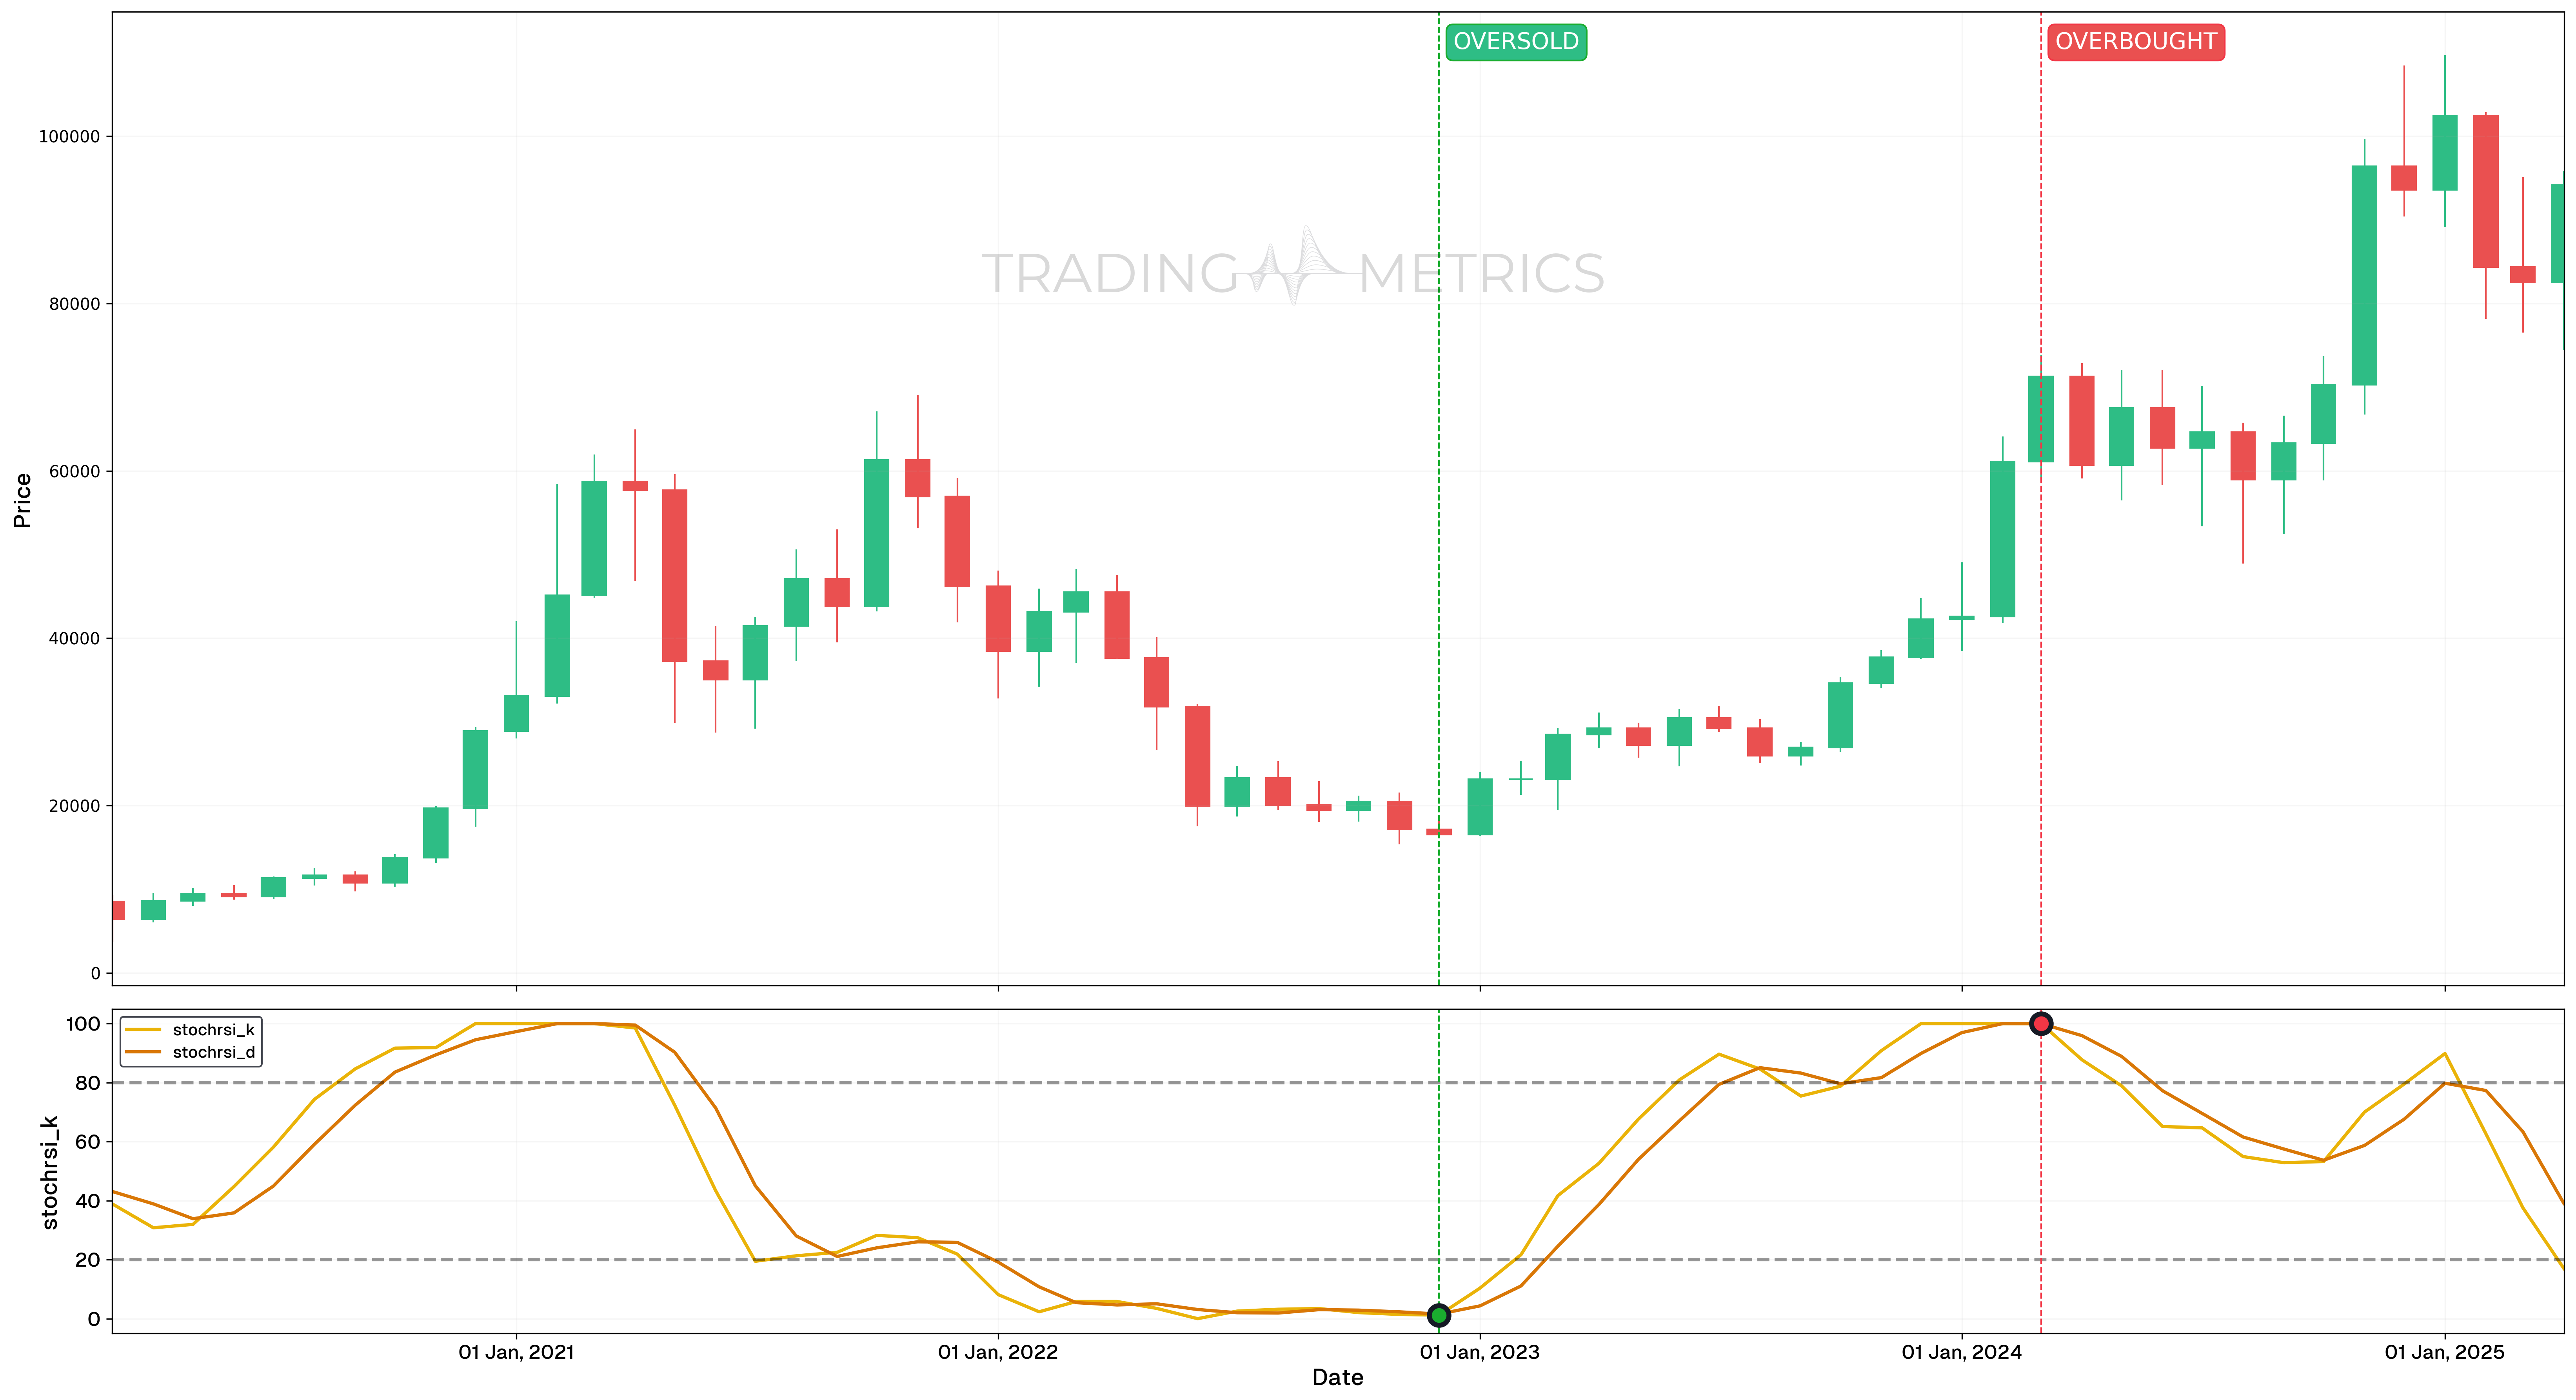
Overbought vs Oversold Conditions
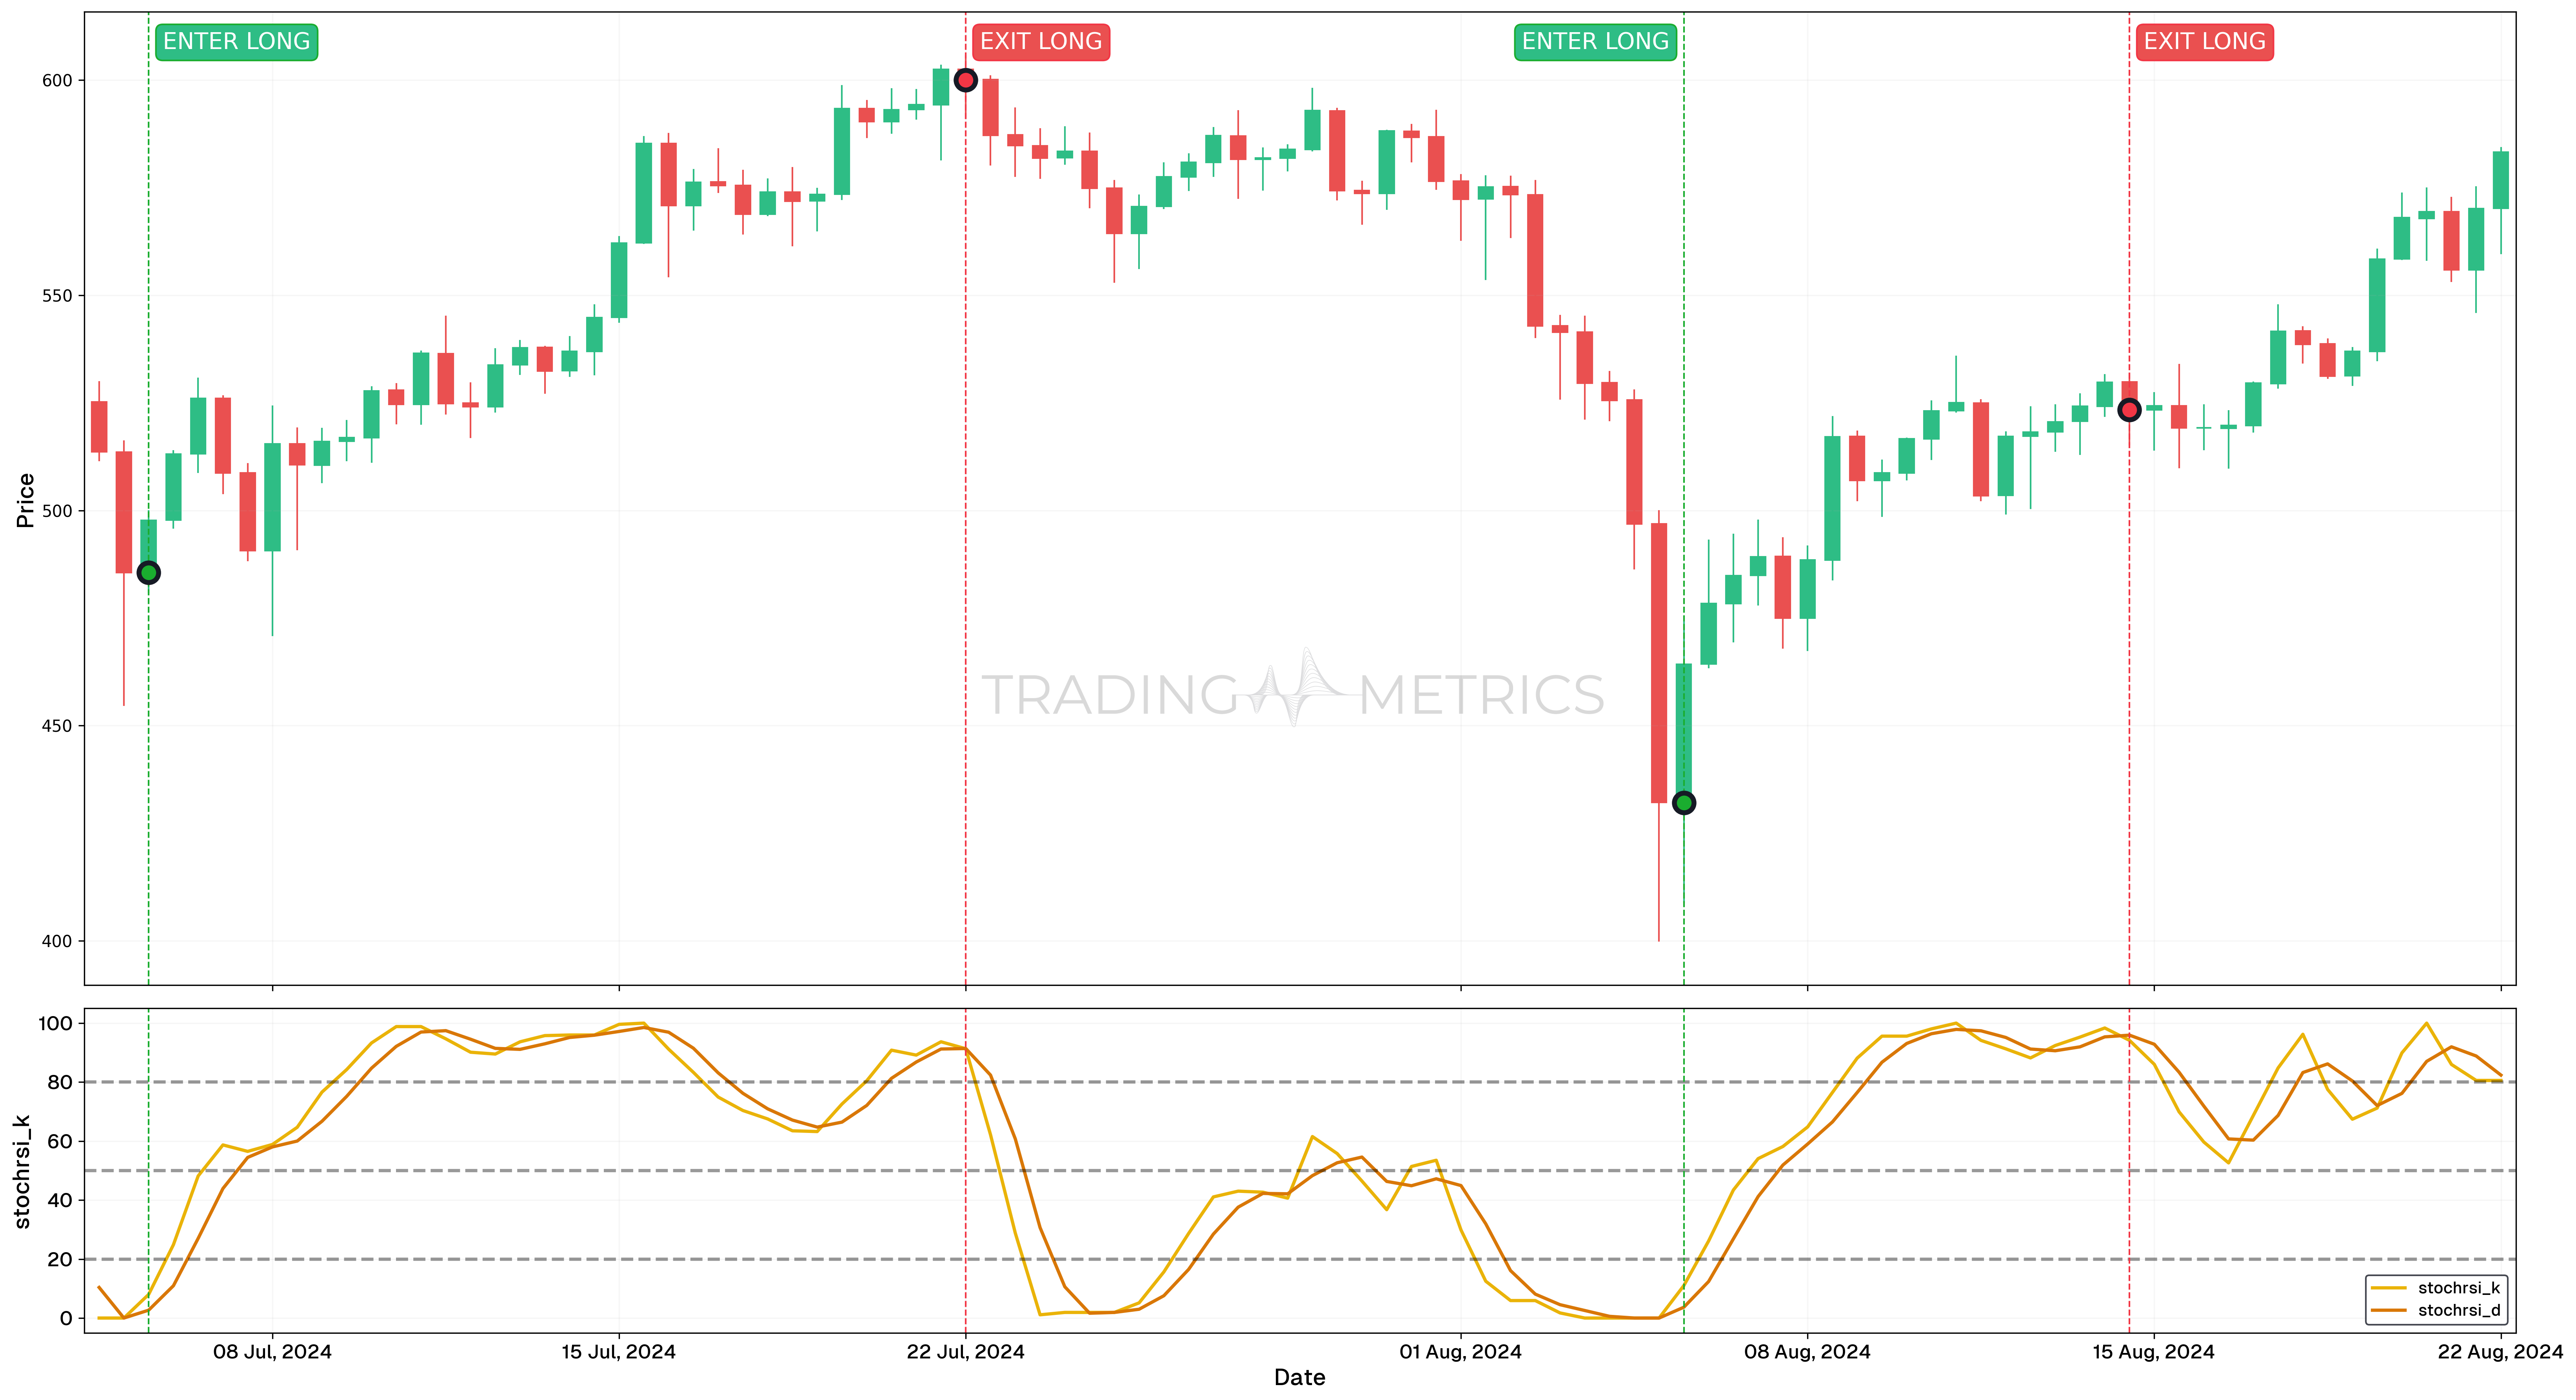
This chart presents the 12h price movements of BNB/USDT alongside the Stochastic RSI (StochRSI) indicator providing correct signals. In this case the StochRSI is a momentum oscillator that identifies potential overbought and oversold conditions by comparing the current RSI value to its range over a specified period.
Analysis
- Buy signals: A buy signal was generated on 5 July 2024, 00:00 and 5 August 2024, 00:00, when the %K line crossed above the %D line at Oversold conditions (below 20). Following these signals, the StochRSI indicator rose above 80, indicating strong upward momentum.
- Sell signals: A sell signal occurred on 22 July 2024, 00:00 and 14 August 2024, 12:00, when the %K line crossed below the %D line at Overbought conditions (above 80). After these signals, the StochRSI indicator fell below 20, indicating strong downward momentum.
Trade Setup
- Entry: Long trades were initiated on 5 July 2024, 12:00 and 5 August 2024, 12:00, when the %K line crossed above the %D line under Oversold conditions. These entry points aligned with the upward momentum identified by the StochRSI moving above 80.
- Exit: Trades were exited on 22 July 2024, 00:00 and 14 August 2024, 12:00, when the %K line crossed below the %D line in Overbought conditions. The StochRSI falling below 20 confirmed the loss of momentum and signaled an optimal time to secure profits.
- Outcome: Both trades captured strong upward price movements during the bullish phases and successfully exited at peak conditions, maximizing returns by aligning with the momentum shifts.
Risk Management
- Stop-Loss Placement: In this setup, the recommended approach is to place the stop-loss at significant support or resistance levels. Identifying previous levels where price action reversed can provide a logical point to mitigate risk while maintaining a structured approach.
- Position sizing: Position size should be calculated to ensure a maximum risk exposure of 2% of trading capital, aligning with disciplined risk management principles.
- Managing Volatility: Considering potential volatility during overbought or oversold conditions, traders are advised to monitor price action closely and adjust the stop-loss level accordingly to protect against sharp reversals.
- Exit Strategy: As the price approaches critical resistance or support levels, implementing a partial exit strategy can help lock in gains while allowing for potential continuation of the prevailing trend.
Conclusion
This trade setup illustrates the effectiveness of the StochRSI indicator in identifying entry and exit points based on overbought and oversold conditions, providing a structured approach to trading.
False signals
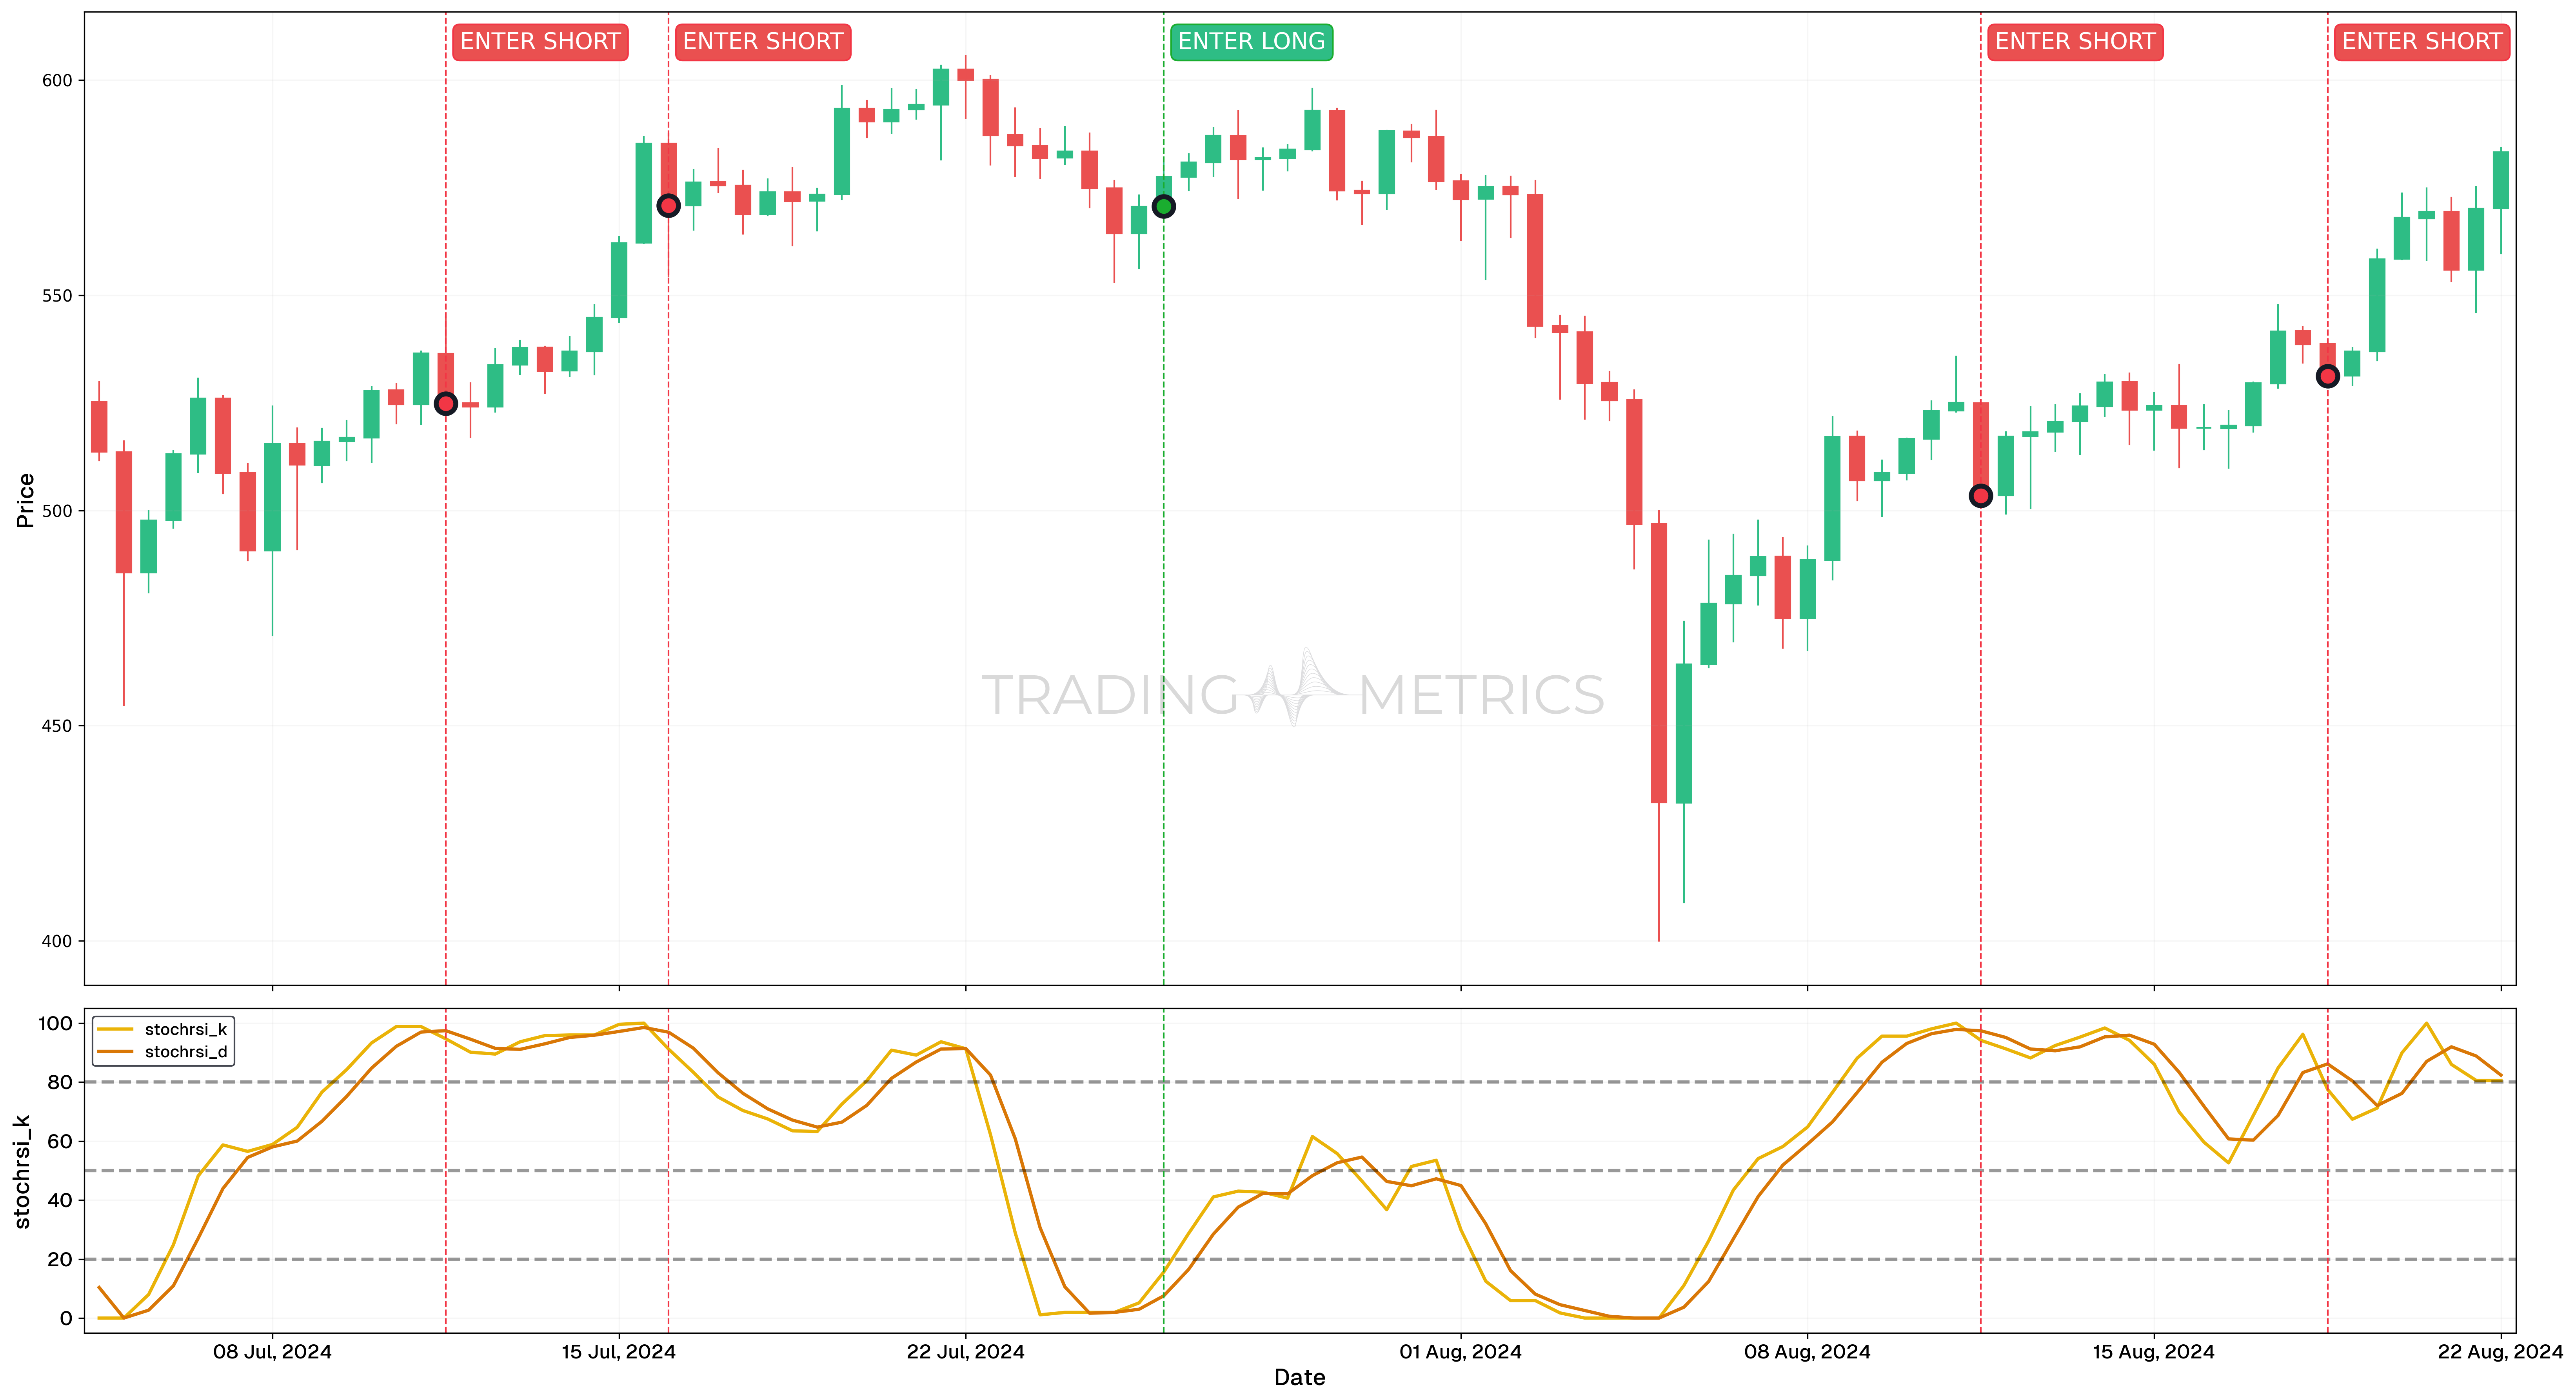
Analysis
- Bad enter long signals: On 25 July 2024, 12:00, the %K line crossed above the %D line at an Oversold condition (below 20), generating a buy signal. However, the StochRSI indicator failed to rise above 80 and instead dropped back below 20, indicating the absence of sustained upward momentum.
- Bad enter short signals: Enter short signals occurred on 11 July 2024, 12:00, 16 July 2024, 00:00, 11 August 2024, 12:00, and 18 August 2024, 12:00, when the %K line crossed below the %D line at Overbought conditions (above 80). After these signals, the StochRSI indicator failed to drop below 20 without first rising above 80 again, showing insufficient downward momentum to validate these enter short signals.
Trade Setup
- Entry: Trades initiated based on the bad long signal on 26 July 2024, 00:00 or the bad enter short signals on other dates failed to align with proper momentum confirmation from the StochRSI indicator.
- Exit: Due to the lack of follow-through in the price movements, these trades likely resulted in minimal gains or losses. The absence of a validated momentum shift undermined the effectiveness of these signals.
- Outcome: These examples emphasize the importance of confirming momentum strength with the StochRSI before acting on long or enter short signals, reducing the likelihood of entering unprofitable trades.
Conclusion
This analysis highlights the risks of acting on signals without full confirmation, reinforcing the need for robust validation when utilizing the StochRSI in trading strategies.
Look for Divergence: Spotting divergence between StochRSI and price action can hint at strong reversals.
Combining Stochastic RSI with Other Tools
Stochastic RSI is often combined with other technical analysis tools to improve trading decisions:
- Moving Averages: Combining Stochastic RSI with moving averages (e.g., 50-day or 200-day MA) can help confirm trends and signal entry/exit points.
- MACD (Moving Average Convergence Divergence): Using MACD alongside Stochastic RSI can help confirm momentum and trend direction.
- Support and Resistance Levels: Identifying key support and resistance levels can enhance the signals provided by Stochastic RSI, giving better context to overbought and oversold conditions.
Overbought ≠ Sell Immediately: Overbought conditions can persist in strong trends - wait for divergence or crossovers.
Key Points
- Momentum of RSI: The Stochastic RSI applies the Stochastic Oscillator formula to the Relative Strength Index (RSI), making it a more sensitive momentum indicator.
- Range Interpretation: Values above 80% indicate overbought conditions, signaling a potential reversal or price correction. Values below 20% indicate oversold conditions, suggesting potential buying opportunities.
- Increased Sensitivity: Compared to traditional RSI, the Stochastic RSI reacts more quickly to price changes, making it ideal for short-term trading.
- Crossover Signals: A bullish signal occurs when the Stochastic RSI line crosses above the signal line in the oversold region. A bearish signal occurs when the Stochastic RSI line crosses below the signal line in the overbought region.
- Divergence Signals: Look for divergences between the Stochastic RSI and price movement to identify potential reversals or trend shifts.
- Best for Range-Bound Markets: The Stochastic RSI performs well in consolidating markets but may produce false signals in strong trending conditions.
- Customizable Parameters: Adjust the RSI and Stochastic settings to fine-tune sensitivity based on your trading strategy or the asset’s volatility.
- Combine with Trend Indicators: Use Stochastic RSI alongside trend-following tools like moving averages or ADX to confirm signals and avoid whipsaws.
- Dynamic Support and Resistance: Key levels (20% and 80%) often align with reversal zones, offering guidance for entry and exit points.
- Backtesting and Refinement: Test Stochastic RSI on historical data to understand its behavior across market conditions and refine its integration into your strategy.
Conclusion
Stochastic RSI is a powerful tool that enhances the traditional RSI by providing more sensitive and timely signals. When used correctly and in conjunction with other indicators, it can significantly improve trading decisions. However, always be cautious of false signals and use additional tools and analysis to confirm your trades.
Frequently Asked Questions
Quick answers based on this page's topic.
Stochastic RSI is essentially an 'indicator of an indicator,' applying the Stochastic formula to RSI values. This makes it much more sensitive than standard RSI, allowing traders to identify overbought and oversold conditions that slower oscillators might miss.
Due to its high sensitivity, Stochastic RSI is excellent for day trading and scalping, where catching small momentum shifts is key. However, for swing trading, it can produce 'noise,' so it is best used on higher timeframes to filter out minor fluctuations.
Because it moves between 0 and 1 rapidly, Stochastic RSI can be prone to false signals. Traders should look for crossovers that happen specifically within the extreme 0.20 (oversold) or 0.80 (overbought) zones and confirm them with price action or volume.