Trading the Bullish Gartley Pattern: Technical Analysis Strategy
The Bullish Gartley Pattern is a classic bullish reversal signal in technical analysis, often surfacing at the end of a downtrend. Picture it as a harmonic blueprint - price tracing an XABCD structure with precise Fibonacci ratios - shifting from bearish decline to bullish ascent. When this pattern forms, it’s a measured sign that bearish momentum is fading, offering traders a chance to buy or go long as an uptrend takes shape.
How to Identify the Bullish Gartley Pattern in Trading
Spotting a Bullish Gartley Pattern means recognizing one of the most reliable harmonic reversal setups. Imagine the market dropping, bouncing, dipping again, and then recovering — all while respecting Fibonacci balance. At the final touch, sellers weaken and buyers regain control. Here’s how to identify it step by step:
Start with the Big Picture
The Bullish Gartley usually appears after a downtrend, when sellers are still dominant but losing strength. The Fibonacci ratios built into the pattern highlight where the decline is likely to exhaust and a bullish reversal can begin.
Trace the XABCD Legs
The Bullish Gartley consists of five price swings, each confirmed by Fibonacci levels:
- XA: The initial sharp decline that starts the structure.
- AB: A rebound upward into 61.8% of XA.
- BC: A pullback retracing 38.2%–88.6% of AB without breaking below X.
- CD: A final rally into the 78.6% retracement of XA, often aligned with the 113%–161.8% projection of BC.
- D Point: The completion of the pattern and the key reversal area.
Focus on the PRZ (Potential Reversal Zone)
The PRZ (Potential Reversal Zone) marks point D, the critical hotspot where the Bullish Gartley completes.
- It’s defined by the 78.6% retracement of XA combined with the BC projection range (113%–161.8%).
- This confluence creates the reversal cluster at D, where buyers are expected to step in.
Wait for Confirmation
Confirmation comes when price rebounds at D and pushes higher:
- A strong bullish candlestick (e.g., engulfing, hammer), or
- A close above B signaling regained bullish momentum.
This confirmation is the entry trigger for long setups.
Check Volume for Extra Confidence
Volume validates the reversal:
- Strong during XA (sellers in control).
- Lighter during AB and BC (bearish momentum fading).
- A volume spike at D signals buyers taking over and strengthens the reversal case.
Target Zone: Project the XA leg height upward from point D, or use the 38.2% and 61.8% retracements of AD as realistic price targets.
How to Trade the Bullish Gartley Pattern (Trading Example)
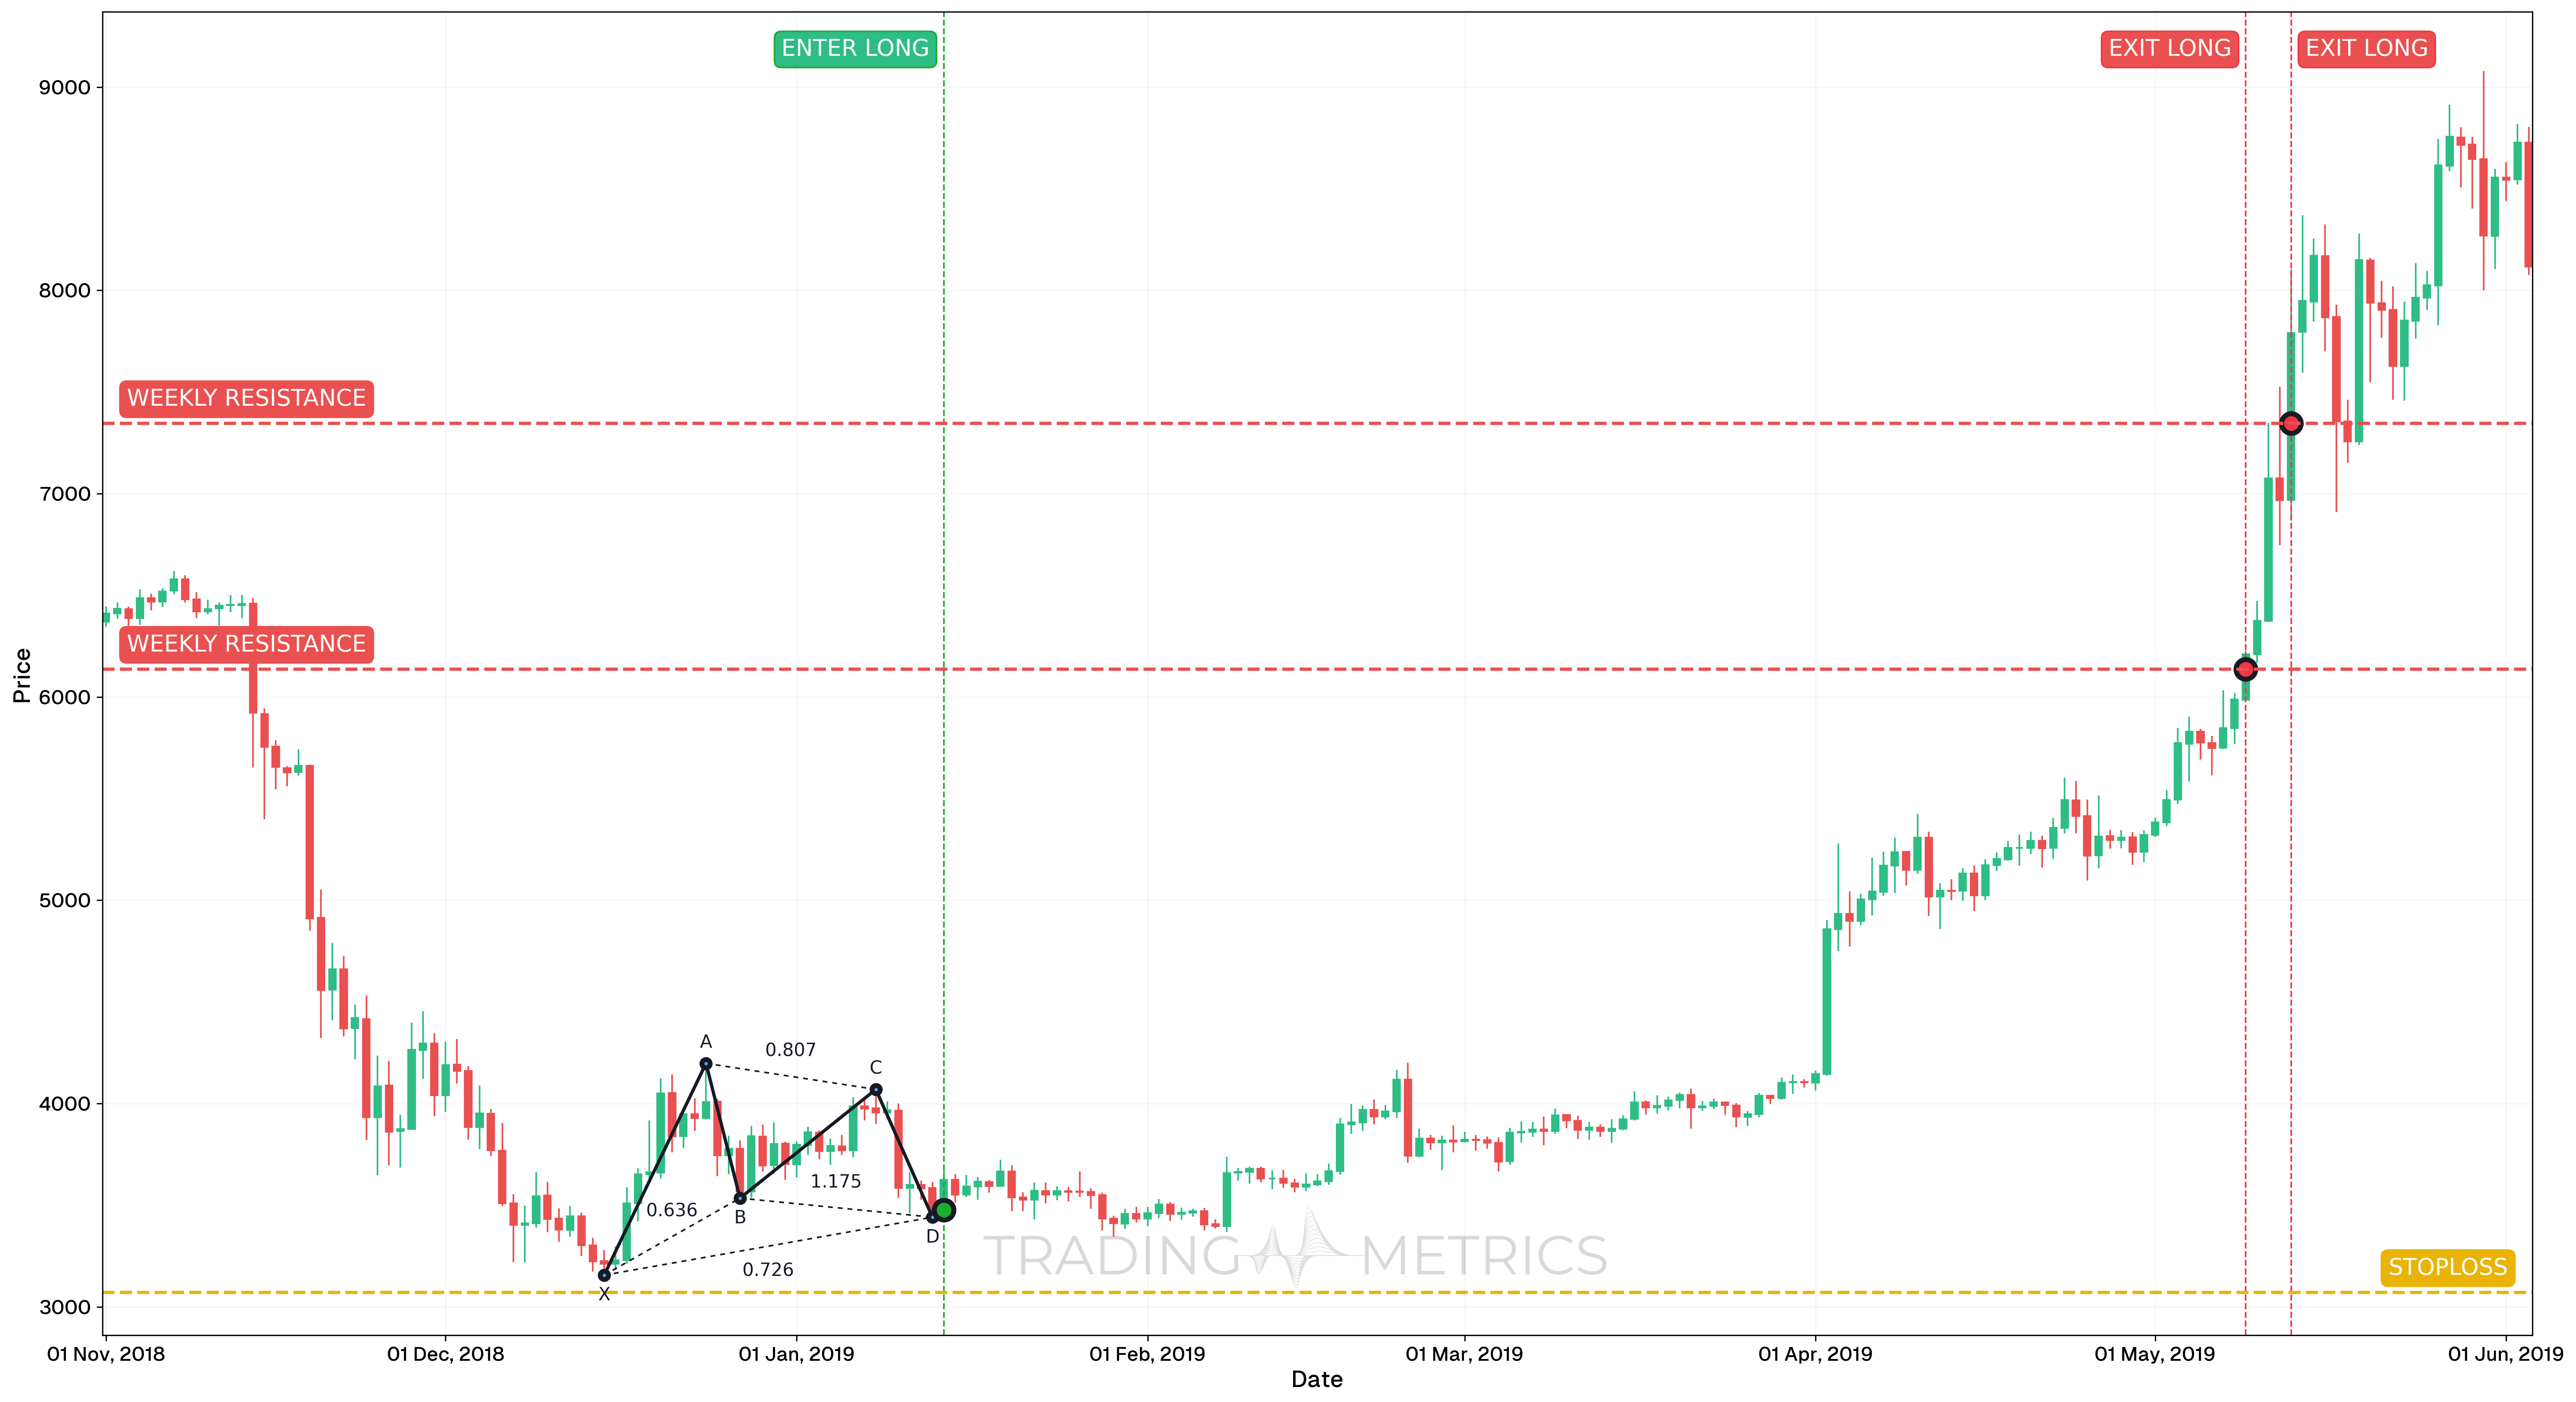
To demonstrate the practical use of the Bullish Gartley pattern, we’ll look at a trade on the BTCUSDT pair using the daily chart. This harmonic reversal setup occurred after an extended bear market and offered a deep buying opportunity that led to a major shift in trend.
Analysis
Between November 2018 and June 2019, BTCUSDT formed a well-defined Bullish Gartley pattern. After a prolonged downtrend, the market printed a harmonic retracement structure, with price completing the pattern at a key Fibonacci confluence near $3,071.39. The setup offered a rare opportunity to position early into a new bullish cycle.
Trade Setup
-
Entry: The position was entered on January 14, 2019, at $3,477.56, after the completion of the Bullish Gartley pattern at point D. Entry signals included:
- RSI rising from oversold levels and crossing above 50, confirming bullish momentum.
- Rejection wicks and bullish structure forming at the support zone
- High confluence with harmonic projection levels
-
Exit: The trade was scaled out in multiple stages, locking profits as price advanced into weekly resistance.
- May 9, 2019 (TP1): Price hit $6,136.97
- May 13, 2019 (TP2): Price hit $7,345.01
-
Outcome: This pattern marked the bottom of the cycle and delivered strong upside, validating the harmonic structure with clear momentum and price expansion.
Risk Management
- Stop-Loss placement: The stop-loss was placed at $3,071.39, placed just below point X, which aligns with the D-point invalidation level.
- Position sizing: The position was calculated using a 2% capital risk model, factoring the entry at $3,477.56 and stop at $3,071.39.
- Volatility Consideration: The market showed extreme Volatility compression during the formation of the pattern, signaling potential for a high-momentum breakout on confirmation.
- Adaptive Exit Strategy: Using multiple take-profit levels allowed flexible and emotion-free execution while capturing a significant part of the trend reversal.
Volume Balance: A volume spike at D with confirmation lifts the pattern into a bullish surge.
Pre-Trade Checklist
Balance the Proof: Pair the pattern with volume spikes and indicators like RSI to dodge fakes and boost your odds.
Key Points
- Fibonacci Precision: Exact ratios (61.8% AB, 38.2%-88.6% BC, 78.6% XA) boost reliability - loose fits dilute it.
- Time Frame: Balances strongest on daily or weekly charts after downtrends.
- Combine with Indicators: Use moving averages or RSI to confirm the reversal.
- Breakout Confirmation: A close above B confirms the reversal – avoid entering at D without confirmation.
- Price Target: Measure the XA leg or use Fibonacci Retracement of XD for targets above the close.
- Risk Management: Set a stop-loss below D for tighter control, or beneath X for full invalidation.
Wait for the Balance: Acting before confirmation risks a Bullish Gartley trap - let the reversal align.
Conclusion
The Bullish Gartley Pattern is a trader’s classic tool for catching bullish reversals. Its XABCD blueprint, paired with volume, RSI, and moving averages, can balance into big gains. Whether in crypto, stocks, or forex, this pattern sharpens your edge. Stay precise, manage your risk, and let the Bullish Gartley align - that harmonic shift could rise into a winning trade.
Frequently Asked Questions
Quick answers based on this page's topic.
The Bullish Gartley identifies a high-probability reversal zone at the end of a corrective 'W' structure. By entering at the 78.6% retracement of the original move (point D), traders can buy an asset at a deep discount while the overall trend remains intact.
The PRZ for a Bullish Gartley is the convergence of the 78.6% retracement of XA, the 127% or 161.8% extension of the BC leg, and a completed AB=CD pattern. When these levels align, they create a 'Hard Floor' where institutional buying typically occurs.
The stop-loss is technically placed just below point X. Since point X represents the origin of the bullish move, a break below it invalidates the entire harmonic structure and confirms that the 'dip' has turned into a genuine trend reversal to the downside.