Tweezer Bottoms Pattern: When Two Candles Hit the Same Floor
The Tweezer Bottoms pattern is a precise bullish reversal signal in technical analysis, often forming at the base of a downtrend. Imagine it as a double-tap recovery - two candles with nearly identical lows - marking a solid floor where selling pressure fades. When this pattern takes shape, it’s a sharp cue that bearish momentum is waning, offering traders a chance to buy or go long as an uptrend prepares to rise.
How to Identify the Tweezer Bottoms Pattern in Trading
The Tweezer Bottoms is a bullish reversal candlestick pattern. It forms at the end of a downtrend when sellers attempt to push lower twice but fail at the same support level, signaling potential reversal. Here’s the step-by-step guide.
Start with the Big Picture
This pattern shows up after a downtrend. It suggests that sellers are losing momentum as price finds strong support at a repeated low.
Trace the Candle Sequence
The setup develops in two candles:
- First Candle: A bearish candle, extending the downtrend and setting a low.
- Second Candle: A bullish (or sometimes neutral) candle with a matching low to the first, showing that sellers failed to drive the price lower again.
Zero in on the Confirmation Level
The confirmation level is the high of the second candle. A close above this level indicates that buyers are taking control.
Watch the Breakout
The bullish trigger comes when a subsequent candle closes above the second candle’s high. That’s your entry point, confirming the reversal. (Some traders seek extra confirmation before acting.)
Check Volume for Additional Confirmation
Volume behavior can strengthen the signal:
- Rises on the first candle, reflecting heavy selling.
- Holds or dips on the second, showing fading bearish strength.
- Spikes on the confirming bullish candle, reinforcing the reversal’s validity.
Rise Pin: Measure the range from the tweezer low to the second candle’s high or use nearby resistance levels to project a realistic price target upward from the confirmation close.
How to Trade the Tweezer Bottoms Pattern (Trading Example)
To illustrate how the Tweezer Bottoms pattern can be used to enter a trade, we will choose the ARBUSDT pair. This bullish reversal pattern appeared on the daily chart after a sharp decline, offering a potential pivot into trend recovery.
Analysis
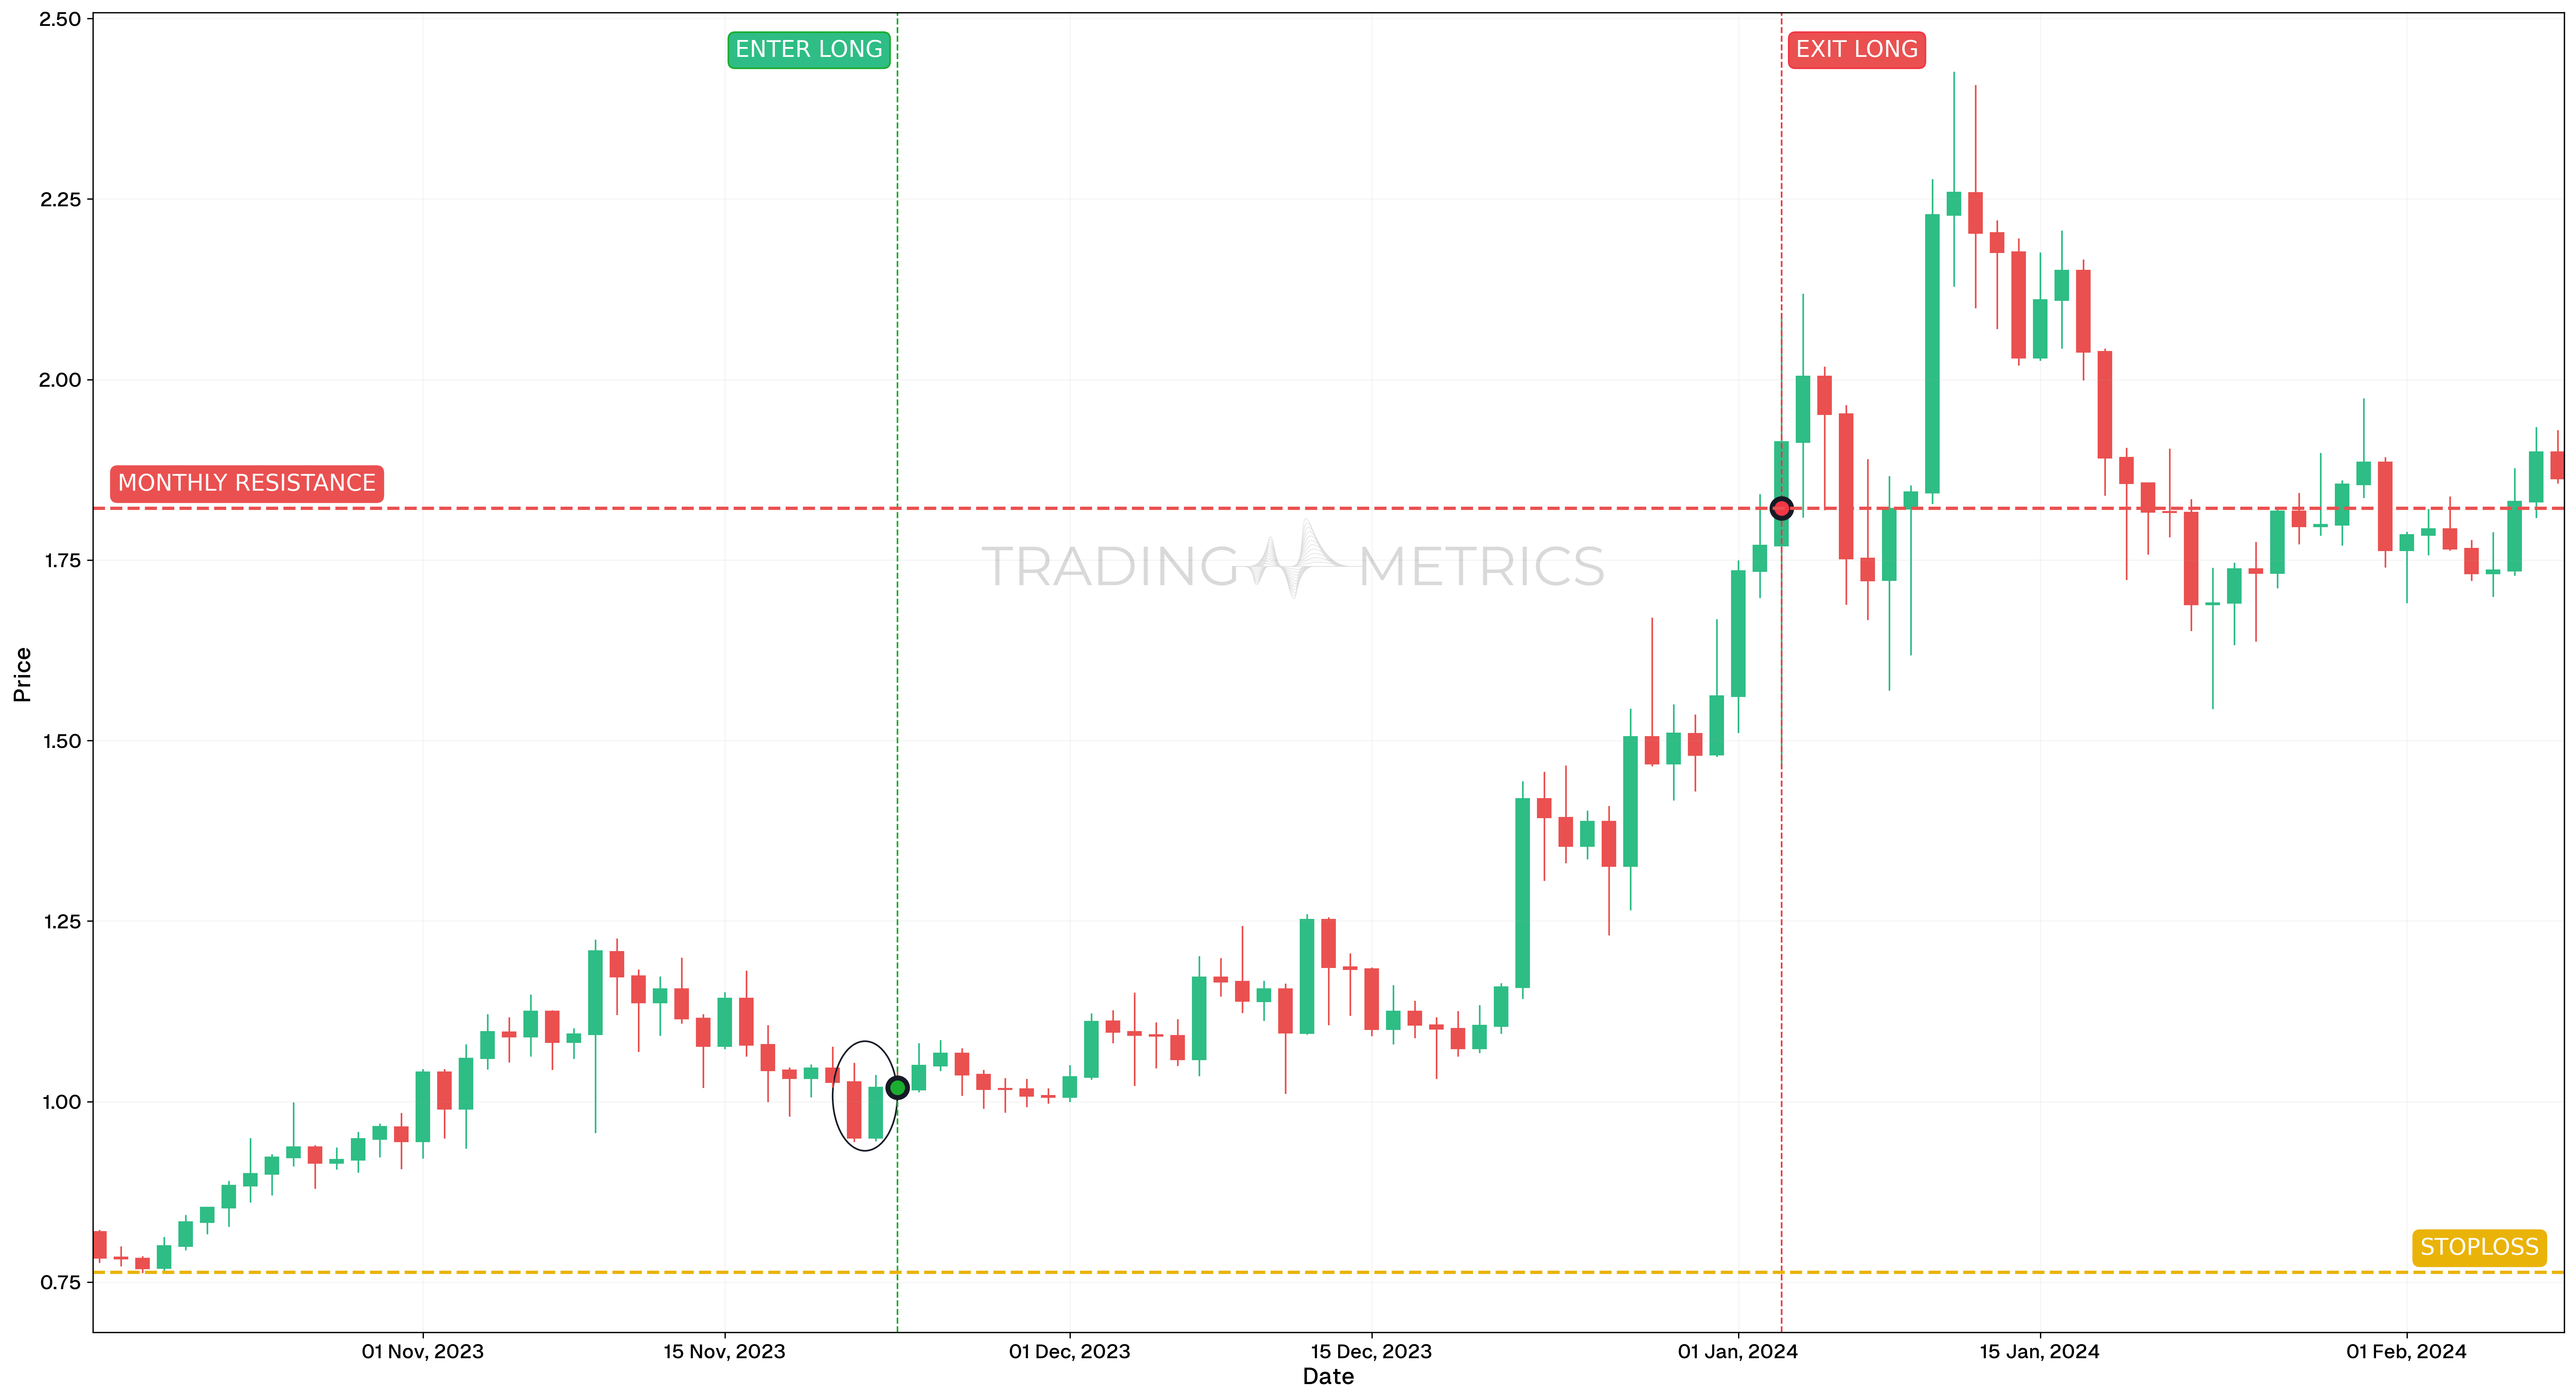
On November 23, 2023, ARBUSDT formed a Tweezer Bottoms pattern with two candles showing nearly identical lows. This signaled rejection of lower prices and potential accumulation. The setup formed at the bottom of a local downtrend and was supported by strengthening momentum.
Trade Setup
-
Entry: The trade was opened on November 23, 2023, at $1.0193, following the confirmation of the Tweezer Bottoms structure. Additional confluence included:
- RSI was rising and approaching the 50 level, indicating a potential shift in momentum toward the upside
-
Exit: The position was closed on January 3, 2024, at $1.8215, as price approached the previous all-time high, which often acts as a resistance and profit-taking zone.
-
Outcome: The Tweezer Bottoms pattern resulted in a 78.7% move, confirming its strength as a reversal signal when combined with momentum confirmation.
Risk Management
- Stop-Loss placement: The stop-loss was placed at $0.7633, just below the wick lows of the tweezer structure, where the trade thesis would be invalidated.
- Position sizing: A 2% capital risk model was used based on the risk distance between entry and stop.
- Risk-Reward Ratio: The trade delivered a Risk-Reward Ratio of 1:3.13, making it a strong candidate for trend reversal with defined risk.
- Volatility Consideration: The trade setup developed during a temporary contraction in Volatility, followed by an expansion as price moved off the lows, favoring early entry before momentum acceleration.
- Adaptive Exit Strategy: A trailing stop could have been used under higher lows, or profits scaled across Fibonacci extension levels depending on risk preference.
Volume Lift: A volume spike on the confirming candle lifts the pattern into a bullish turn.
Pre-Trade Checklist
Tap the Proof: Pair the pattern with volume spikes and indicators like RSI to dodge fakes and boost your odds.
Key Points
- Low Precision: Nearly identical lows boost reliability - wide gaps dilute it.
- Time Frame: Lifts brightest on daily or weekly charts after downtrends.
- Combine with Indicators: Use moving averages or RSI to confirm the reversal.
- Breakout Confirmation: A close above the second candle’s high sets the turn - don’t jump on the bottoms alone.
- Price Target: Measure the range from low to high or use resistance levels for a target above the confirmation.
- Risk Management: Set a stop-loss below the tweezer low to limit losses if it fails.
Wait for the Tap: Acting before confirmation risks a tapped trap - let the reversal confirm.
Conclusion
The Tweezer Bottoms pattern is a trader’s precise tool for catching bullish reversals. Its double-tap floor, paired with volume, RSI, and moving averages, can pin down big gains. Whether in crypto, stocks, or forex, this pattern sharpens your edge. Stay patient, manage your risk, and let the bottoms align - that stalled drop could lift into a winning trade.
Frequently Asked Questions
Quick answers based on this page's topic.
Tweezer Bottoms signal a 'Hard Floor' in the market. It occurs when two consecutive candles hit the exact same low price before bouncing. This indicates that despite two separate attempts by sellers, the market refused to break a specific support level, proving that demand is perfectly neutralizing supply at that price.
The difference is scale. A Double Bottom is a macro chart pattern that can take weeks to form, while Tweezer Bottoms is a micro candlestick pattern consisting of just two candles. However, Tweezer Bottoms often mark the precise turning point that forms the second trough of a larger Double Bottom structure.
For a high-probability setup, the lows should be virtually identical. This precision confirms the strength of the buyers defending that level. If the second candle dips significantly lower than the first, the 'matching' logic is invalidated, and the pattern loses its structural reliability as a floor.