Ascending Triangle Pattern: Trading Pressure Against a Ceiling
The Ascending Triangle pattern is a sturdy bullish continuation signal in technical analysis, often forming during an uptrend. Picture it as a tightening squeeze - price pressing against a flat resistance line while climbing higher lows - before breaking upward. When this pattern takes shape, it’s a strong hint that bullish momentum is coiling up, offering traders a chance to buy or go long as the uptrend surges ahead.
How to Identify the Ascending Triangle Pattern in Trading
The Ascending Triangle is a bullish continuation formation. It develops when price consolidates between a flat resistance line and a rising support line, showing mounting buying pressure. The setup confirms when price breaks above resistance. Here’s how to spot it:
Start with the Big Picture
This pattern appears during an uptrend. Sellers repeatedly hold the same ceiling, but buyers step in at higher and higher levels, signaling strength building beneath the surface.
Trace the Triangle Shape
The Ascending Triangle is built from two converging lines. Recognizing them confirms the setup.
- Resistance Line: A flat horizontal boundary where rallies stall.
- Support Line: An upward-sloping boundary connecting higher lows.
- Triangle Formation: Price compresses between the two lines as pressure builds.
Zero in on the Resistance Line
The resistance line is the ceiling where sellers cap gains. Once this line is broken, the triangle completes.
Watch the Breakout
The bullish trigger comes when price closes above resistance.
- A decisive break over the upper boundary or
- A strong bullish candle
Both confirm continuation of the uptrend and provide the entry.
Check Volume for Additional Confirmation
Volume action validates the breakout.
- Rises during the prior uptrend.
- Dips as the triangle narrows.
- Spikes on the breakout, confirming buyer dominance.
Rise High: Measure the height of the triangle at its widest point (base) and project it upward from the break for a realistic price target.
How to Trade the Ascending Triangle Pattern (Trading Example)
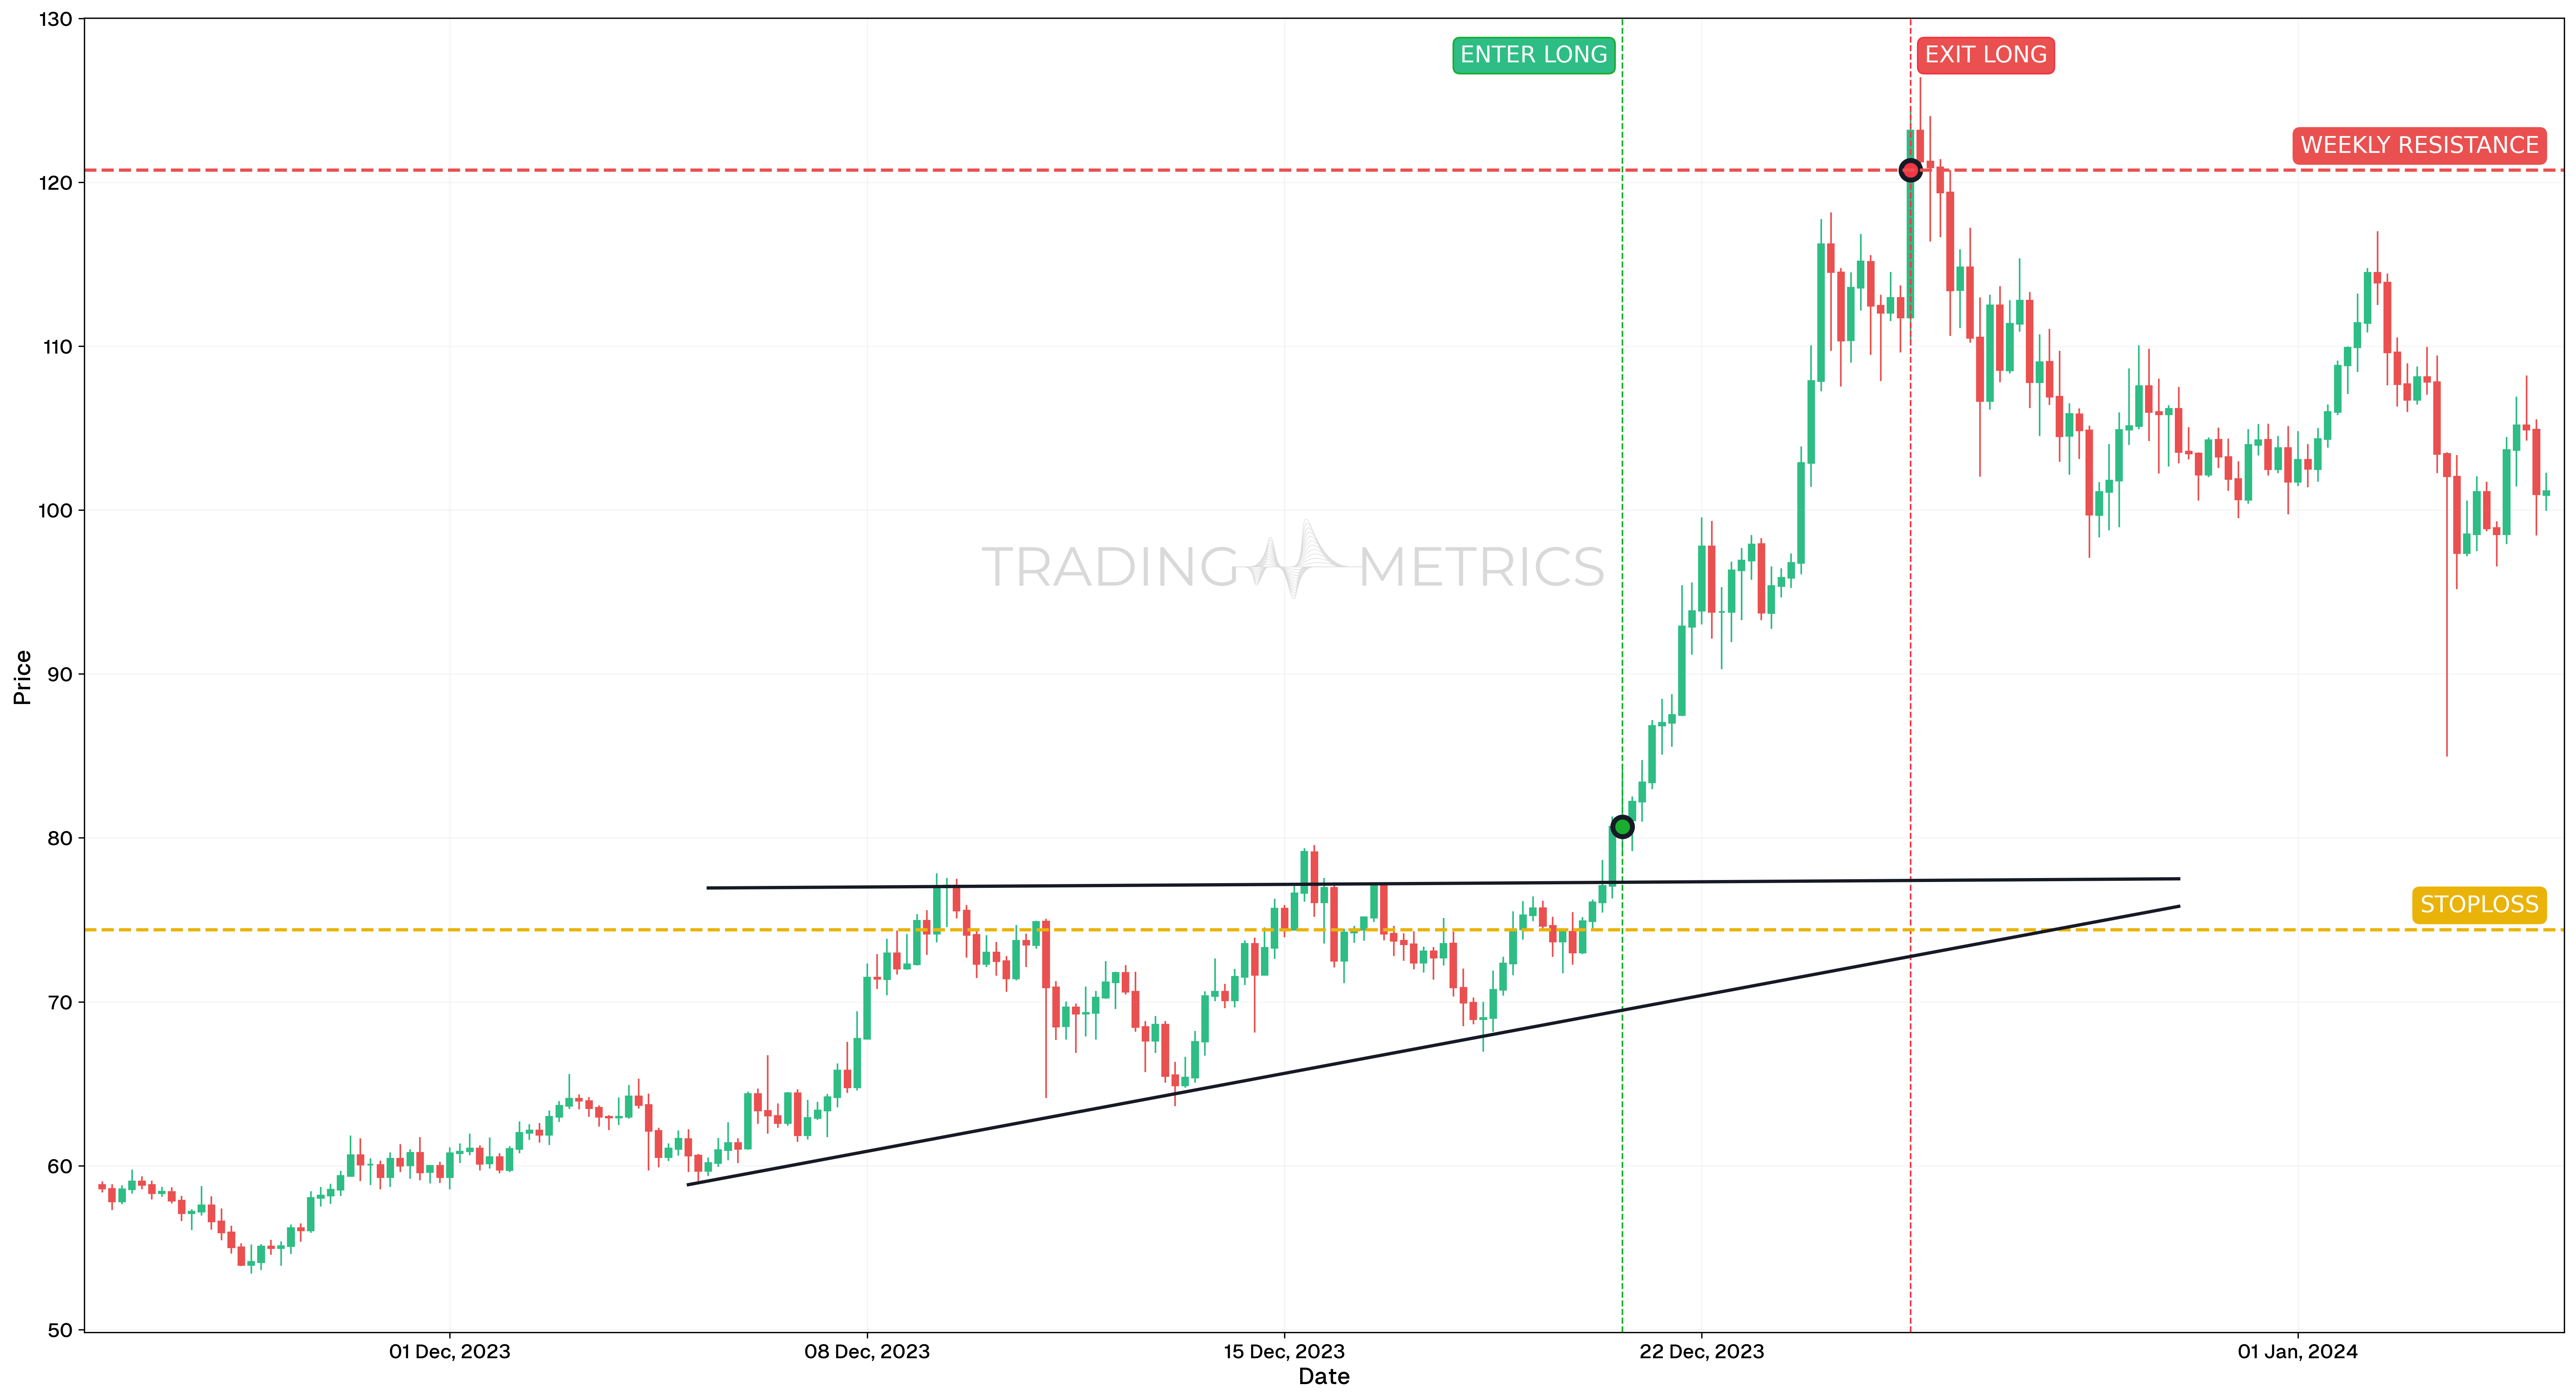
To illustrate how the Ascending Triangle pattern can be used to enter a trade, we will choose the SOLUSDT pair. This breakout setup appeared on the 4-hour chart, signaling accumulation beneath resistance and building pressure for continuation.
Analysis
From late November to mid-December 2023, SOLUSDT printed an Ascending Triangle with consistent horizontal resistance and rising higher lows. This signaled increased demand on each dip, with sellers gradually being overwhelmed. The breakout occurred on December 20, confirming bullish continuation.
Trade Setup
-
Entry: The trade was entered on December 20, 2023, at 16:00, at $80.68, as price broke above the flat resistance level. Momentum confirmed the breakout:
-
Exit: The position was closed on December 25, 2023, at 12:00, at $120.73, near a major previous support/resistance level. This target was chosen based on historical price rejection zones to secure gains efficiently.
-
Outcome: The Ascending Triangle breakout yielded a 49.6% gain, and the price followed through immediately after breakout with strong momentum and no retest.
Risk Management
- Stop-Loss placement: The stop-loss was placed at $74.40, just below the triangle’s rising trendline and prior swing low. This protected the position against breakdowns below the structure.
- Position sizing: A 2% capital risk model was used, calculated based on the distance from entry to stop-loss.
- Risk-Reward Ratio: The trade delivered a Risk-Reward Ratio of 1:6.38, offering exceptional reward potential with tight invalidation.
- Volatility Consideration: During the pattern, Volatility was contracting, followed by a rapid expansion on breakout. Waiting for confirmation reduced the risk of premature entries within the pattern.
- Adaptive Exit Strategy: More aggressive traders could have trailed the stop under each new higher low, but this exit secured profits at a major horizontal zone.
Volume Thrust: A volume spike on the resistance break lifts the triangle into a bullish surge.
Pre-Trade Checklist
Triangle Proof: Pair the pattern with volume spikes and indicators like RSI to dodge fakes and boost your odds.
Key Points
- Line Clarity: A flat resistance and rising support strengthen the signal - wobbly lines dilute it.
- Time Frame: Hits hardest on daily or weekly charts in active uptrends.
- Combine with Indicators: Use moving averages or RSI to refine your entry.
- Breakout Confirmation: The resistance break keeps the trend rolling - don’t jump too soon.
- Price Target: Measure the triangle’s base height, project up from the break for your goal.
- Risk Management: Set a stop-loss below the last higher low to limit losses if it fails.
Wait for the Break: Acting before the resistance break risks a triangle trap - let it ascend.
Conclusion
The Ascending Triangle pattern is a trader’s sturdy tool for riding bullish continuations. Its tightening squeeze, paired with volume, RSI, and moving averages, can spark big gains. Whether in crypto, stocks, or forex, this pattern sharpens your edge. Stay patient, manage your risk, and let the triangle tighten - that coiled pressure could launch into a winning rise.
Frequently Asked Questions
Quick answers based on this page's topic.
The horizontal line represents a 'supply ceiling' where a large seller or group of sellers is exiting. The rising support line shows that buyers are becoming more aggressive, willing to buy at higher and higher prices. This tension eventually 'breaks' the ceiling, leading to a bullish surge.
Measure the vertical distance of the triangle at its widest point (the base) and project that distance upward from the horizontal resistance line. This target provides a clear, objective goal for the next phase of the bullish trend.
If price breaks the support line instead of the resistance, the bullish continuation thesis is invalidated. This is often a sign of a 'failed pattern' and can lead to a sharp reversal, as buyers who were betting on the breakout are forced to liquidate their positions.