Rectangles and Triangles: Trading Market Consolidation
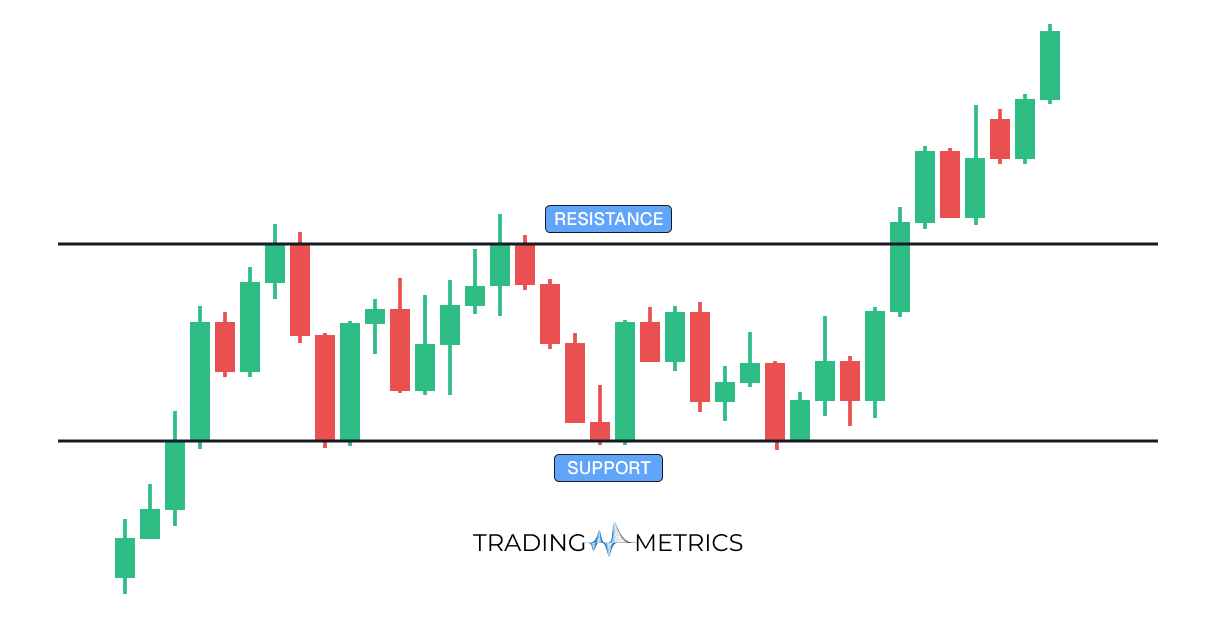
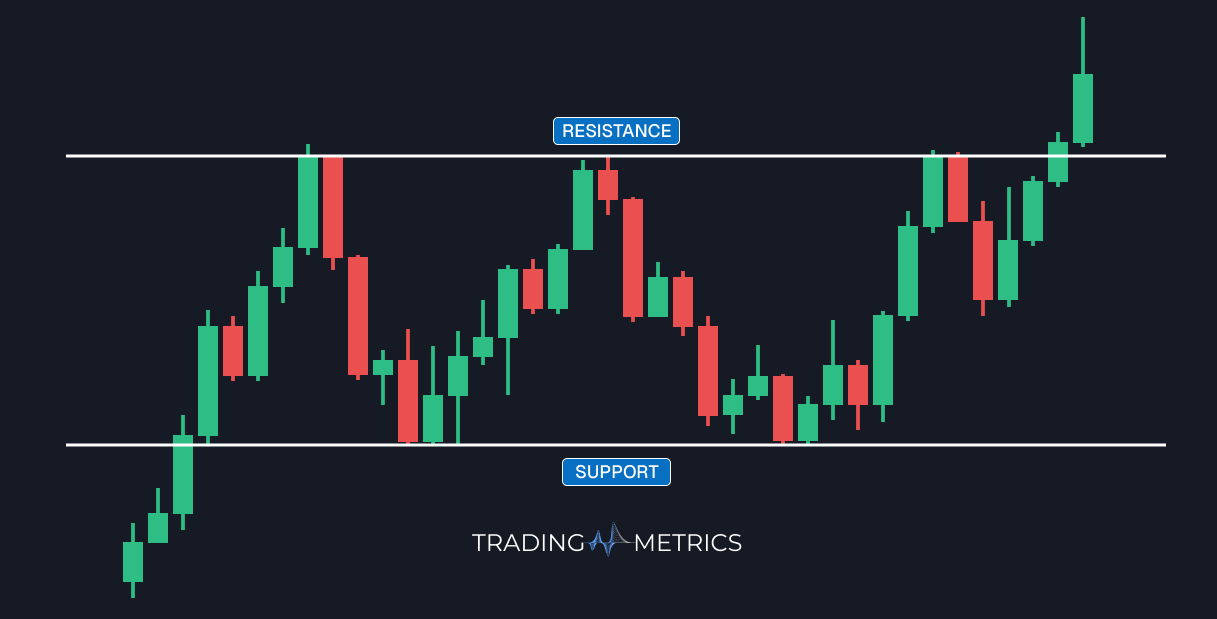
Rectangles and triangles are continuation patterns in technical analysis that represent periods of consolidation before the prevailing trend resumes. These patterns form as price moves within defined support and resistance levels, signaling potential breakout opportunities in the direction of the existing trend.
Frequently Asked Questions
Quick answers based on this page's topic.
While flags are short-term and aggressive, rectangles and triangles represent longer periods of consolidation. They signal a deeper battle between supply and demand, often involving multiple touches of support and resistance before the market gathers enough energy to continue the primary trend.
While primarily continuation patterns, they are 'directionally neutral' until a breakout occurs. If a rectangle or triangle breaks in the opposite direction of the prior trend, it becomes a reversal signal. However, statistically, they are more likely to resolve in favor of the established momentum.
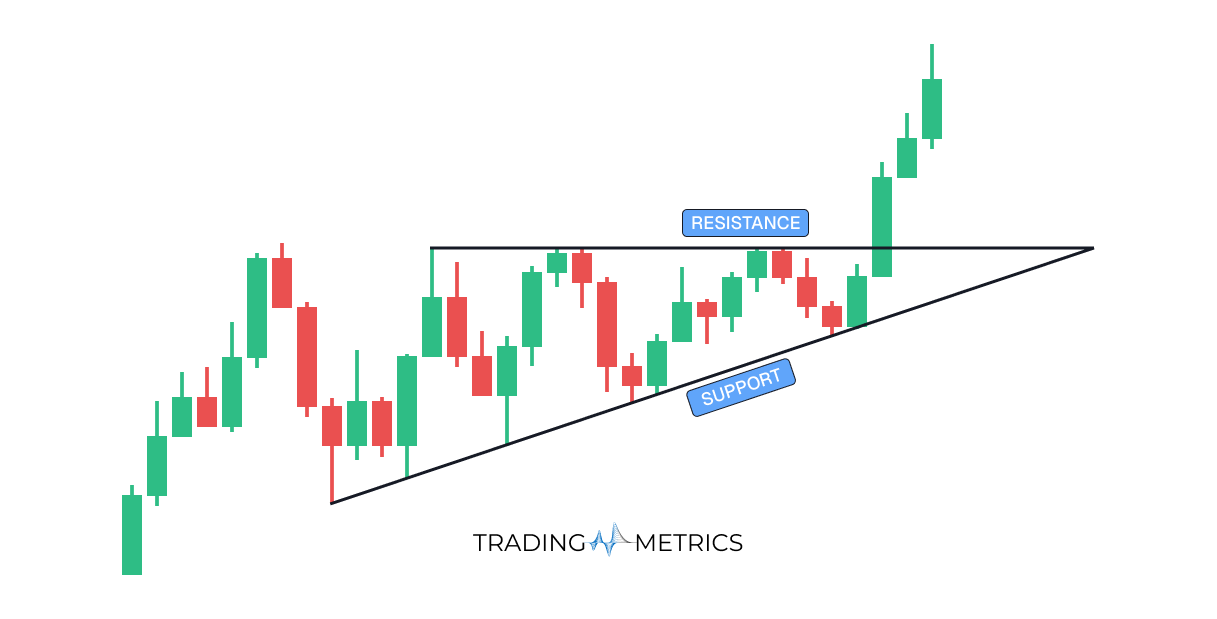
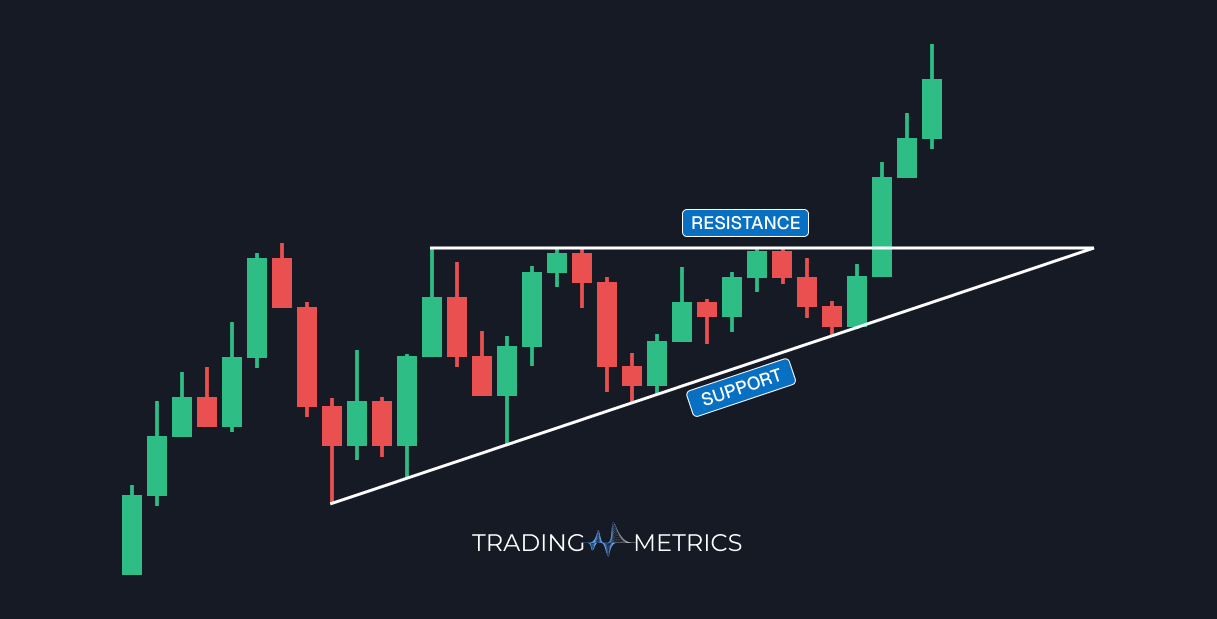
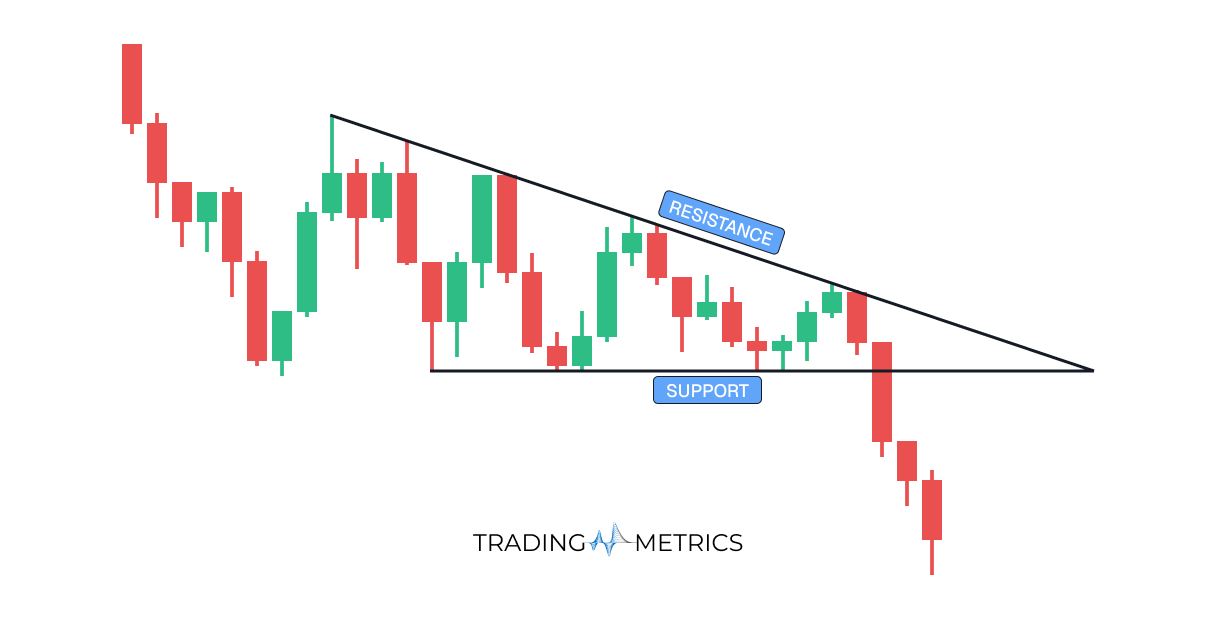
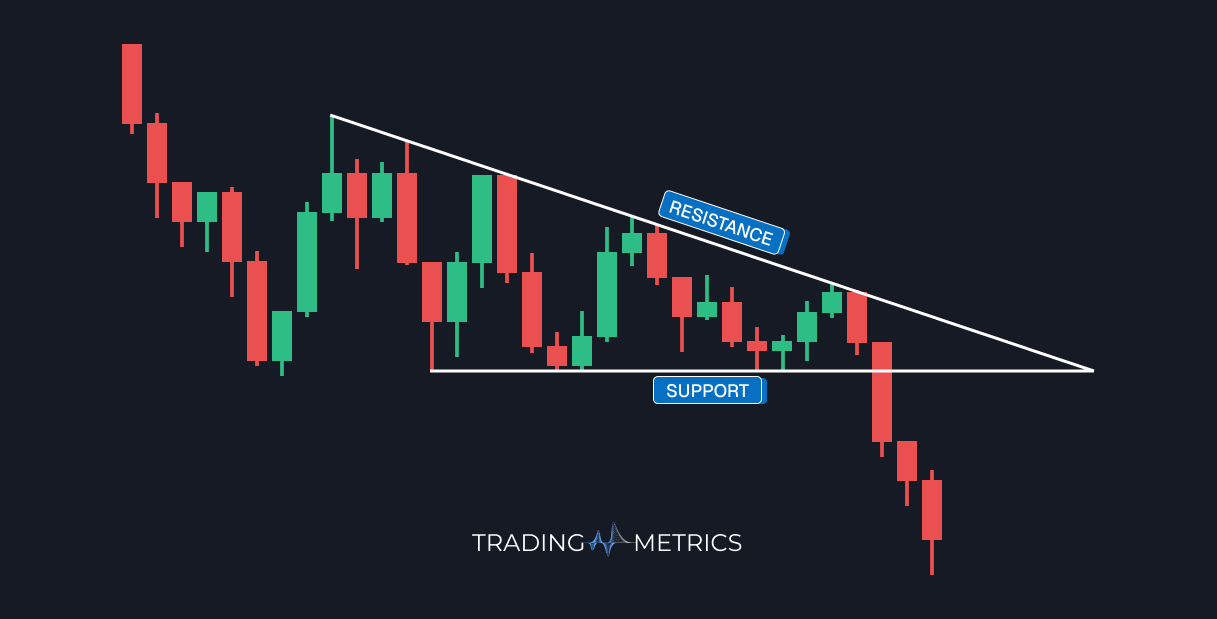
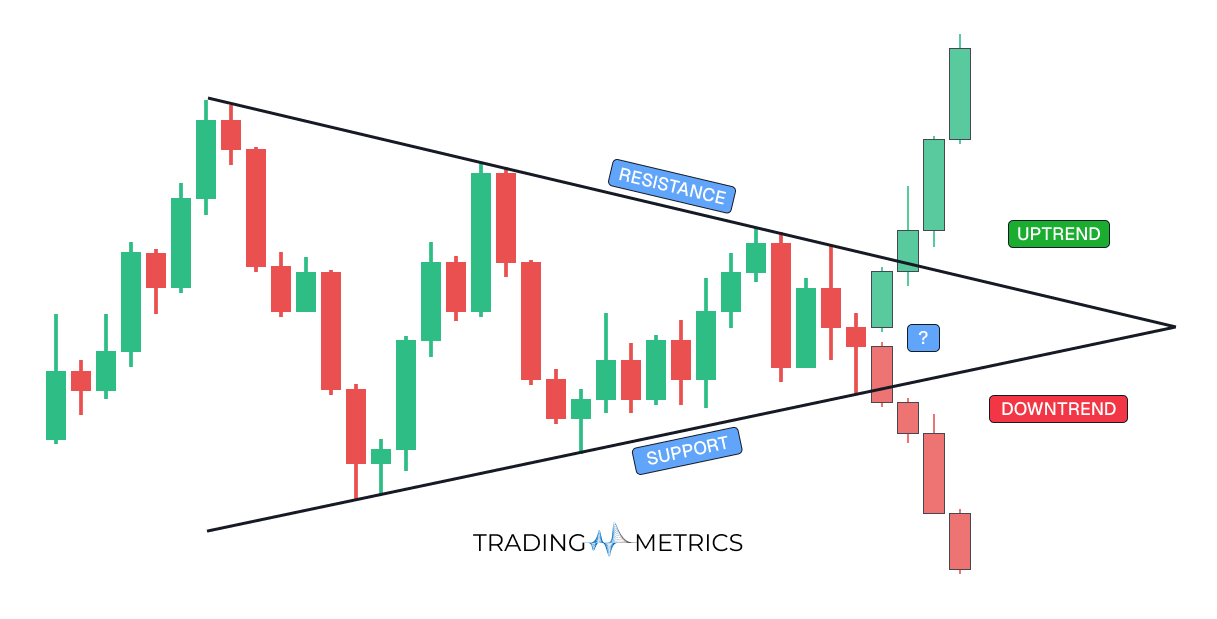
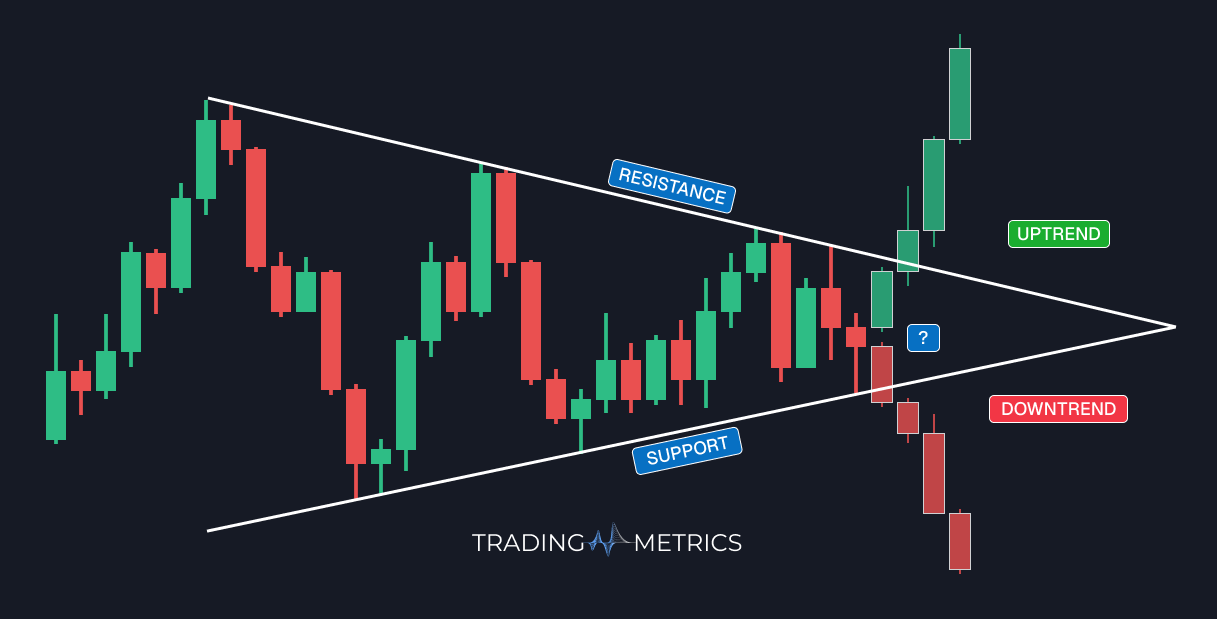
In a triangle, the range between highs and lows narrows, 'compressing' the price into a tight corner. This compression represents building energy; the smaller the range becomes, the more explosive the eventual breakout is likely to be when one side finally overwhelms the other.