Morning Star Pattern: Reading the Three-Candle Bottom Reversal
The Morning Star pattern is a radiant bullish reversal signal in technical analysis, often glowing at the nadir of a downtrend. Picture it as a dawn trio - three candles where a steep bearish drop fades into indecision, then blazes into a bullish rise - announcing a new day. When this pattern forms, it’s a bright sign that bearish momentum is fading, offering traders a chance to buy or go long as an uptrend ignites with promise.
Mind the Gap: A gap between the first and second candle is typical in stocks due to overnight trading. In crypto, where markets trade 24/7, this gap often doesn’t appear - and that’s okay. The pattern remains valid even without it.
How to Identify the Morning Star Pattern in Trading
The Morning Star is a bullish reversal candlestick pattern. It forms at the end of a downtrend when sellers lose control, indecision takes hold, and buyers step in with strength. Confirmation is key to validate the shift. Here’s the step-by-step guide.
Start with the Big Picture
This pattern appears after a downtrend. It signals a transition: first selling pressure, then hesitation, then a decisive bullish response.
Trace the Candle Sequence
The setup unfolds over three candles:
- First Candle: A long bearish candle extending the downtrend, closing near its low.
- Second Candle: A small-bodied candle (bearish, bullish, or Doji), often gapping down — showing indecision.
- Third Candle: A long bullish candle that closes deep into the first candle’s body, ideally above its midpoint — confirming buyer strength.
Zero in on the Confirmation Level
The confirmation level is the midpoint of the first candle’s body. A close above this level validates the reversal, though a close above the second candle’s high can give an earlier signal.
Watch the Breakout
The bullish trigger comes when the third candle closes above the first candle’s midpoint. That’s your entry point, marking the start of a potential trend reversal.
Check Volume for Additional Confirmation
Volume behavior adds weight to the setup:
- Rises on the first candle as selling peaks.
- Dips on the second candle during indecision.
- Spikes on the third candle as buyers take over, confirming the bullish shift.
Rise Glow: Measure the first candle’s body or use nearby resistance levels to project a realistic price target upward from the third candle’s close.
How to Trade the Morning Star Pattern (Trading Example)
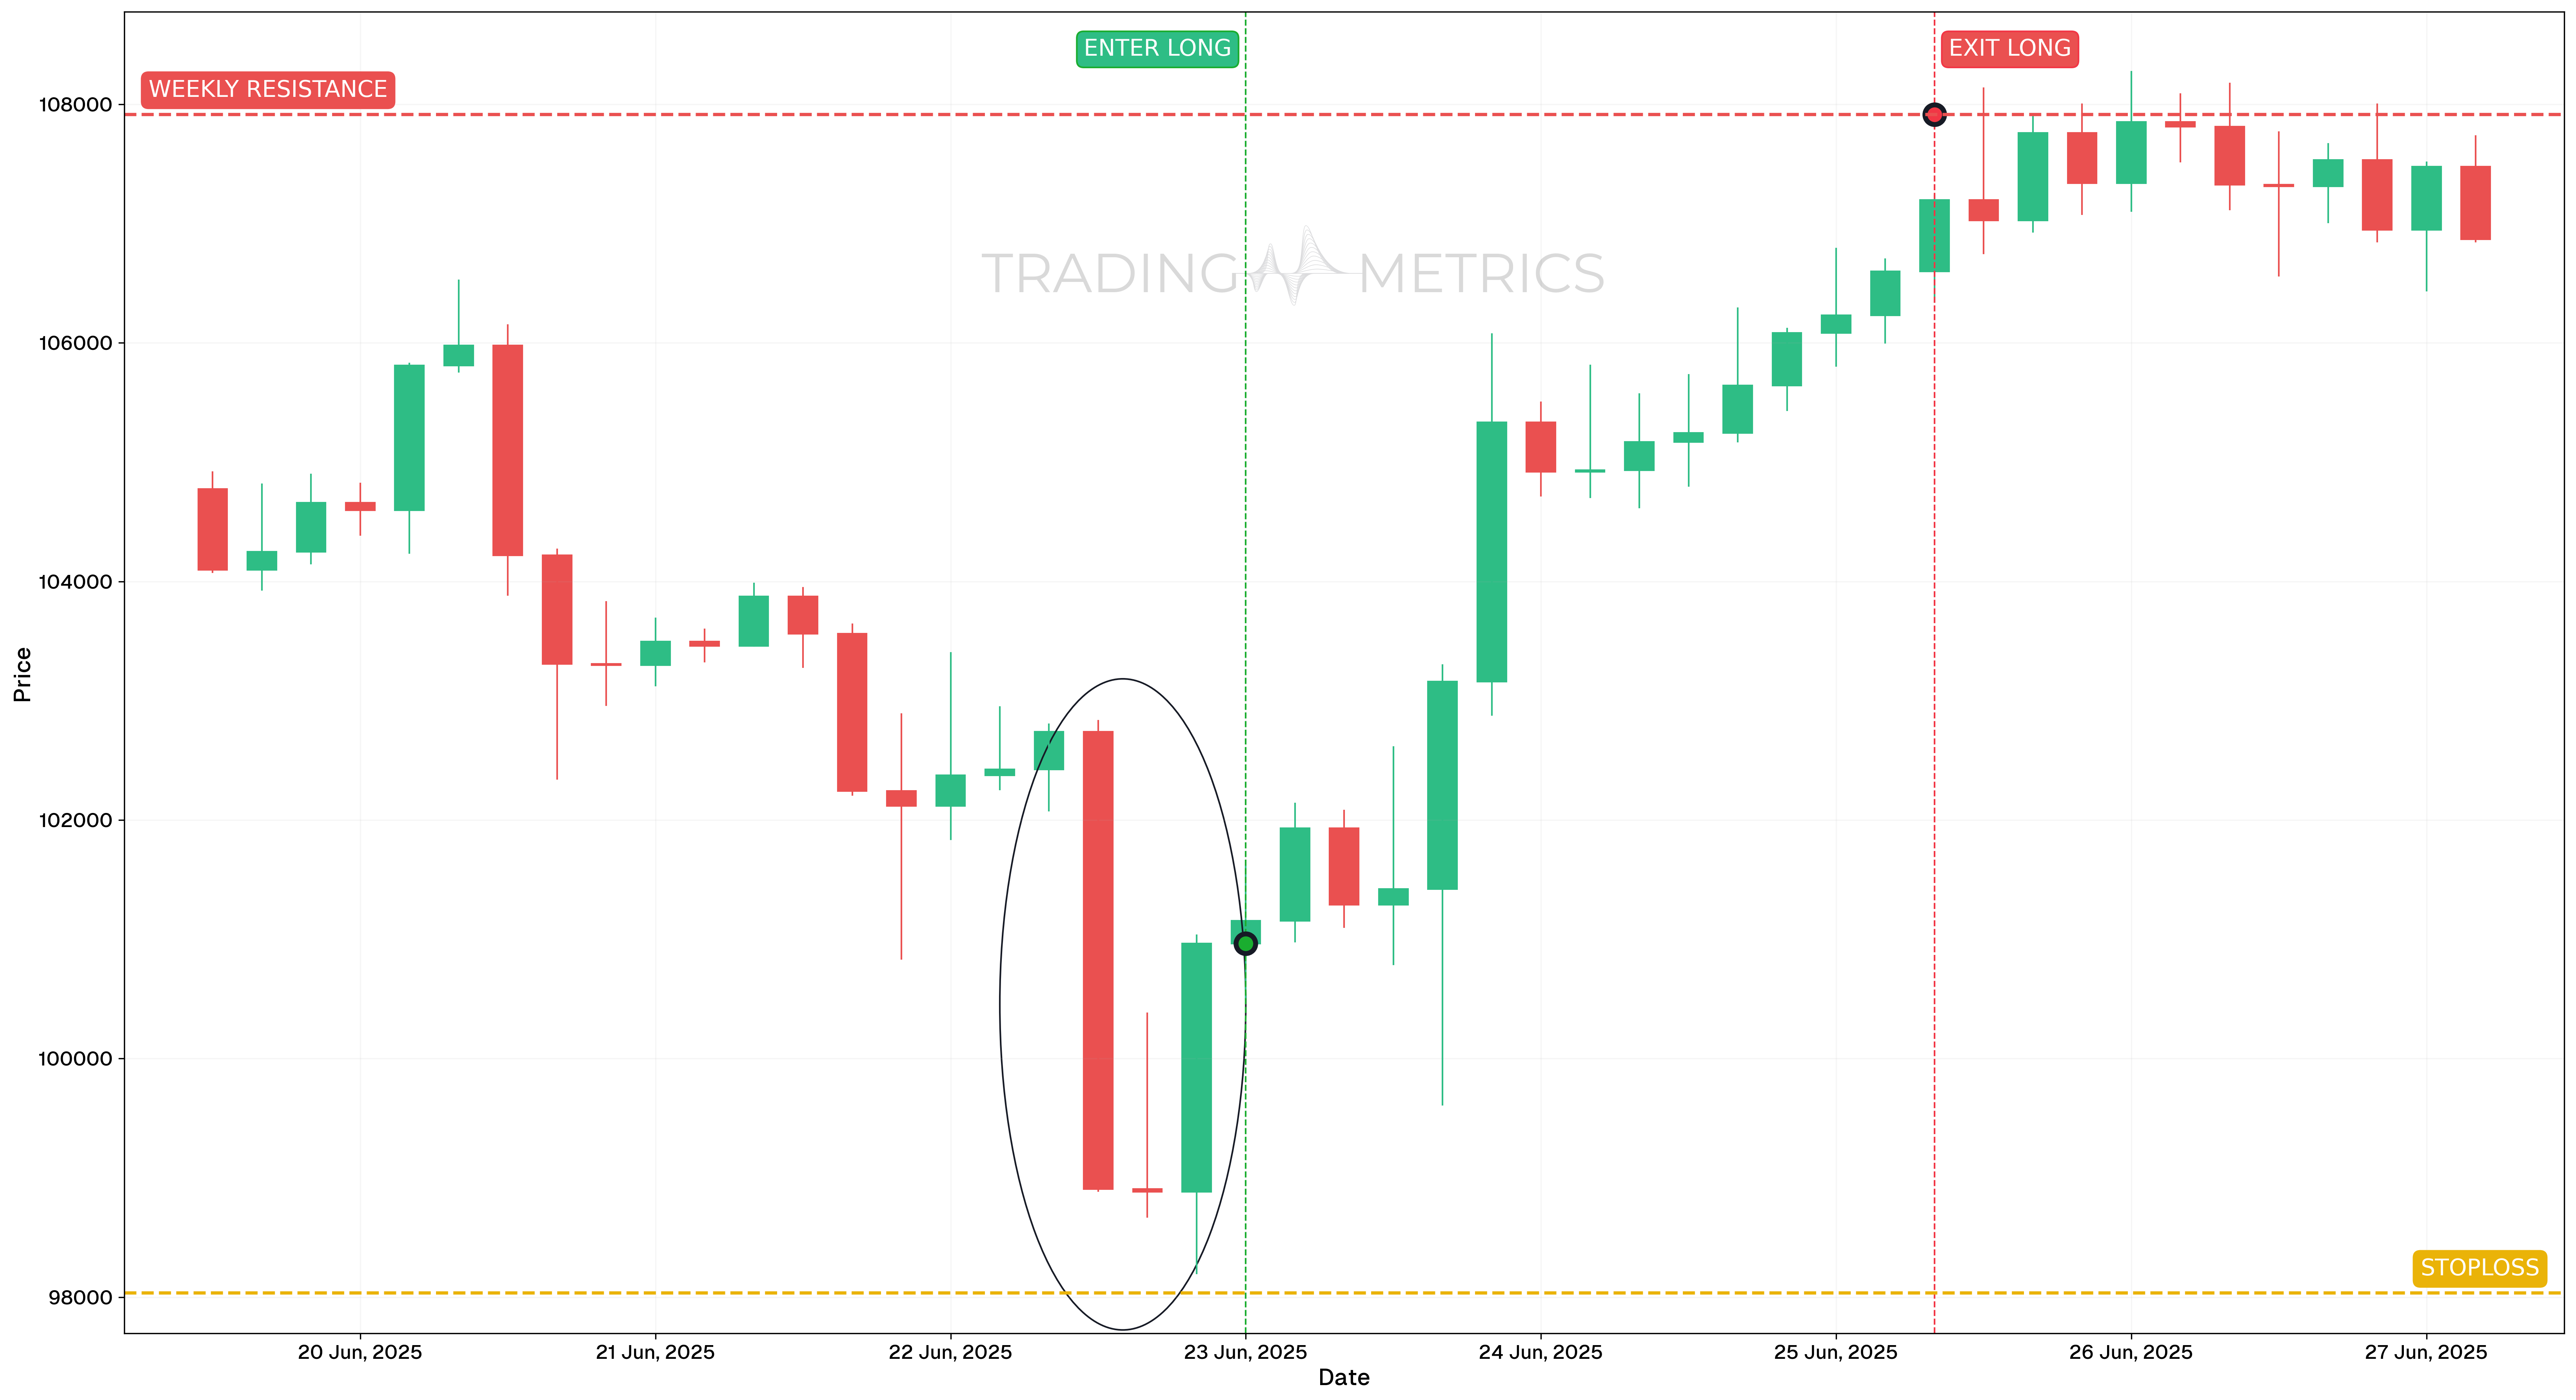
This example demonstrates how the Morning Star pattern can be used for a bullish reversal entry. We’ll use the BTCUSDT pair on the 4-hour chart, where a textbook setup appeared after a pullback during a broader uptrend.
Analysis
From June 19 to June 27, 2025, BTCUSDT experienced a corrective move before forming a Morning Star between June 22 and June 23, signaling a potential bottom. This formation included a large bearish candle, followed by a small-bodied candle, and then a strong bullish confirmation candle.
This occurred near key weekly support, with bullish momentum indicators signaling a shift in direction.
Trade Setup
-
Entry: The position was entered on June 22, 2025, at 20:00, at $101,015.89, immediately after the formation of the Morning Star pattern. Entry was supported by:
-
Exit: The trade was exited on June 25, 2025, at $107,914.90, near a major weekly resistance level.
-
Outcome: The Morning Star pattern produced a clean reversal and efficient long setup. The trade captured a substantial portion of the recovery leg following the bullish candle confirmation.
Risk Management
- Stop-Loss placement: The stop-loss was placed at $98,033.97, just below the low of the pattern.
- Position sizing: A 2% capital risk model was used, with size calculated based on the entry to stop-loss range.
- Volatility Consideration: The trade benefited from decreasing Volatility into the pattern base and expansion on breakout.
- Risk-Reward Ratio: 1:3.48 is strong asymmetric setup with technical confluence and favorable exit conditions.
Volume Dawn: A volume spike on the third candle lifts the pattern into a bullish surge, confirming the reversal’s strength.
Pre-Trade Checklist
Brighten the Proof: Pair the pattern with volume surges and indicators like RSI to dodge fakes and boost your odds.
Key Points
- Star Clarity: A long first candle, small second, and strong third boost reliability - shallow moves dilute it.
- Time Frame: Shines brightest on daily or weekly charts after downtrends.
- Combine with Indicators: Use moving averages or RSI to confirm the reversal.
- Breakout Confirmation: A close above the first candle’s midpoint sets the rise - third candle strength is key.
- Price Target: Measure the first candle’s body or use resistance levels for a target above the close.
- Risk Management: Set a stop-loss below the second candle’s low to limit losses if it fails.
Wait for the Dawn: Acting before the third candle confirms risks a star trap - let the reversal shine through.
Conclusion
The Morning Star pattern is a trader’s radiant tool for catching bullish reversals. Its dawn trio, paired with volume, RSI, and moving averages, can glow into big gains. Whether in crypto, stocks, or forex, this pattern sharpens your edge. Stay patient, manage your risk, and let the Morning Star rise - that glowing dawn could soar into a winning trade.
Frequently Asked Questions
Quick answers based on this page's topic.
The Morning Star is a three-candle sequence: a strong bearish move, a small-bodied 'star' of indecision, and a large bullish candle. This transition from fear to stalemate to confidence provides a complete story of a downtrend reaching exhaustion and a new uptrend being born.
For the pattern to be technically valid, the third (bullish) candle must close at least 50% into the body of the first (bearish) candle. This deep penetration proves that buyers have successfully reclaimed the majority of the losses from the initial sell-off, validating the reversal.
They are mirror opposites. A Morning Star marks a trend bottom and signals a reversal upward (bullish). An Evening Star marks a trend top and signals a reversal downward (bearish). Both rely on the middle 'star' candle to represent the turning point of the trend.
No. The star candle represents indecision, so its color is irrelevant. What matters is its small body size relative to the surrounding candles. A doji star, which has virtually no body at all, is considered an even stronger signal because it shows complete equilibrium between buyers and sellers.
Morning Stars on daily and weekly charts are significantly more reliable than those on intraday charts because they capture broader market sentiment shifts. On 5-minute or 15-minute charts, the pattern can still work for scalping but requires additional confirmation from volume or a higher-timeframe trend filter.