Descending Broadening Wedge: Trading Market Instability
The Descending Broadening Wedge pattern is a fascinating bullish reversal signal in technical analysis, often appearing after a downtrend. Picture it as a widening funnel - price swinging between diverging trendlines - before breaking upward. When this pattern unfolds, it’s a clever hint that bearish momentum is overstretching and fading, offering traders a chance to buy or go long as an uptrend emerges.
How to Identify the Descending Broadening Wedge Pattern in Trading
The Descending Broadening Wedge is a bullish reversal formation. It develops when price moves lower inside a widening channel, with lower highs and lower lows diverging. The setup confirms when price breaks above resistance. Here’s how to spot it:
Start with the Big Picture
This pattern forms after a downtrend. Sellers push price lower, but the expanding swings show instability and rising volatility. The broadening structure signals that control may shift to buyers.
Trace the Diverging Trendlines
The wedge is defined by two spreading boundaries. Recognizing the divergence is key to validating the setup.
- Upper Trendline: Price makes lower highs, sloping downward.
- Lower Trendline: Price makes lower lows, but each drop extends further, diverging from the upper line.
- Wedge Formation: The channel widens as the two lines spread apart, showing instability and rising volatility.
Zero in on the Resistance Line
The resistance line is the upper boundary of the wedge. It’s the level where sellers have repeatedly capped rallies. Once this line is challenged, the pattern nears completion.
Watch the Breakout
The bullish trigger comes when price closes above resistance.
- A decisive break over the upper trendline or
- A strong bullish candle
Both confirm the wedge has resolved upward and trigger the entry.
Check Volume for Additional Confirmation
Volume behavior helps confirm the reversal.
- High during the widening swings as volatility expands.
- Drops as the downtrend fades.
- Spikes on the breakout, verifying buyer strength.
When that surge appears, the wedge’s bullish reversal is validated.
Climb High: Measure the height of the wedge at its widest point and project it upward from the break for a solid price target.
How to Trade the Descending Broadening Wedge Pattern (Trading Example)
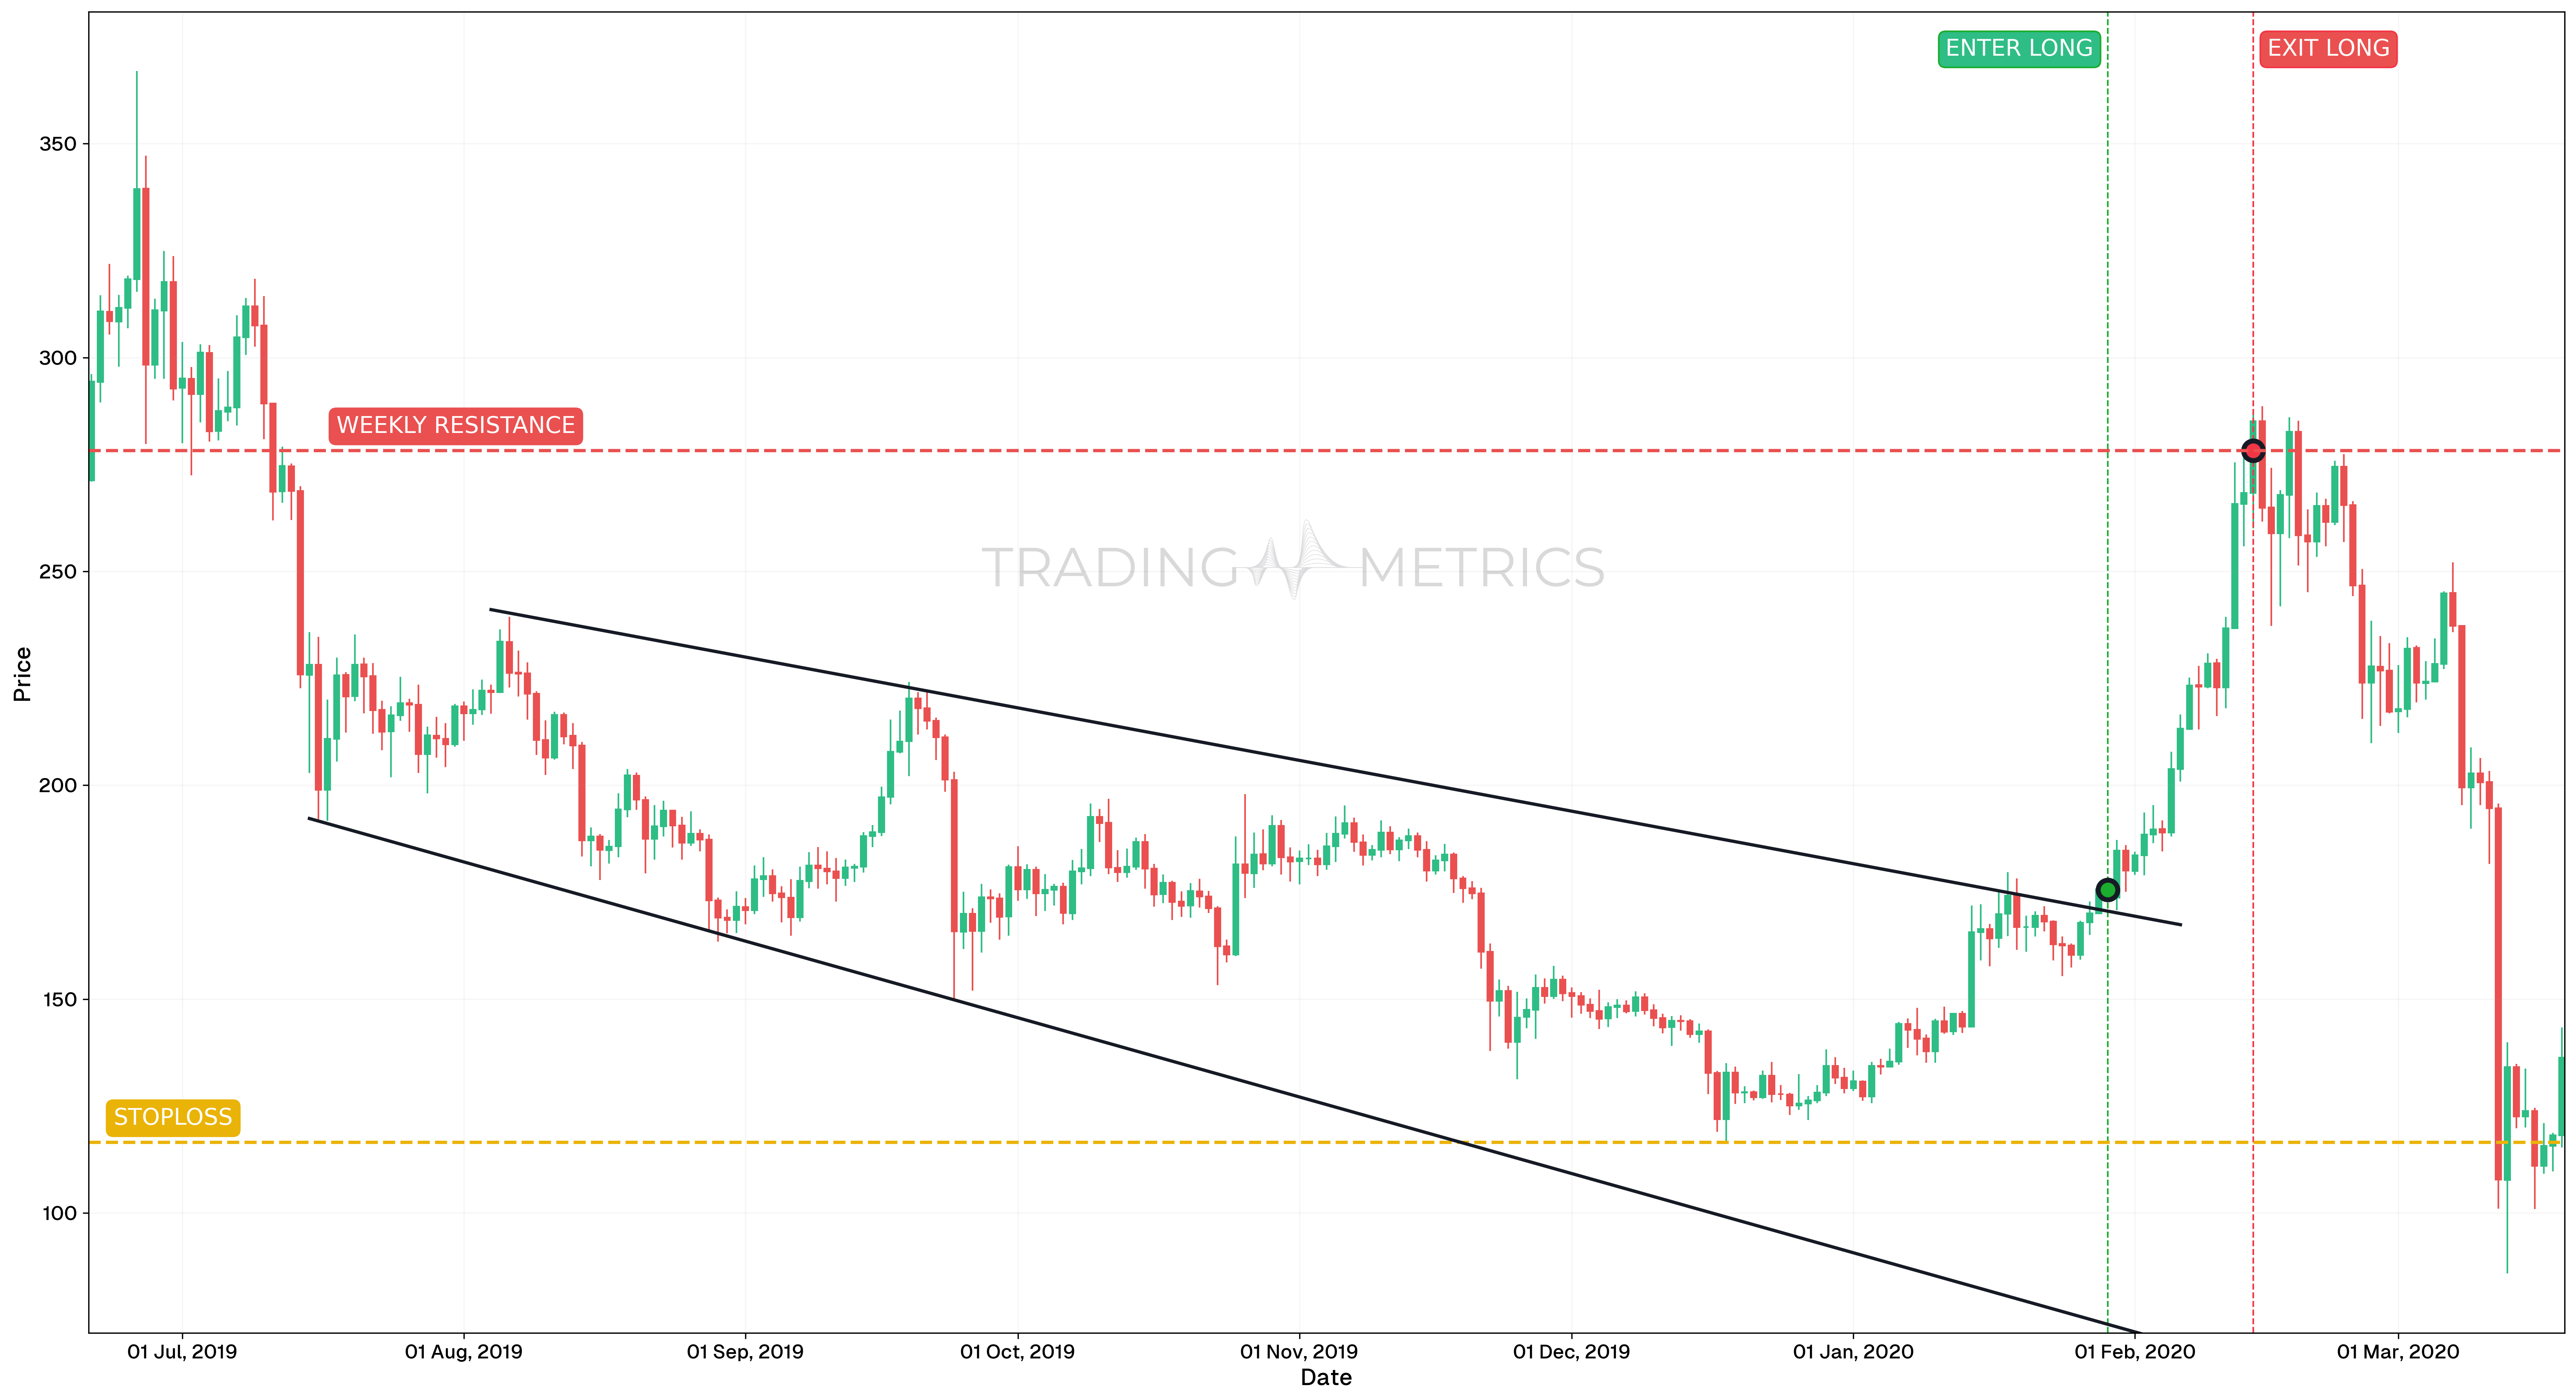
To illustrate how the Descending Broadening Wedge pattern can be used to enter a trade, we will choose the ETHUSDT pair. This large-cap altcoin formed a broad and expanding reversal structure on the daily chart, setting up a medium-term long opportunity.
Analysis
Between June 2019 and January 2020, ETHUSDT developed a wide Descending Broadening Wedge. The price made successively lower highs and lower lows, but the range expanded over time, reflecting rising instability and setting the stage for a reversal. The breakout in late January 2020 confirmed bullish momentum.
Trade Setup
- Entry: The long trade was initiated on January 29, 2020, at $175.58, shortly after price broke above the upper boundary of the Descending Broadening Wedge. Several momentum signals supported the entry:
- Exit: The position was closed on February 14, 2020, at $278.22, at a key support-turned-resistance level. This conservative exit respected market structure and secured profits into strength.
- Outcome: The Descending Broadening Wedge yielded a 58.4% gain from entry to exit. The pattern’s breakout played out cleanly with strong momentum follow-through.
Risk Management
- Stop-Loss placement: The stop-loss was placed at $116.46, just beneath the broadening formation’s lowest swing. This safeguarded the trade against a false breakout while allowing enough room for volatility.
- Position sizing: The position was sized according to a 2% capital risk model, using the entry-to-stop distance to maintain proper risk management.
- Risk-Reward Ratio: This setup provided a Risk-Reward Ratio of 1:1.74, offering a balanced reward relative to the structural risk taken.
- Volatility Consideration: The pattern featured increasing Volatility during its formation, which reversed into directional momentum after breakout. Entry was only taken after confirmation to minimize exposure to noise within the wedge.
- Adaptive Exit Strategy: While the trade was exited conservatively at resistance, more aggressive targets could have aimed toward the $300 level, depending on trend continuation preferences.
Volume Flare: A volume spike on the resistance break fans the pattern into a bullish blaze.
Pre-Trade Checklist
Fan the Proof: Pair the pattern with volume flares and indicators like RSI to dodge traps and sharpen your aim.
Key Points
- Line Divergence: The wider the fan, the stronger the signal - messy lines muddy it.
- Time Frame: Strikes best on daily or weekly charts.
- Combine with Indicators: Lean on moving averages or RSI for precision.
- Breakout Confirmation: The resistance break turns the tide - don’t rush it.
- Price Target: Measure the wedge’s widest height, project up from the break for your goal.
- Risk Management: Set a stop-loss below the lowest low to limit damage if it fails.
Wait for the Crack: Jumping before the resistance break risks a fan-flapping fakeout - hold steady.
Conclusion
The Descending Broadening Wedge pattern is a slick pick for nabbing bullish reversals. Its widening sprawl, teamed with volume, RSI, and moving averages, can spotlight big shifts. Whether in crypto, stocks, or forex, this pattern hones your edge. Stay cool, manage your risk, and let the fan spread - that widening wedge could snap into a winning rise.
Frequently Asked Questions
Quick answers based on this page's topic.
The Descending Broadening Wedge signals that while sellers are still pushing for lower lows, the volatility and emotional range are expanding. This indicates a 'market in chaos' where the sellers are losing their disciplined control, often leading to a sharp and sudden bullish breakout once resistance is broken.
Confirmation is triggered when the price closes decisively above the upper descending trendline. A high-probability long entry is typically supported by a surge in buying volume, proving that the period of indecision has resolved in favor of the bulls.
Traders usually measure the vertical distance between the highest peak and the lowest trough within the wedge structure. Projecting this same distance upward from the breakout point on the upper trendline provides a clear, mathematical take-profit goal.