Bearish Reversal Patterns: Reading Distribution at the Top
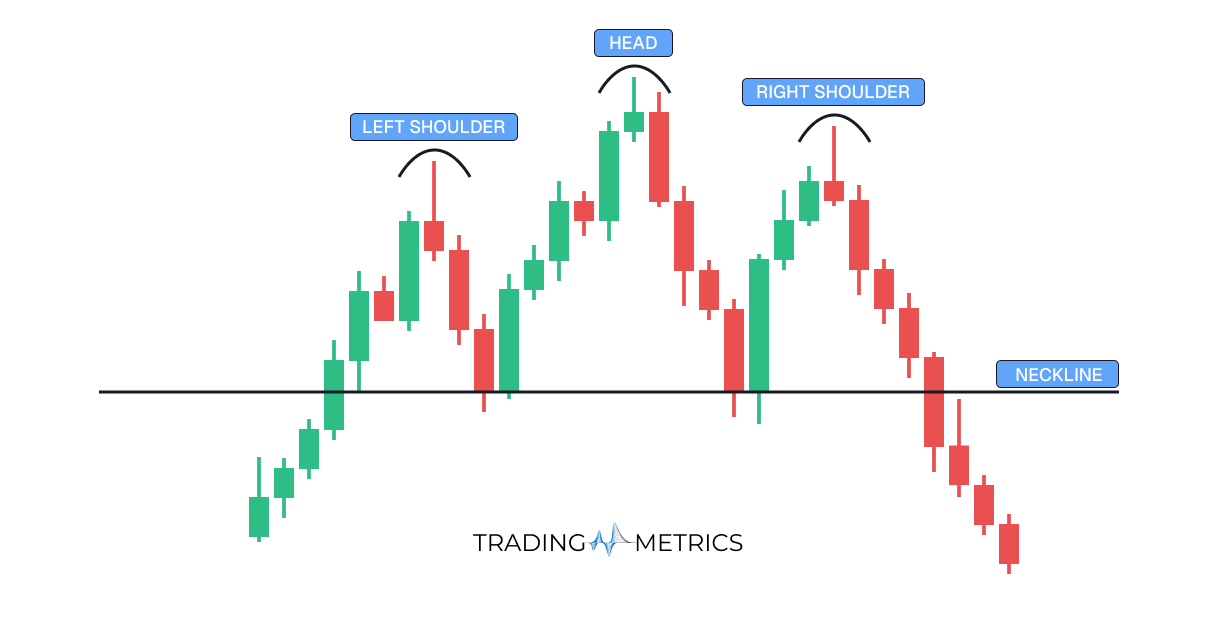
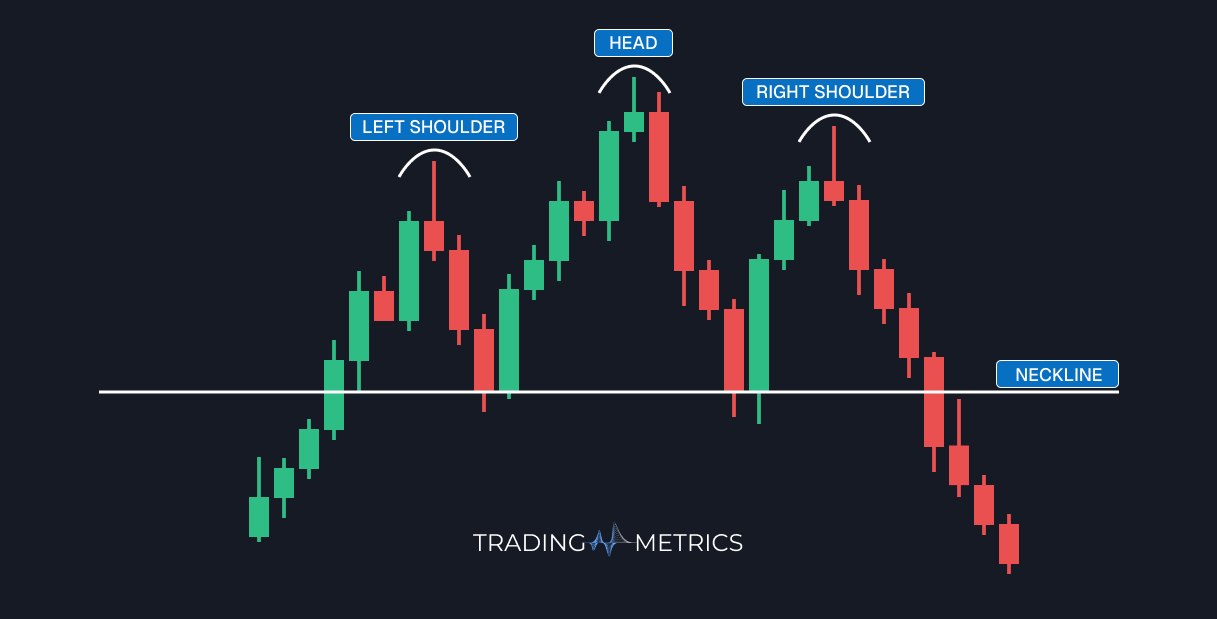
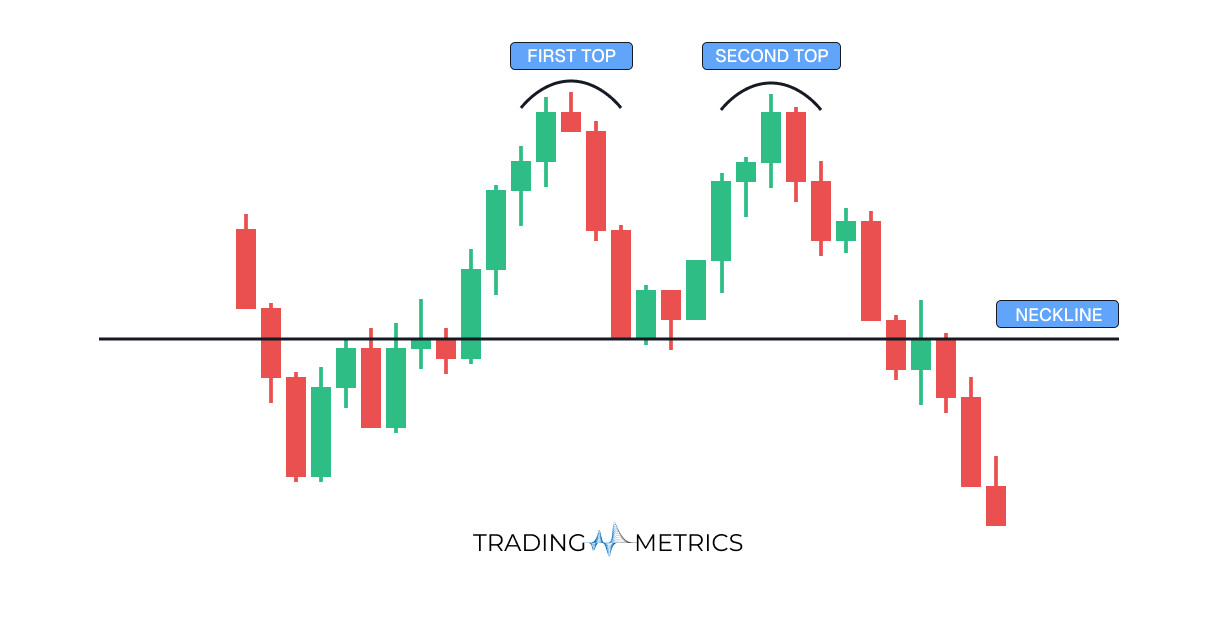
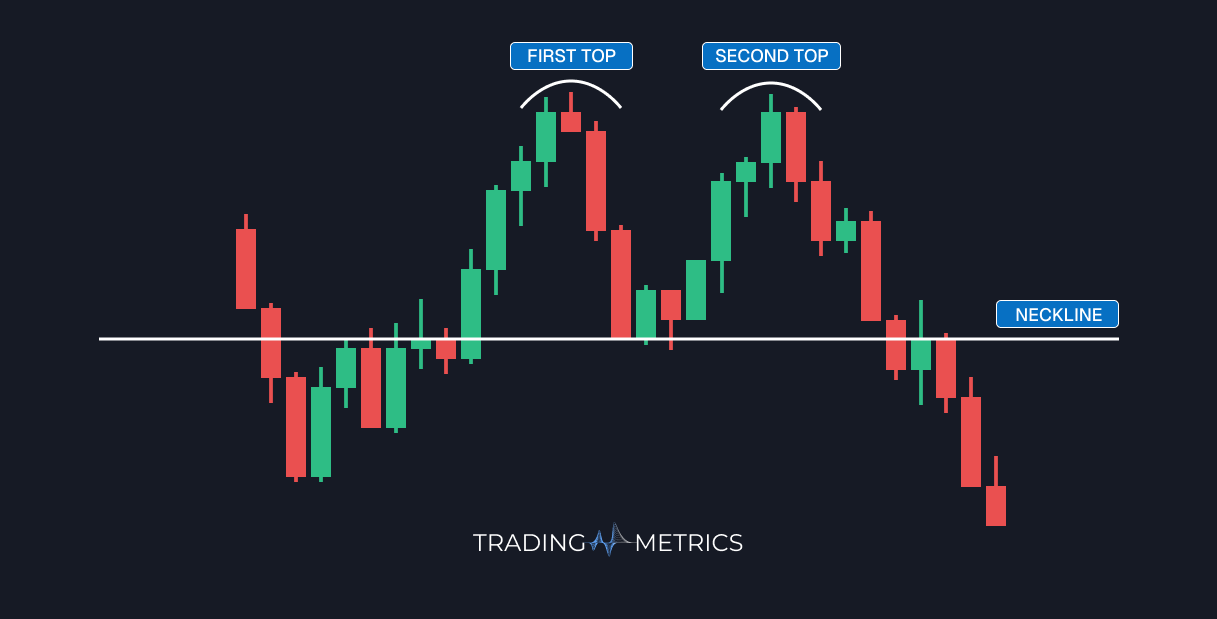
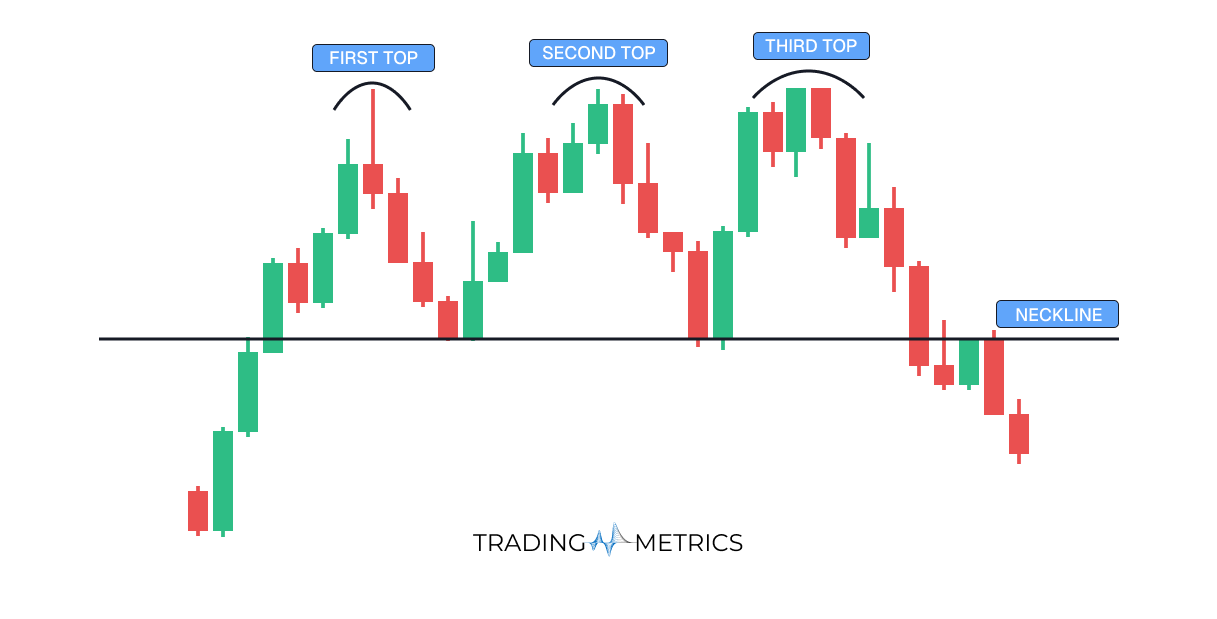
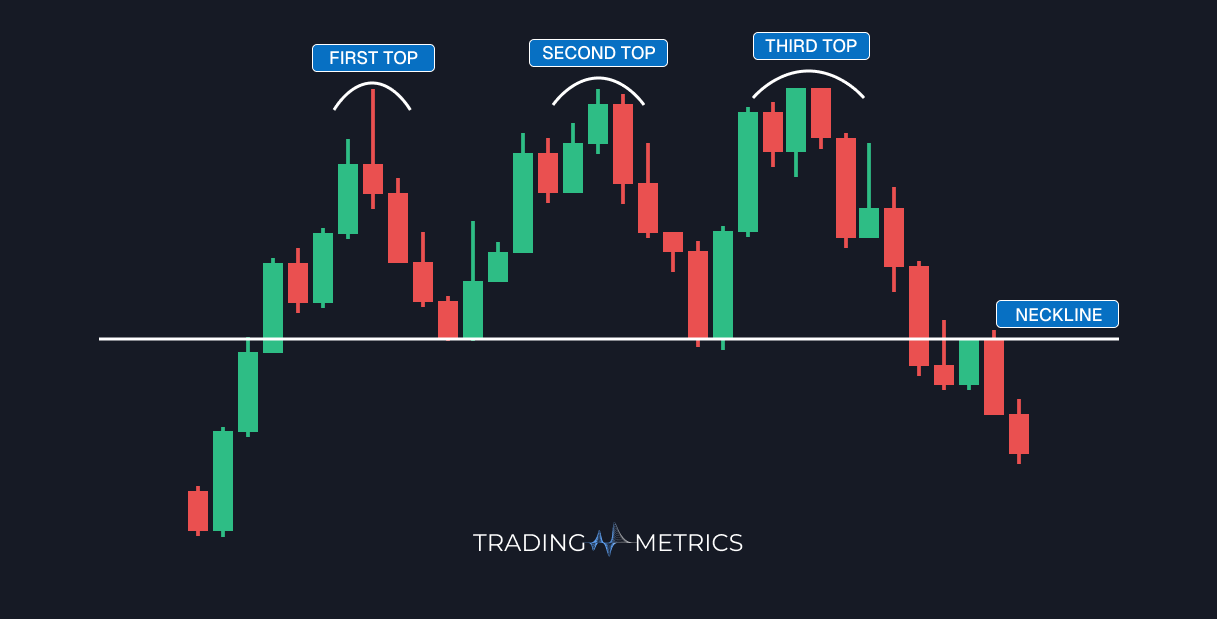
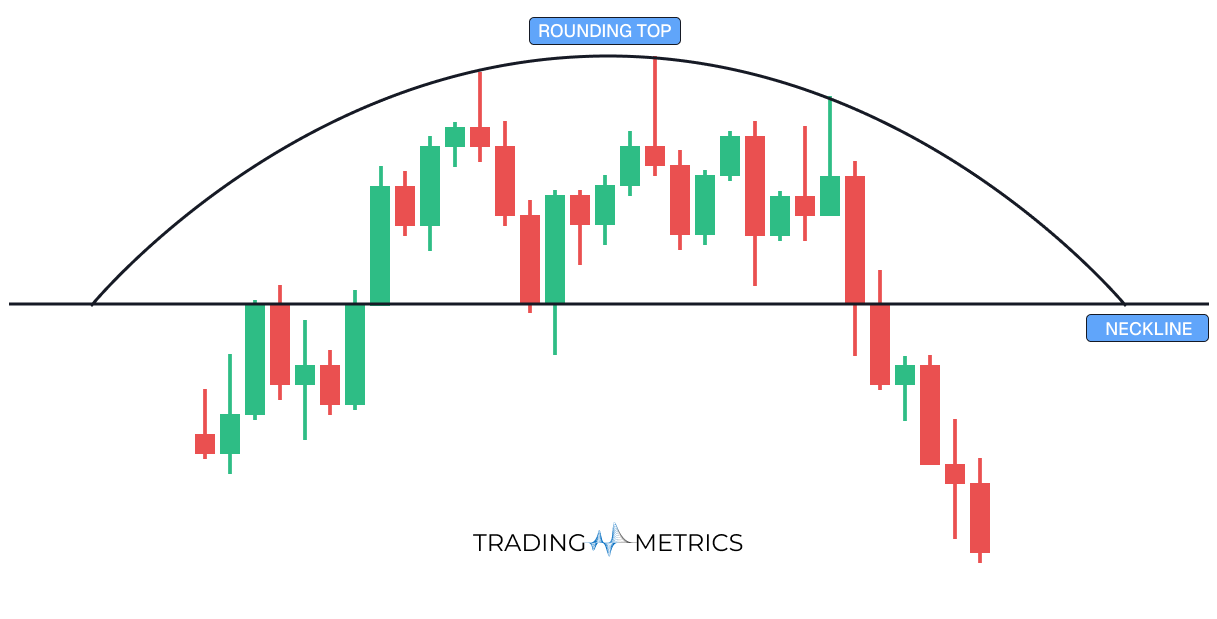
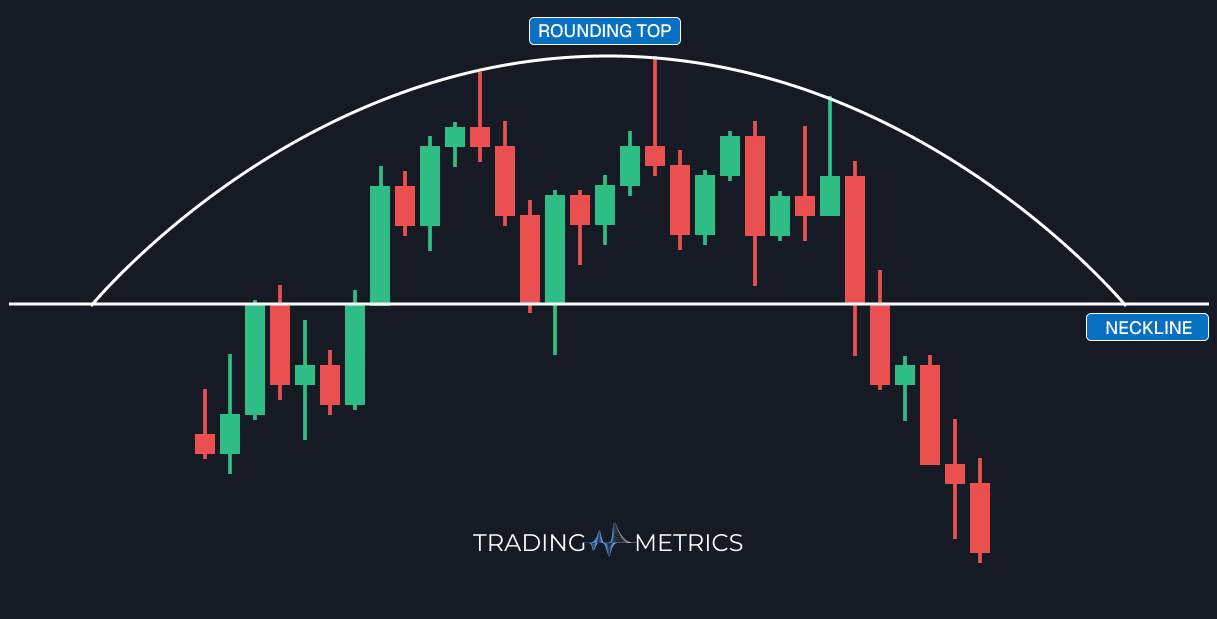
Bearish reversal patterns in technical analysis signal the potential end of an upward trend and the beginning of a downward trend in a financial market. These patterns often form in candlestick charts and are used by traders to identify selling opportunities. Here’s an overview of common bearish reversal patterns:
Frequently Asked Questions
Quick answers based on this page's topic.
Bearish reversal patterns signal a fundamental shift from buyer dominance to seller control. They often appear at the end of an uptrend, showing that despite reaching new highs, the market lacks the conviction to stay there, alerting traders to potential distribution or the start of a downtrend.
Higher timeframes, like the daily or weekly, filter out market noise and minor news events. A reversal pattern on these charts represents a significant shift in institutional sentiment, making the resulting downward move more sustainable and predictable for long-term traders.
No. Most bearish reversal patterns require a 'trigger'—typically a decisive close below a support level or neckline. Selling prematurely increases the risk of being caught in a 'bull trap' or a continuation move where the trend resumes after a brief pause.