Trading the Bullish Butterfly Pattern: Reversal Entry Optimization
The Bullish Butterfly Pattern is a bullish reversal formation that appears at the end of a downtrend. Built on the XABCD structure, it features a 78.6% XA retracement at B, a C leg between 38.2% and 88.6% of AB, and a final D point extending to 127% of XA with a 161.8%–224% BC projection. At D, bearish momentum fades and buyers step in, often triggering the start of a new uptrend.
How to Identify the Bullish Butterfly Pattern in Trading
The Bullish Butterfly Pattern is a precise harmonic setup that signals a potential reversal after an extended decline. It shows sellers losing strength at deep Fibonacci levels, where buyers prepare to take control. Here’s how to recognize it:
Start with the Big Picture
This pattern develops after a prolonged downtrend. Sellers are in control, but the harmonic ratios reveal when the decline has gone too far. The Bullish Butterfly provides the roadmap for spotting the bottom before the reversal begins.
Trace the XABCD Legs
The structure is made of five swings, each defined by precise Fibonacci measurements. Recognizing these is what confirms the pattern.
- XA: The initial strong decline that starts the structure.
- AB: A rebound upward into 78.6% of XA.
- BC: Another move down, retracing 38.2%–88.6% of AB but never breaking beneath X.
- CD: A deep extension downward, reaching the 127% of XA, and often stretching toward the 161.8% extension of XA, supported by the 161.8%–224% projection of BC.
- D Point: The completion zone of the Bullish Butterfly and the area where buyers step in.
Zero in on D (the Reversal Zone)
D is the key. It sits in the 127%–161.8% extension of XA and overlaps with the BC projection zone, creating strong Fibonacci confluence. If price stabilizes here, the odds of a bullish reversal climb sharply.
Watch the Breakout
Confirmation comes when price rebounds at D and pushes higher.
- A strong bullish candle or
- A close above B
Both confirm that sellers have lost control and buyers are taking over. That’s your entry trigger.
Check Volume for Additional Confirmation
Volume adds the final layer of confidence.
- Heavy volume on XA (sellers in control).
- Lighter on AB and BC (momentum fading).
- Then a spike at D as buyers rush in.
When that surge appears, the Bullish Butterfly’s bullish reversal is real.
Rise Flutter: Measure the XA leg height and project it upward from D, or target the 38.2% or 61.8% retracement of XD for a realistic price target.
How to Trade the Bullish Butterfly Pattern (Trading Example)
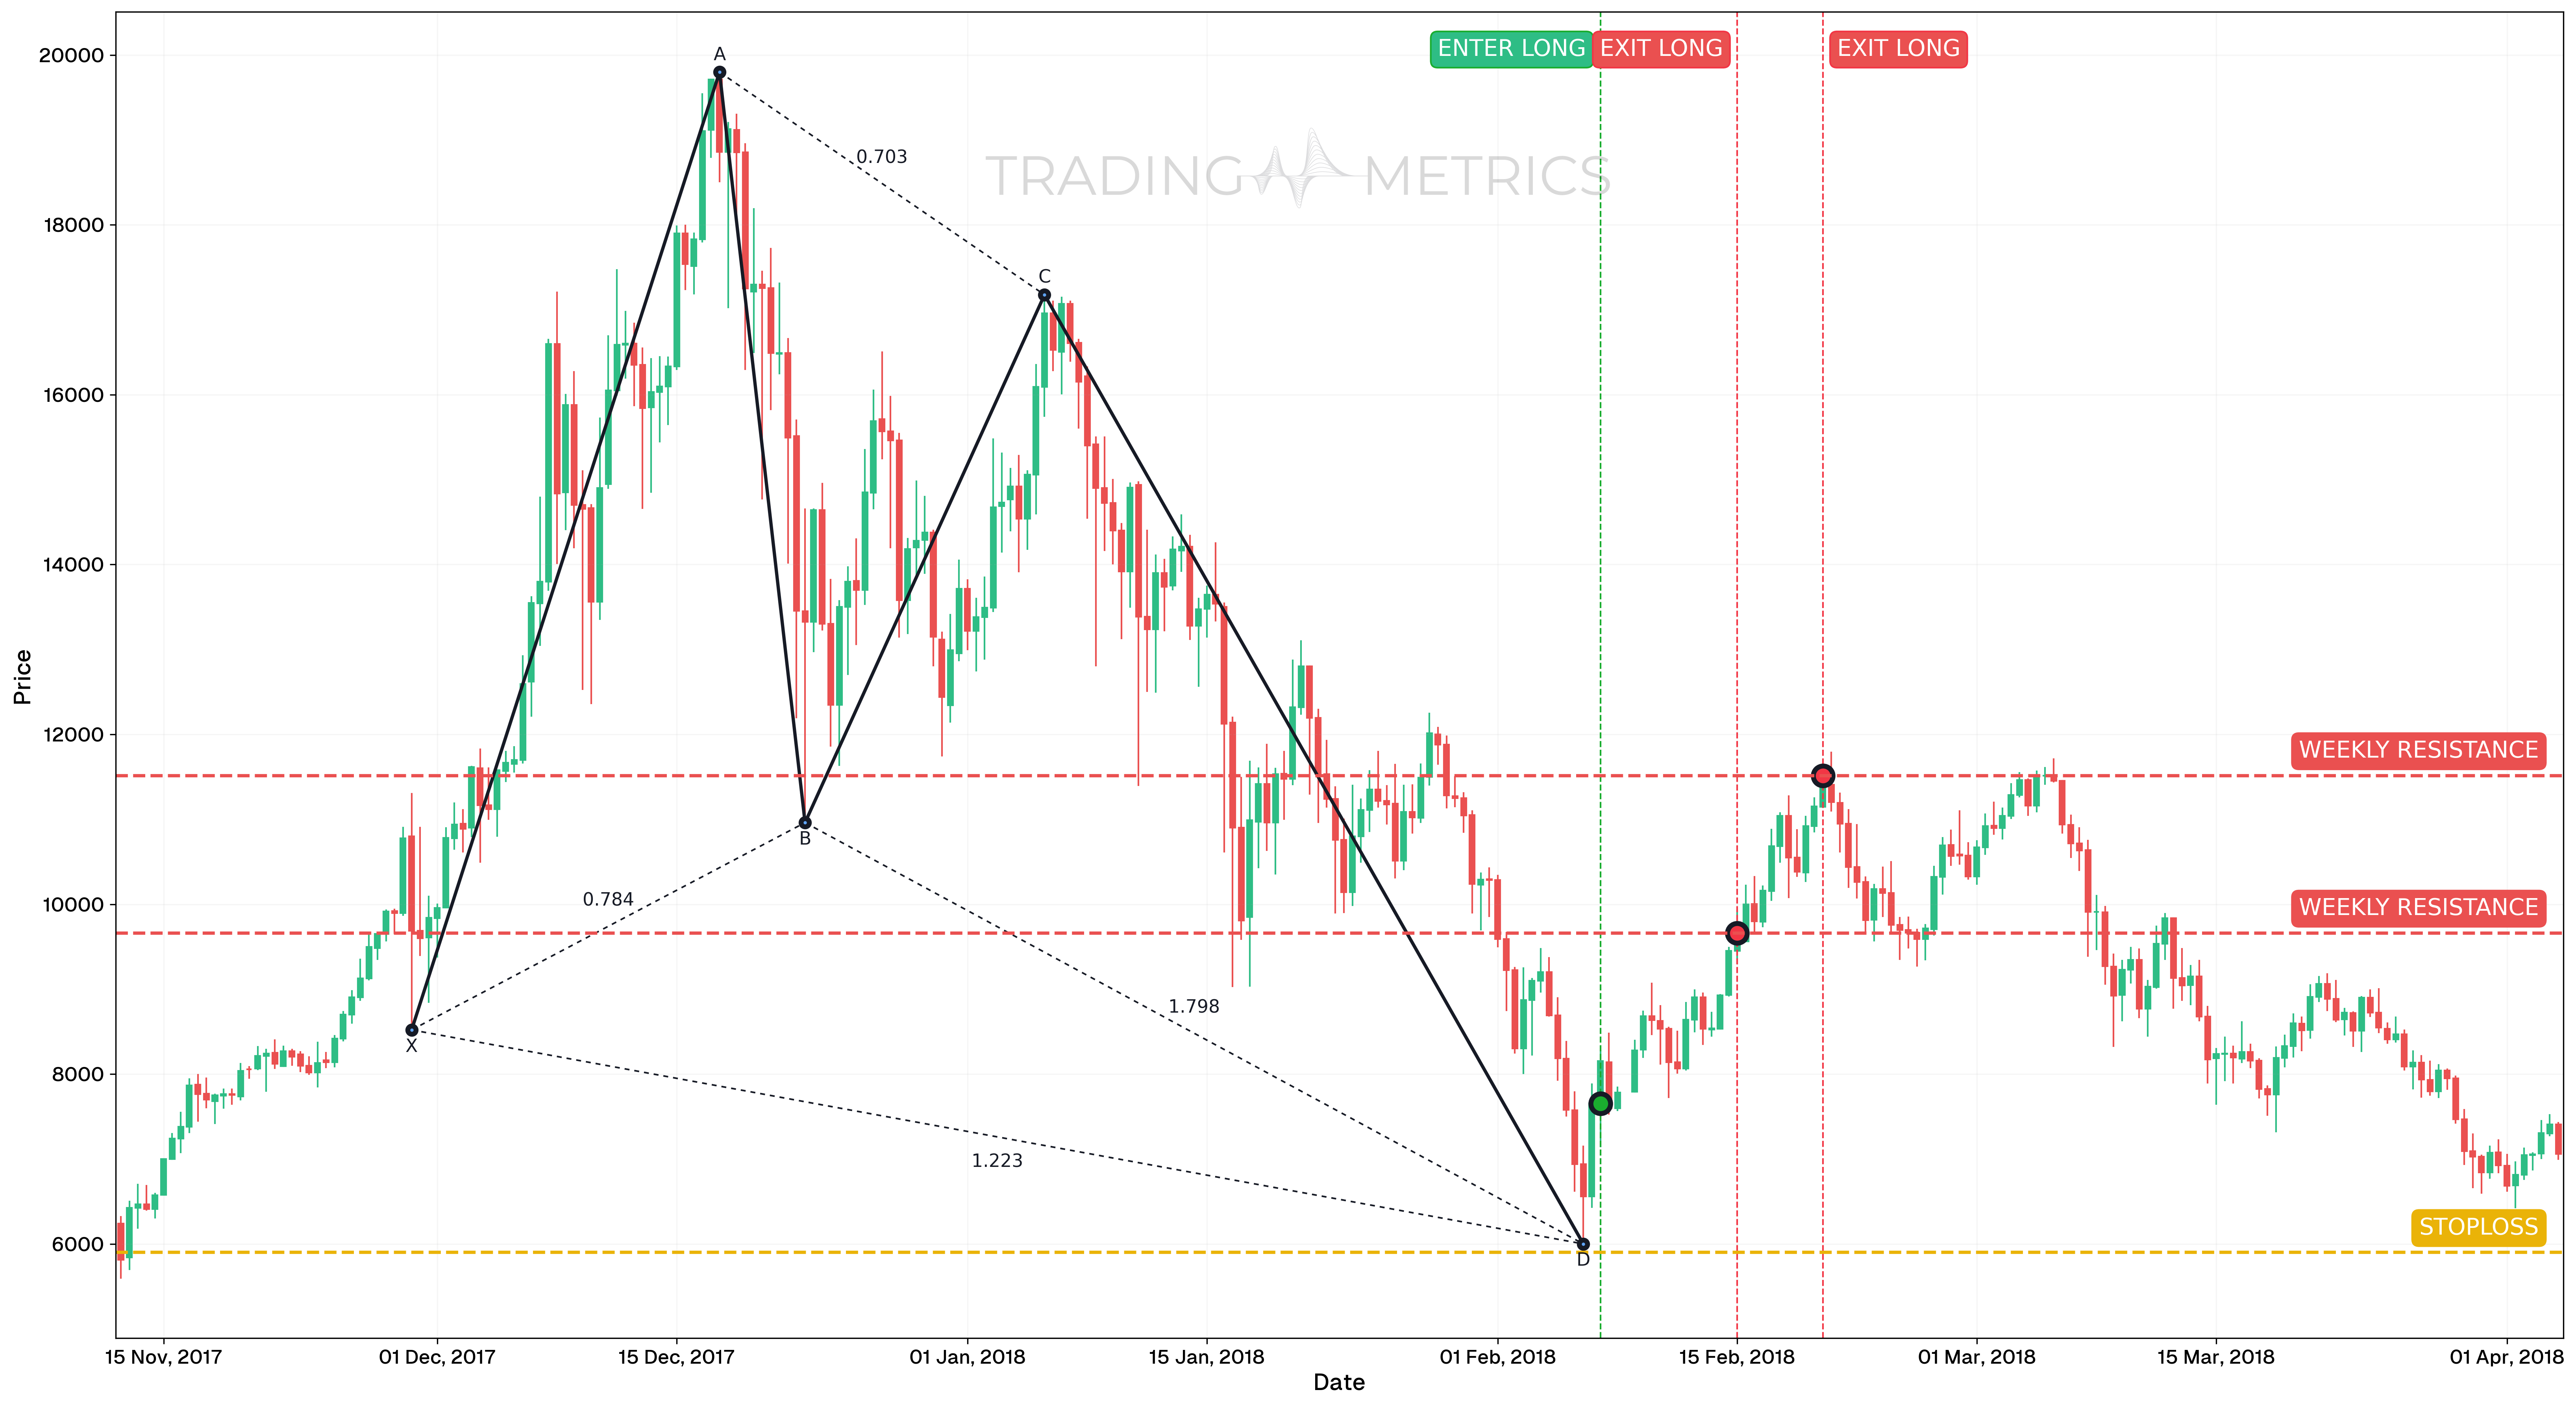
To demonstrate how the Bullish Butterfly harmonic pattern can be traded, we’ll analyze the BTCUSDT pair on the 12-hour chart. This classic harmonic setup occurred during a mid-cycle correction in early 2018 and led to a strong counter-trend rally.
Analysis
Between November 12, 2017 and April 4, 2018, BTCUSDT formed a well-proportioned Bullish Butterfly pattern. After several weeks of corrective structure, the pattern completed its final CD leg near the PRZ (Potential Reversal Zone) at $7,655.02.
The bullish setup was further confirmed by a Bullish Engulfing candle near the completion zone, accompanied by RSI and StochRSI both turning upward, signaling growing bullish momentum.
Trade Setup
-
Entry: The position was entered at $7,655.02 on February 7, 2018, following:
- Full Bullish Butterfly harmonic structure completion
- Formation of a Bullish Engulfing candle confirming reversal intent
- RSI and StochRSI both rising from oversold conditions
-
Exit: The trade was exited in multiple stages at logical resistance levels:
- February 15, 2018 (TP1): Exit at $9,661.02
- February 20, 2018 (TP2): Exit at $11,515.00
-
Outcome: The trade captured a strong bullish bounce following harmonic completion. Multiple exits secured gains across retracement legs as BTCUSDT retraced sharply higher from oversold levels.
Risk Management
- Stop-Loss placement: The stop-loss was placed just below the D-point structure at $5,900, accounting for potential overshoot while respecting harmonic invalidation.
- Position sizing: The position was sized using a 2% capital risk model, based on the distance from entry to stop-loss.
- Volatility Consideration: The reversal occurred after a sharp high-volatility Drawdown. Compression and a signal candle near the PRZ (Potential Reversal Zone) helped filter for a low-risk long opportunity.
- Adaptive Exit Strategy: Exits aligned with weekly resistance levels and retracement targets, allowing for both technical discipline and adaptive management as price climbed.
Volume Flutter: A volume spike at D with confirmation lifts the pattern into a bullish surge.
Pre-Trade Checklist
Flutter the Proof: Pair the pattern with volume spikes and indicators like RSI to dodge fakes and boost your odds.
Key Points
- Fibonacci Precision: Exact ratios (78.6% XA, 38.2%-88.6% AB, 127%-161.8% XA) boost reliability - loose fits weaken the setup.
- Time Frame: Flutters strongest on daily or weekly charts after downtrends.
- Combine with Indicators: Use moving averages or RSI to confirm the reversal.
- Breakout Confirmation: A close above B sets the turn - don’t jump at D alone.
- Price Target: Measure the XA leg or use Fibonacci Retracements of XD for targets above the close.
- Risk Management: Set a stop-loss below D to limit losses if it fails.
Wait for the Flutter: Acting before confirmation risks a Bullish Butterfly trap - let the reversal take flight.
Conclusion
The Bullish Butterfly Pattern is a trader’s intricate tool for catching bullish reversals. Its XABCD wings, paired with volume, RSI, and moving averages, can flutter into big gains. Whether in crypto, stocks, or forex, this pattern sharpens your edge. Stay precise, manage your risk, and let the Bullish Butterfly align - that deep harmonic lift could soar into a winning trade.
Frequently Asked Questions
Quick answers based on this page's topic.
The Butterfly is an 'external' harmonic pattern. Point D completes at a 127.2% to 161.8% extension of the XA leg, meaning the market must set a new lower low before reversing. This identifies a state of extreme overextension where the final sellers are 'exhausted' beyond traditional support.
A valid Bullish Butterfly requires a precise 78.6% retracement of the XA leg at point B. This specific ratio is the 'harmonic DNA' of the pattern; if the retracement is shallower, the move is more likely to evolve into a Bullish Crab rather than a Butterfly reversal.
Stops are typically placed just below the 161.8% Fibonacci extension of the XA leg. If price continues to drop past this coordinate, the harmonic structure is invalidated, suggesting the asset is in a runaway downtrend rather than a mean-reversion cycle.