Parabolic SAR: Trailing Stops That Move With the Trend
Parabolic SAR (Stop and Reverse) is a technical analysis tool used by traders to determine the direction of an asset’s momentum and the potential points where this momentum might reverse. It was developed by J. Welles Wilder Jr. and is often visualized as a series of dots placed either above or below the price on a chart. When the dots are below the price, it indicates an uptrend, and when they are above the price, it indicates a downtrend.
The trend is your friend until it bends.
- Ed Seykota
How to Use Parabolic SAR?
Using the Parabolic SAR is relatively straightforward:
- Trend Identification: Check the position of the dots relative to the price. If the dots are below the price, the market is in an uptrend. Conversely, if the dots are above the price, the market is in a downtrend.
- Entry and Exit Points: The Parabolic SAR signals potential entry and exit points. For example, when the dots move from below to above the price, it might be a signal to sell or short. Conversely, when the dots move from above to below the price, it could be a signal to buy or cover a short.
- Stop-loss Placement: Traders often use the dots to set stop-loss orders to manage risk. As the dots move, the stop-loss level can be adjusted accordingly.
Tip: Use Parabolic SAR as a trail stop to lock in profits during strong trends - it adjusts dynamically with price movement.
How to Calculate Parabolic SAR?
The Parabolic SAR (Stop and Reverse) is a technical indicator used to determine the direction of an asset’s momentum and potential reversal points. It’s represented by a series of dots placed either above or below the price on a chart.
To calculate the Parabolic SAR, follow these steps:
Initial SAR Calculation
The initial SAR value is typically the prior period’s SAR value.
Extreme Point (EP)
The EP is the highest high or lowest low observed during the current trend. In an uptrend, the EP is the highest high, and in a downtrend, it’s the lowest low.
Acceleration Factor (AF)
The AF starts at 0.02 and increases by 0.02 every time a new EP is recorded. The AF can go up to a maximum of 0.20.
SAR Calculation
For an uptrend:
For a downtrend:
Reminder: The dots on the chart flip when the trend changes. This shift is a signal to reevaluate your position.
Importance of Parabolic SAR in Trading
The Parabolic SAR (Stop and Reverse) is a important tool in trading as it helps identify potential trend reversals and provides clear entry and exit points by plotting dots above or below price action. Its simplicity and visual nature make it effective for trend-following strategies, ensuring traders can manage trades with discipline by following predefined stop-loss levels. This indicator is especially useful in trending markets, helping traders stay aligned with the direction of momentum.
Spotting an Uptrend
Let’s look at a practical example of Bitcoin to see how the Parabolic SAR can help us identify an uptrend.
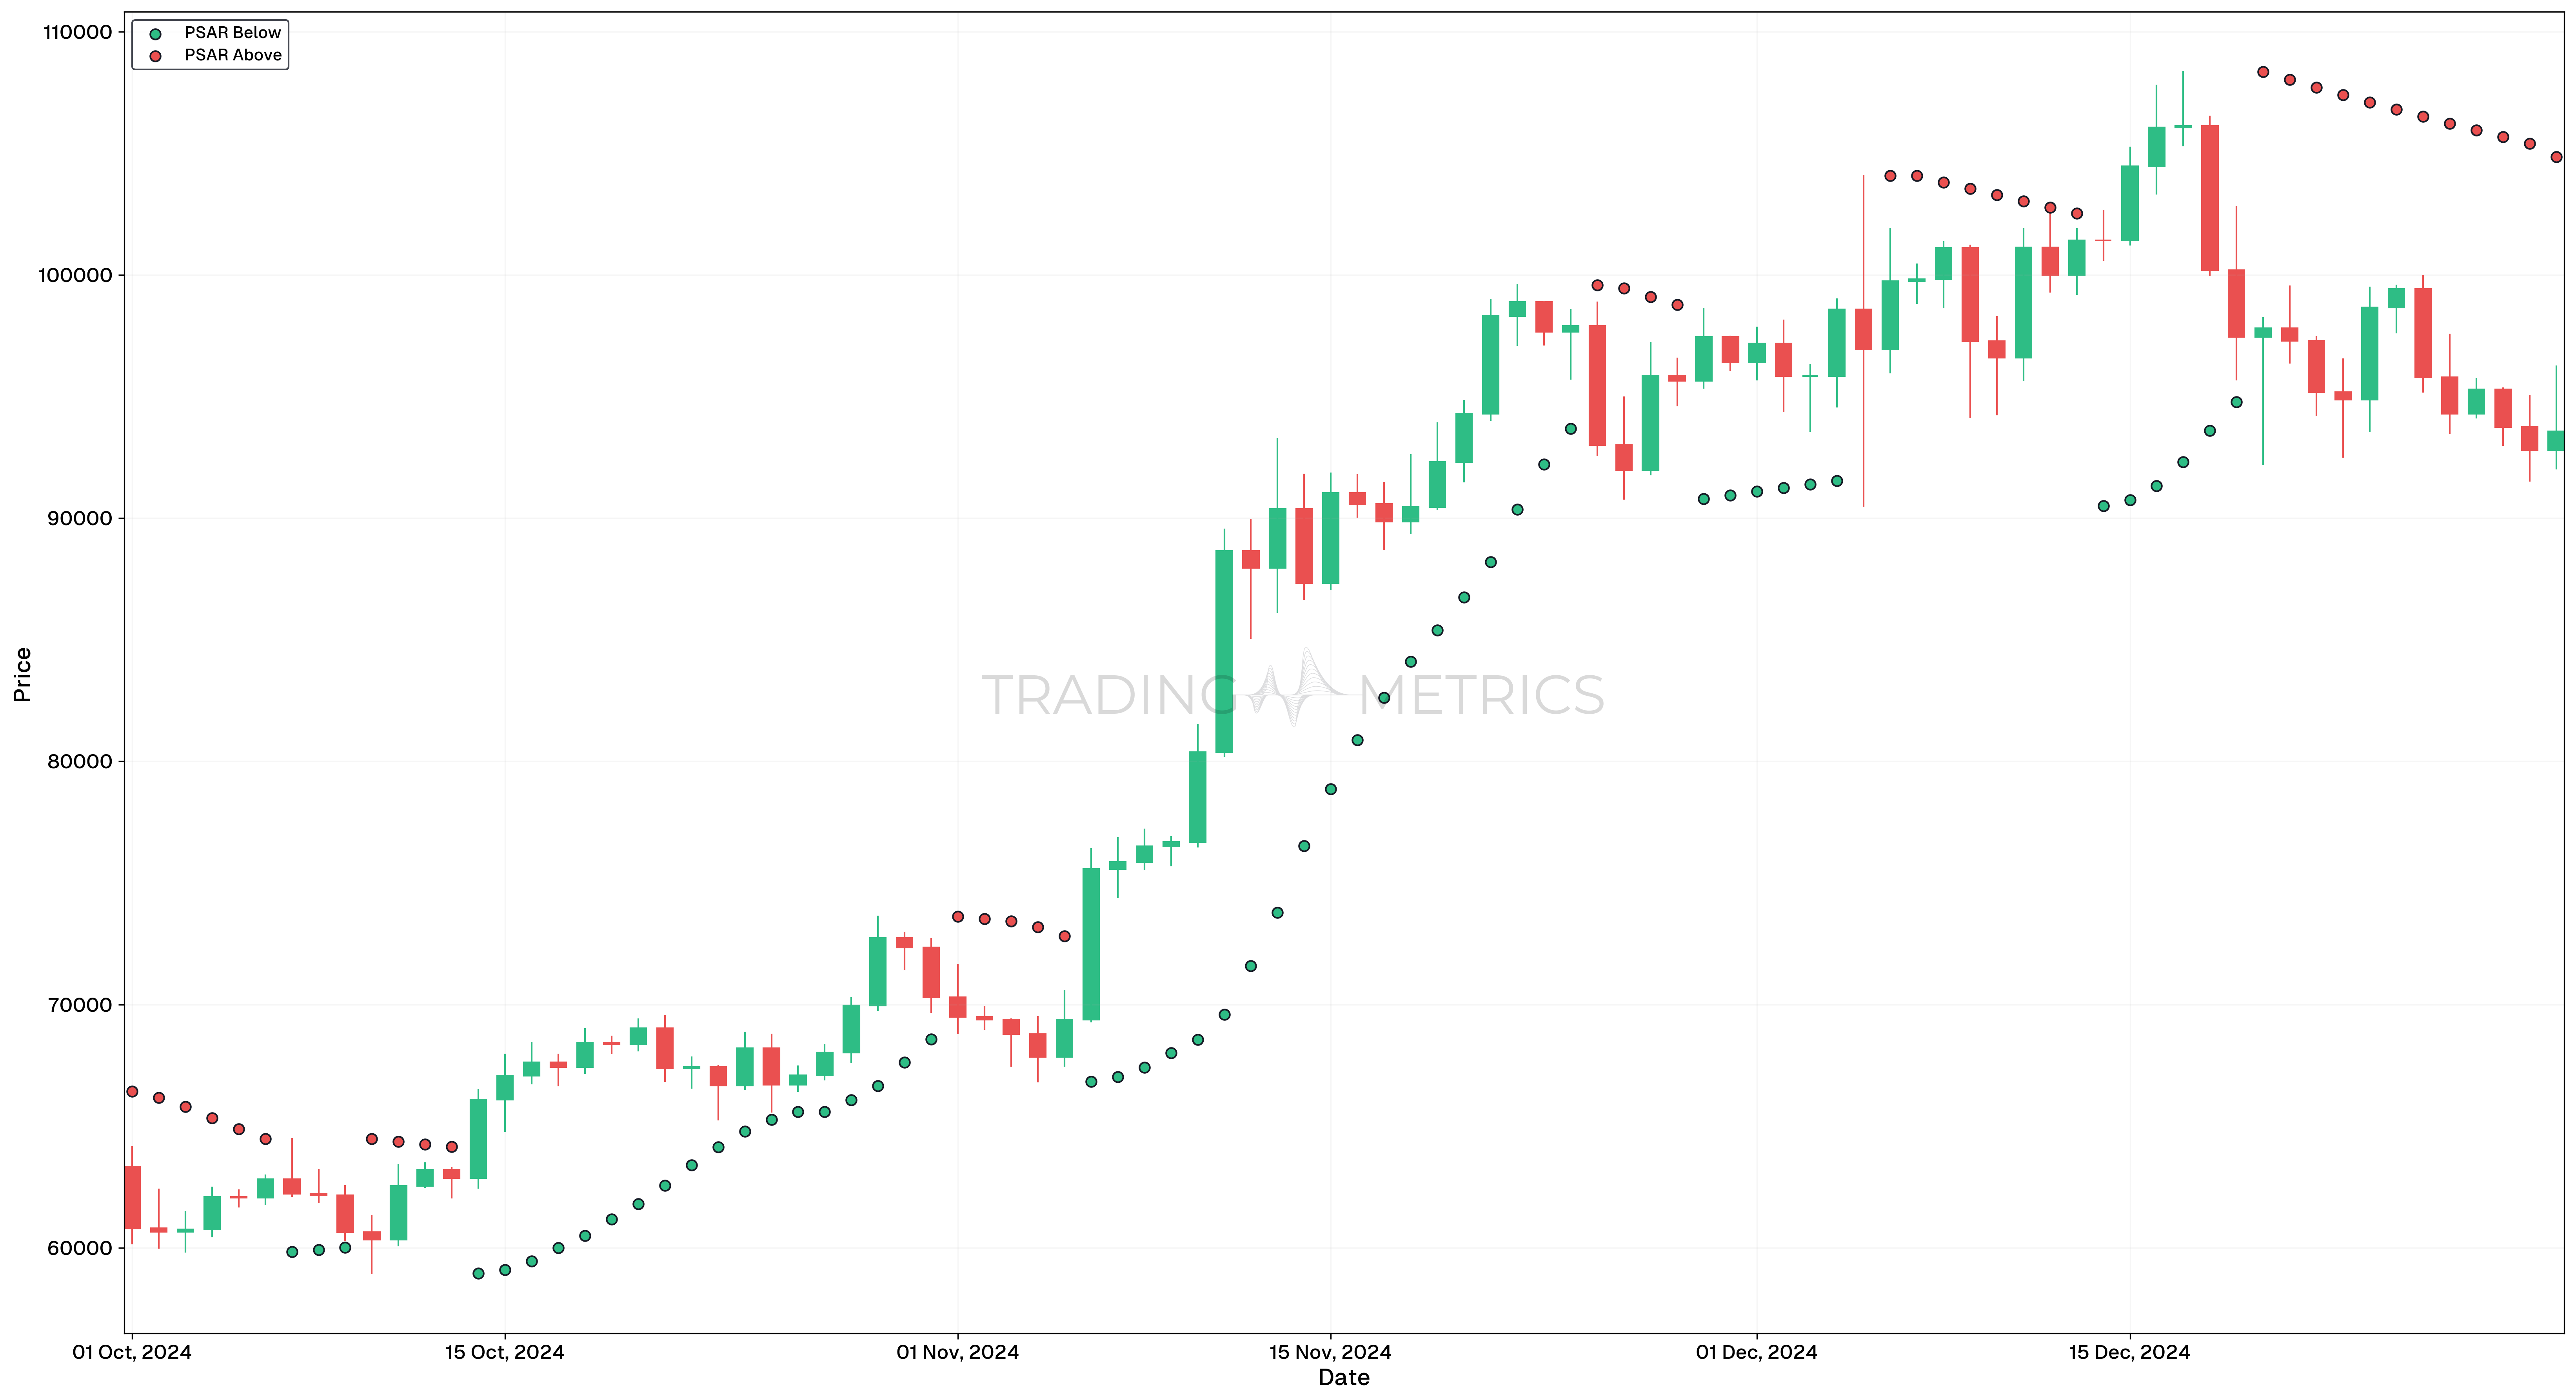
In this chart, we can see the Parabolic SAR dots below the price of Bitcoin, indicating an ongoing uptrend. Traders looking to enter the market might consider buying Bitcoin when the price first moves above the SAR dots, signaling the start of the uptrend.
Spotting a Downtrend and Preparing for Reversal
Now, let’s analyze a downtrend scenario and see how the Parabolic SAR can alert us to potential reversals.
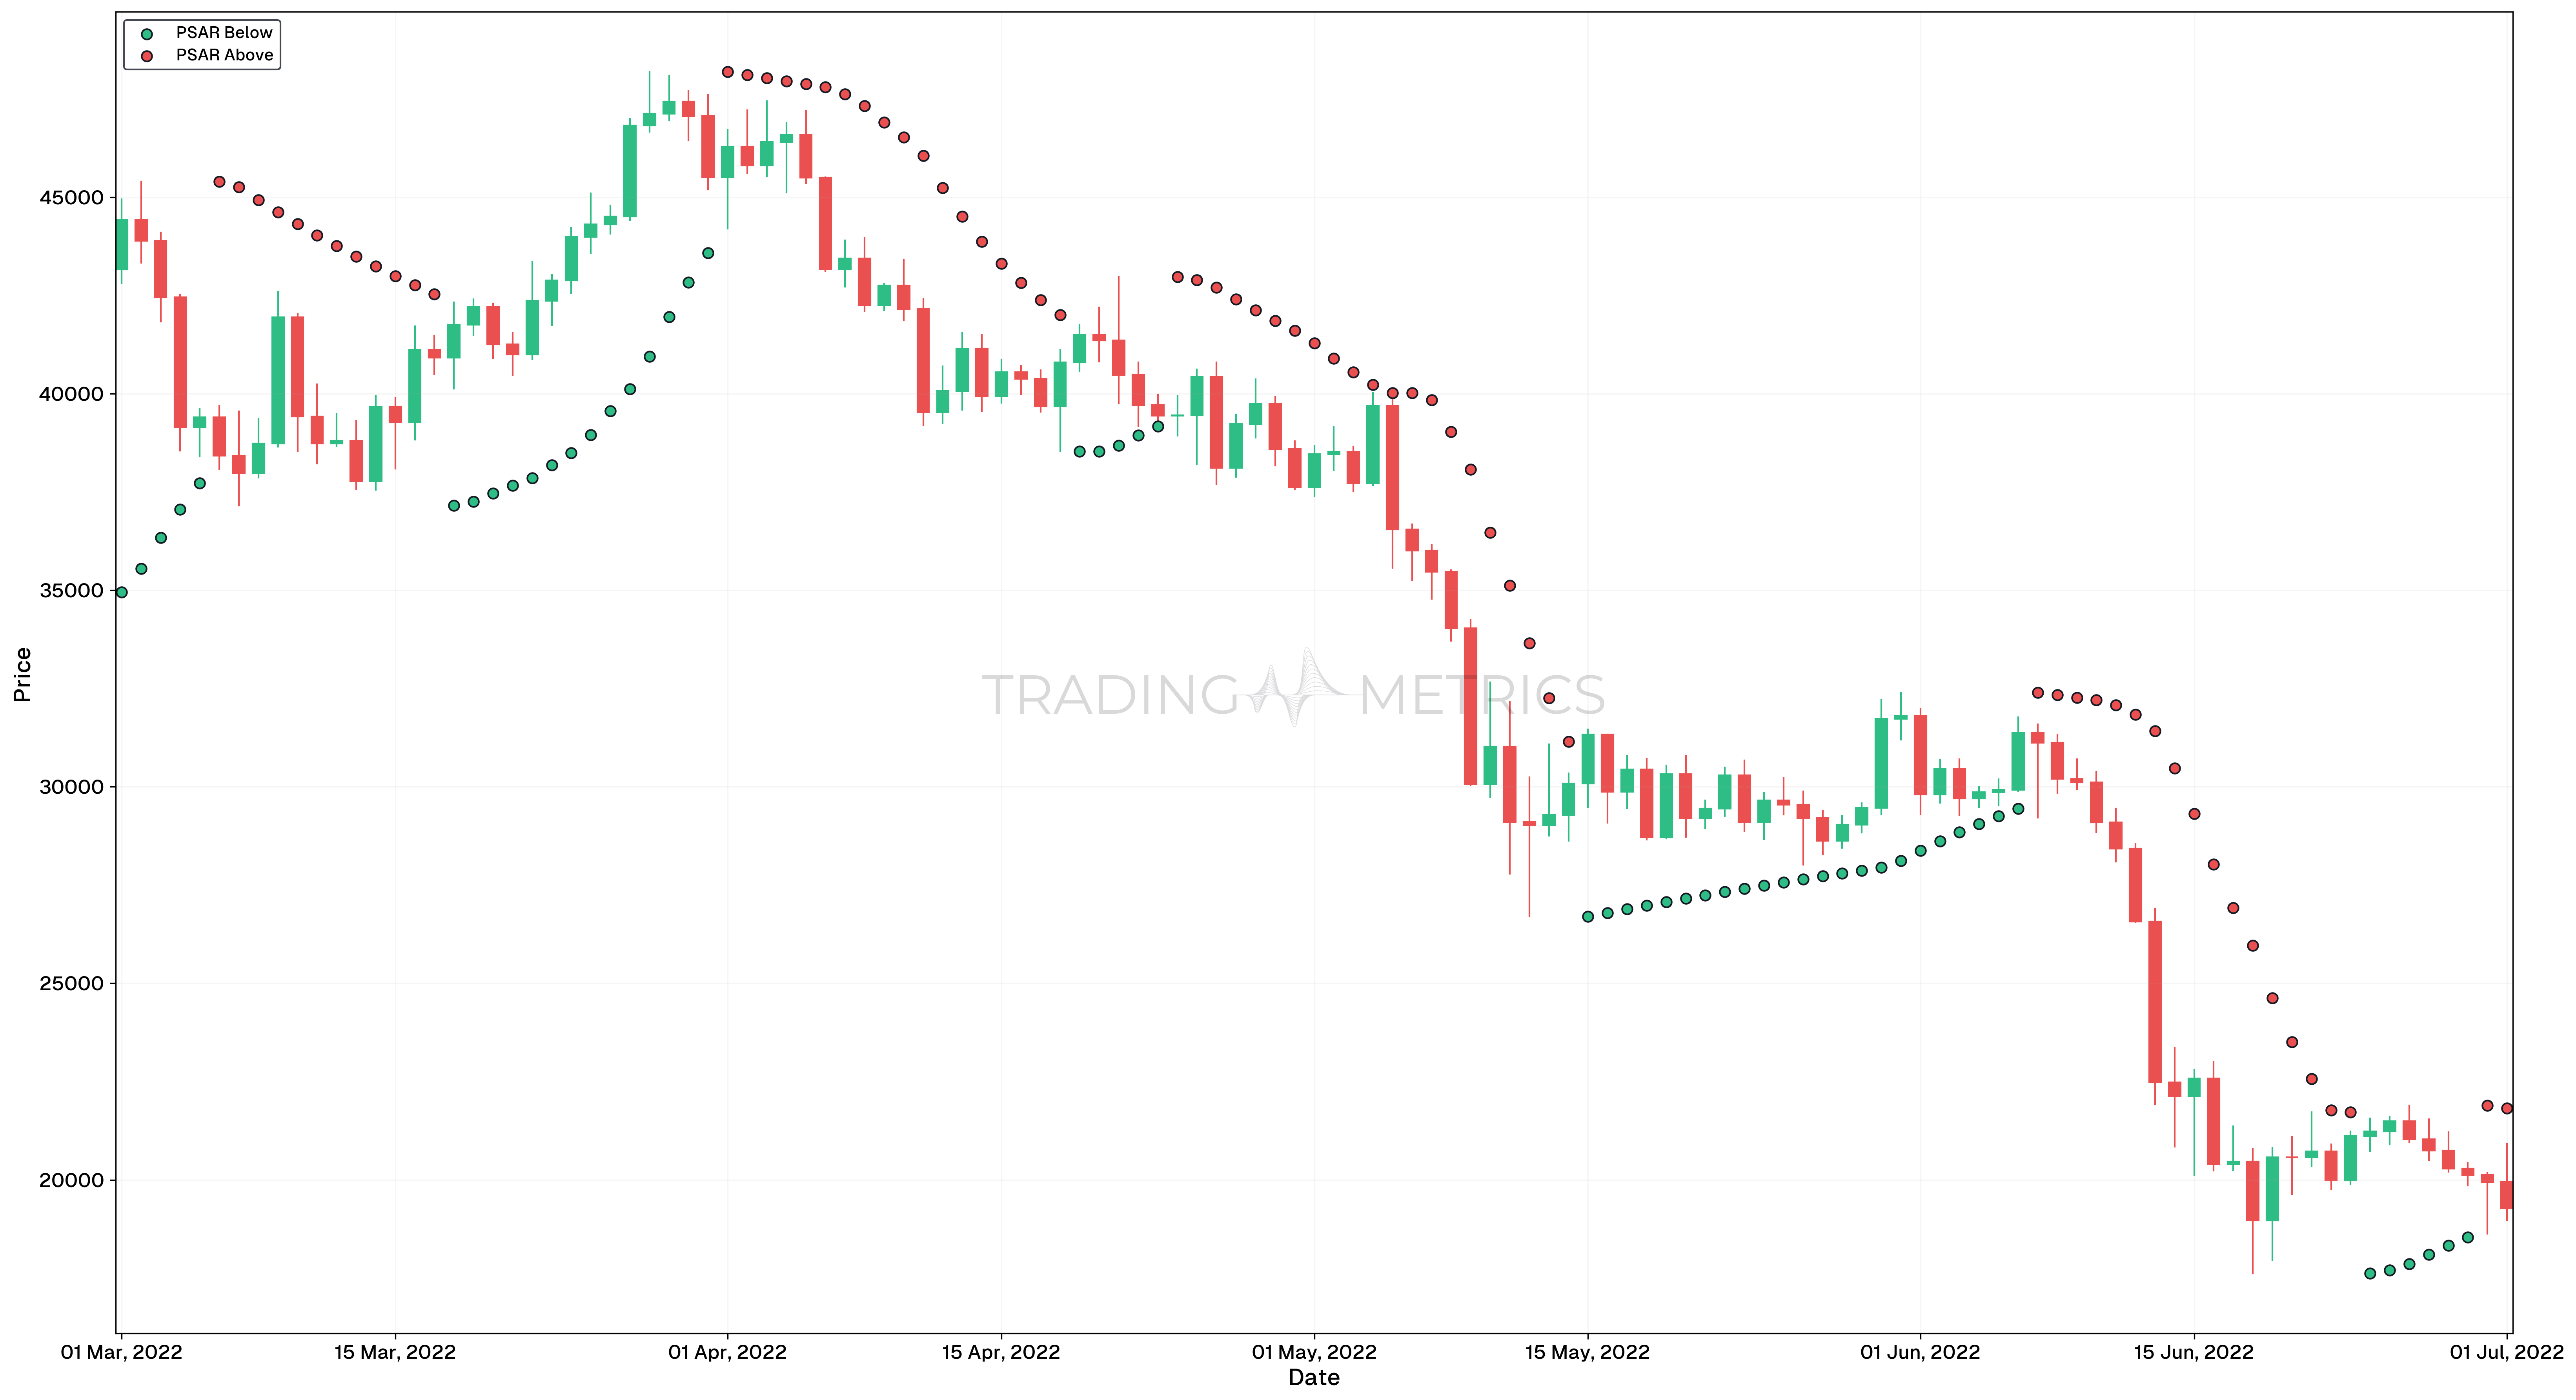
In this example, the Parabolic SAR dots are above the price, signaling a downtrend. Notice how the SAR dots move closer to the price as the trend progresses. When the price crosses above the SAR dots, it indicates a potential reversal. Traders might consider this an opportunity to exit short positions or even enter long positions as the market sentiment shifts.
Did You Know?: A smaller “step” in the Parabolic SAR settings makes the indicator more sensitive but increases the risk of false signals.
Combining Parabolic SAR with Other Tools
To enhance its effectiveness, Parabolic SAR is often combined with other technical analysis tools such as:
- Moving Averages: To smooth out price data and confirm trends.
- Relative Strength Index (RSI): To identify overbought or oversold conditions.
- MACD (Moving Average Convergence Divergence): To measure the strength and direction of a trend.
- Candlestick Patterns: To provide additional confirmation of trend reversals or continuations.
Risk Note: Parabolic SAR doesn’t work well in low-volatility markets - its effectiveness depends on clear trends.
Key Points
- Trend Following Indicator: The Parabolic SAR (Stop and Reverse) identifies the direction of a trend and provides potential reversal points, helping traders determine when to enter or exit trades.
- Dynamic Support and Resistance: The dots of the Parabolic SAR act as dynamic support (in an uptrend) and resistance (in a downtrend).
- Trailing Stop-loss Tool: It serves as an effective trailing stop-loss mechanism, helping to lock in profits during trending markets.
- Works Best in Trending Markets: The Parabolic SAR is most effective in strong, directional markets but can produce false signals in choppy or range-bound conditions.
- Sensitivity Adjustment: The acceleration factor (AF) can be customized to make the indicator more or less sensitive to price movements, depending on trading style and market volatility.
- Reversal Signals: When the dots flip from below the price to above, it signals a potential trend reversal from bullish to bearish, and vice versa.
- Use with Other Indicators: Combine the Parabolic SAR with trend or Momentum Indicators, such as moving averages or RSI, to confirm signals and reduce false positives.
- Short-Term Trading Focus: Due to its sensitivity, the Parabolic SAR is widely used by day traders and swing traders for short-term decision-making.
- Visualization Advantage: The clear and straightforward placement of dots above or below the price makes it easy to interpret for quick trading decisions.
- Backtesting for Reliability: Incorporate the Parabolic SAR into backtesting to evaluate its performance in different market conditions and adjust settings for optimal results.
Conclusion
While the Parabolic SAR can be a valuable tool for identifying trends and potential reversal points, it is most effective when used in conjunction with other technical indicators and in trending markets. By paying attention to market conditions and combining multiple tools, traders can improve their decision-making process and enhance their overall trading strategy.
Frequently Asked Questions
Quick answers based on this page's topic.
The Parabolic SAR uses dots placed above or below the price to signal the current trend. Dots below the price indicate a bullish trend, while dots above signal a bearish trend. When the dots flip from one side to the other, it marks a potential trend reversal.
Traders use the dots as a trailing stop-loss level. As the trend progresses, the dots 'accelerate' toward the price. By moving your stop-loss to each new dot, you lock in profits while giving the trade room to breathe until a formal reversal occurs.
The Parabolic SAR is highly prone to 'whipsaws' or false signals in sideways or ranging markets. It is most effective in trending environments where price moves clearly in one direction; in a range, the dots will flip frequently, leading to multiple small losses.