Bearish Pennant Pattern: Reading the Tightening Coil to Downside
The Bearish Pennant pattern is a swift bearish continuation signal in technical analysis, often emerging during a downtrend. Think of it as a brief timeout - price consolidating in a small, Symmetrical Triangle - before the downward plunge resumes. When this pattern takes shape, it’s a sharp nudge that bearish momentum is pausing only to reload, giving traders a window to sell or short the asset as the downtrend picks up steam.
How to Identify the Bearish Pennant Pattern in Trading
The Bearish Pennant is a continuation formation. It develops when price pauses in a small triangle after a sharp decline, before continuing the downtrend. The setup confirms when price breaks below support. Here’s how to spot it:
Start with the Big Picture
This pattern appears during a downtrend. Sellers drive price lower with a strong thrust, then the market consolidates briefly in a Bearish Pennant before continuing downward.
Trace the Flagpole and Pennant
The Bearish Pennant is built from two key components. Recognizing both confirms the structure.
- Flagpole: A steep decline powered by heavy selling.
- Pennant: A small, Symmetrical Triangle with converging lower highs and higher lows.
Zero in on the Support Line
The support line is the lower boundary of the Bearish Pennant. Buyers defend it briefly, but once it breaks, the pattern nears completion.
Watch the Breakdown
The bearish trigger comes when price closes below support.
- A decisive break under the lower boundary or
- A strong bearish candle
Both confirm continuation of the downtrend and provide the entry.
Check Volume for Additional Confirmation
Volume behavior reinforces the setup.
- Spikes on the flagpole as sellers dominate.
- Fades during the Bearish Pennant as activity cools.
- Surges on the breakdown, confirming renewed bearish strength.
Drop Down: Measure the height of the flagpole and project it downward from the break for a realistic price target.
How to Trade the Bearish Pennant Pattern (Trading Example)
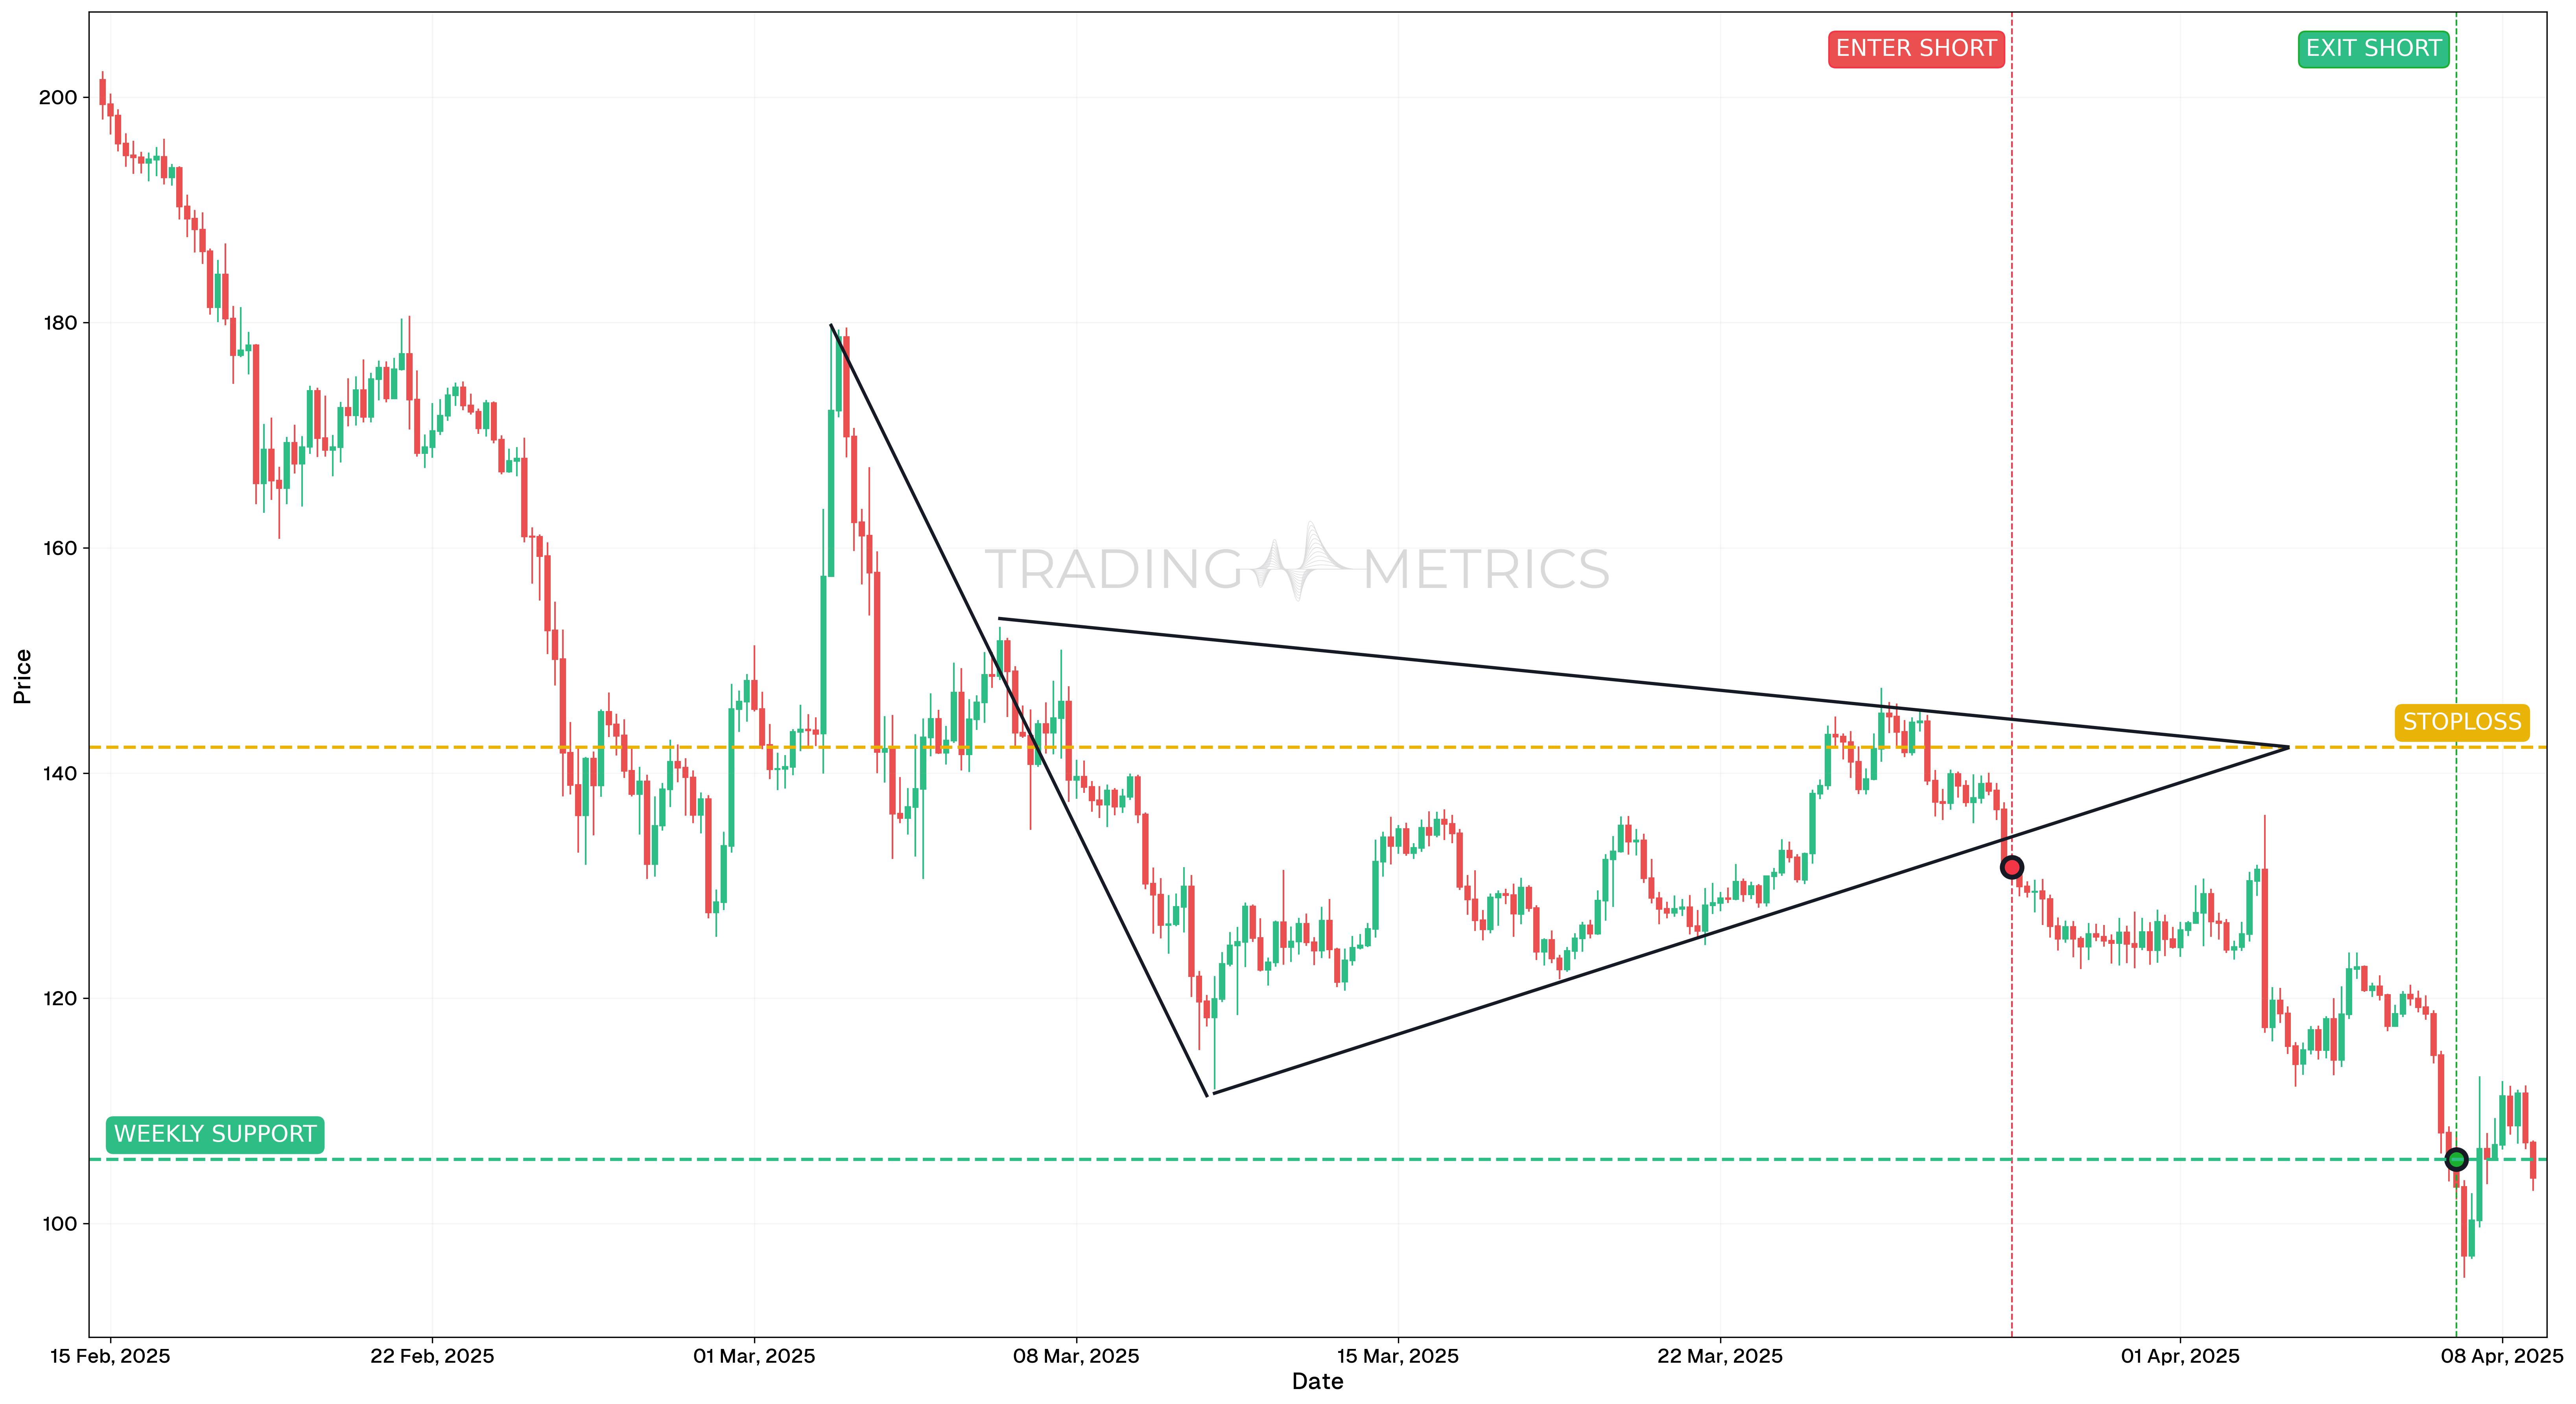
To illustrate how the Bearish Pennant pattern can be used to enter a trade, we will choose the SOLUSDT pair. This high-volume altcoin printed a classic continuation structure on the 4-hour chart, offering a short-term breakdown opportunity during a bearish leg.
Analysis
From February to late March 2025, SOLUSDT trended lower, followed by consolidation in a narrow Bearish Pennant. The Bearish Pennant sloped slightly upward in low volume, consistent with a corrective pause within a downtrend. The breakdown on March 28 confirmed bearish continuation and opened the door for downside extension.
Trade Setup
-
Entry: The short was entered on March 28, 2025, at 08:00, at $131.63, as price broke below the Bearish Pennant’s lower boundary. Entry confirmation included:
- RSI was below 50 and falling, but not yet oversold
- Strong bearish candle closing beneath the Bearish Pennant support
-
Exit: The trade was closed on April 7, 2025, at 00:00, at $105.69, as price reached a key previous support/resistance level. This area had previously halted price action and was used as a reliable take-profit zone.
-
Outcome: The Bearish Pennant led to a 19.7% gain, confirming the continuation setup. Price broke down with strong momentum and followed through toward the next structural zone.
Risk Management
- Stop-Loss placement: The stop-loss was placed at $142.29, just above the Bearish Pennant’s upper resistance and recent swing high. This level invalidated the pattern if breached.
- Position sizing: A 2% capital risk model was used, with size based on the distance from entry to stop-loss.
- Risk-Reward Ratio: This setup provided a Risk-Reward Ratio of 1:2.43, offering efficient reward relative to tightly managed risk.
- Volatility Consideration: The Bearish Pennant was formed in low Volatility conditions that expanded on breakdown. Timing the trade on breakout helped avoid premature entries inside the consolidation.
- Adaptive Exit Strategy: More aggressive traders could have targeted deeper weekly support around $100 or trailed with lower highs, but the chosen target ensured discipline and structure.
Volume Snap: A volume spike on the support break snaps the Bearish Pennant into a bearish dive.
Pre-Trade Checklist
Snap the Proof: Pair the pattern with volume surges and indicators like RSI to cut fakes and boost your edge.
Key Points
- Triangle Tightness: A sharp, symmetrical Bearish Pennant boosts the signal - loose shapes dilute it.
- Time Frame: Hits hard on daily or hourly charts in active downtrends.
- Combine with Indicators: Use moving averages or RSI to sharpen your entry.
- Breakout Confirmation: The support break keeps the trend rolling - don’t jump early.
- Price Target: Measure the flagpole height, project down from the break for your aim.
- Risk Management: Set a stop-loss above the Bearish Pennant’s high to cap losses if it fails.
Hold for the Snap: Acting before the support break risks a pennant-shaped trap - wait for the plunge.
Conclusion
The Bearish Pennant pattern is a trader’s quick grab for riding bearish continuations. Its tight triangle, paired with volume, RSI, and moving averages, can spark big drops. Whether in crypto, stocks, or forex, this pattern hones your game. Stay sharp, manage your risk, and let the Bearish Pennant tighten - that brief pause could snap into a winning fall.
Frequently Asked Questions
Quick answers based on this page's topic.
The difference is purely the shape of the consolidation. A flag moves within a parallel upward-sloping channel, while a pennant forms a small symmetrical triangle where the lines converge. Both are 1:1 continuation signals that follow a sharp price drop.
The 'tightness' of the pennant indicates that the market spent very little time hesitating. This lack of a deep retracement shows that sellers are highly aggressive and buyers are unable to mount even a minor defense, making a downward continuation highly probable.
Using the 'Measured Move' principle, you measure the height of the preceding flagpole and project that same distance downward from the pennant's breakout point. This target represents the next logical area where the trend might seek a new equilibrium.