Trading the Exhaustion Gap: When a Trend Runs Out of Fuel
The Exhaustion Gap is a dramatic reversal pattern in technical analysis that can occur at the end of strong uptrends or downtrends. It represents a final surge of momentum before the prevailing trend weakens and reverses.
- In a bearish scenario, price gaps up sharply after a prolonged rally, but then stalls and reverses, signaling the exhaustion of buying pressure and a potential shift into a downtrend.
- In a bullish scenario, price gaps down after an extended decline, only to stall and reverse upward, highlighting the exhaustion of selling pressure and the possibility of a new uptrend forming.
This pattern is a warning that the dominant side is losing strength, offering traders an opportunity to prepare for a potential reversal.
How to Identify the Exhaustion Gap Pattern in Trading
The Exhaustion Gap is a reversal candlestick pattern that appears near the end of a strong trend. Price gaps in the direction of the prevailing move, then quickly stalls and reverses, signaling that the dominant side is exhausted. Here’s the step-by-step guide.
Start with the Big Picture
This pattern develops after a prolonged trend. Momentum is stretched, participants are overcommitted, and the gap marks a final surge before exhaustion.
- Bearish scenario: follows an extended uptrend.
- Bullish scenario: follows an extended downtrend.
Trace the Gap Structure
The formation features:
- Pre-Gap Phase: A strong, often accelerating trend that may be going parabolic.
- Gap: A sharp directional gap that fails to sustain.
- Bearish: an upward gap where the day’s low opens above the prior day’s high, then stalls.
- Bullish: a downward gap where the day’s high opens below the prior day’s low, then stalls.
Zero in on the Confirmation Level
Use the edge of the gap nearest current price as the confirmation level.
- Bearish: the gap’s low - a close below it turns the area into a reversal zone.
- Bullish: the gap’s high - a close above it turns the area into a reversal zone.
Watch the Reversal Move
The trigger is a decisive close through the confirmation level in the opposite direction of the prior trend.
- Bearish: a close below the gap’s low confirms buyers have lost control.
- Bullish: a close above the gap’s high confirms sellers have lost control. Reversal candles or topping/bottoming formations add confidence.
Check Volume for Additional Confirmation
Volume helps validate exhaustion:
- Spike on the gap day - indicates climax participation from the fading side.
- Fade in volume as the original trend stalls.
- Rising volume on reversal follow-through reinforces the exhaustion turn in the new direction.
Drop Thrust: Measure the height of the gap or use nearby support levels to project a realistic price target downward from the reversal close.
How to Trade the Bearish Exhaustion Gap Pattern (Trading Example)
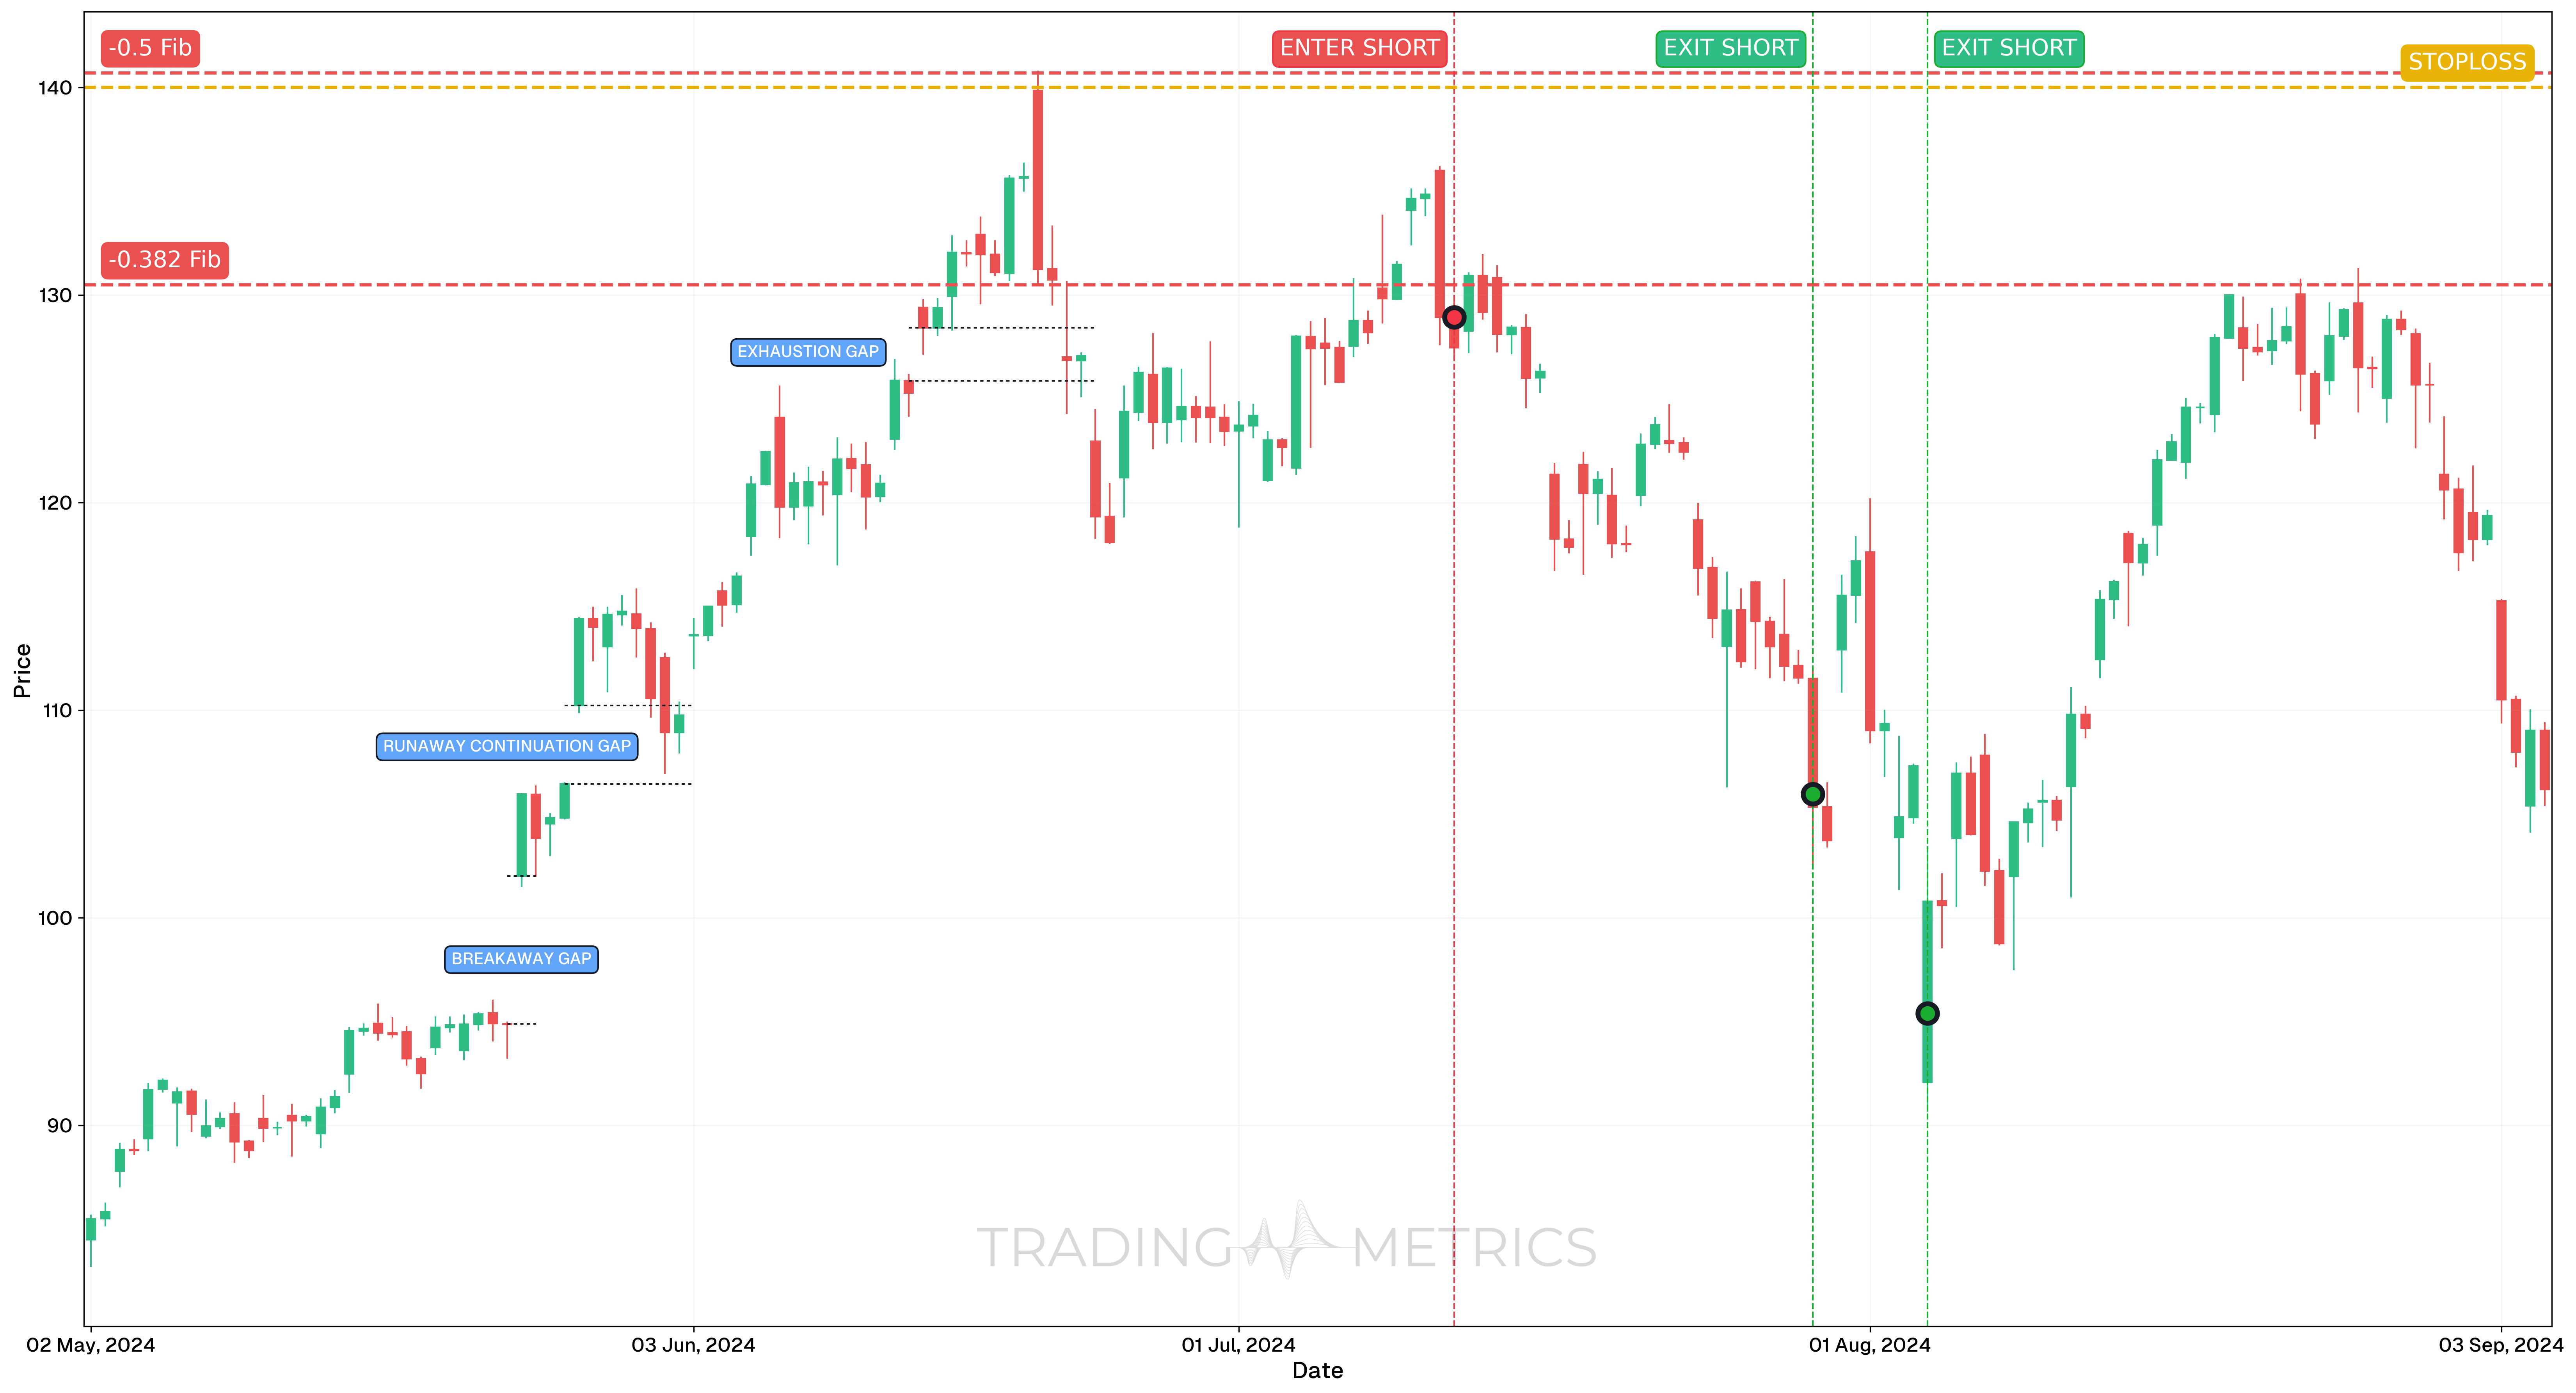
This trading example focuses on an Exhaustion Gap identified using the 4-hour timeframe, guided by broader weekly Fibonacci Retracement levels and gap fill logic. The setup captures the market’s exhaustion following a strong trend and leverages confirmed rejection at a key resistance zone.
Analysis
The Fibonacci Retracement was drawn on the weekly timeframe from October 10, 2022 ($10.81) to March 4, 2024 ($97.40). Based on this move, Negative Fibonacci Mirror Levels were projected upward and used as dynamic resistance levels for identifying reversal zones.
The exhaustion gap was filled, and price rejected the -0.382 level, triggering the reversal. A Bearish Engulfing candle printed on July 11, 2024, at 19:30, confirmed short bias.
Trade Setup
-
Entry: Entered short on July 11, 2024, at 19:30, at $128.93, after confirmation via:
- Bearish Engulfing candle at Fibonacci -0.382 resistance
- RSI and StochRSI showing reversal signals
-
Exit: Take Profits were set based on previous gap zones, assuming they would be filled:
- TP1 (July 30, 2024): $105.96 - Previous Runaway Continuation Gap open
- TP2 (August 5, 2024): $95.38 - Previous Breakaway Gap open
-
Outcome: Both take profits were hit, with the first reclaiming the filled Runaway Continuation Gap, and the second reaching the Breakaway Gap. This confirmed exhaustion and a broader shift in trend.
Risk Management
- Stop-Loss Placement: Stop-Loss was placed at $140.00, above the engulfing candle high and the rejected Fibonacci resistance zone.
- Risk-Reward Ratio:
- TP1:
- Risk per share: $140.00 - $128.93 = $11.07
- Reward: $128.93 - $105.96 = $22.97
- Risk-Reward Ratio = 1:2.07 – This is a solid short-term trade profile, offering more than double the reward for each unit of risk taken.
- TP2:
- Risk per share: $140.00 - $128.93 = $11.07
- Reward: $128.93 - $95.38 = $33.55
- Risk-Reward Ratio = 1:3.04 – An excellent swing target with over 3x reward, highly favorable when technical confluence is strong.
- TP1:
- Position Sizing: Based on a 2% capital risk model, using the defined stop-loss distance for accurate sizing.
- Volatility Consideration: The engulfing candle followed a sharp rejection, aligning with compressed Volatility and confirming the exhaustion nature of the gap.
- Confirmation Confluence: Entry was not taken immediately after the gap was filled. Instead, additional confirmation was required:
- Gap fill alone is not sufficient for exhaustion
- Rejection of -0.382 level + Bearish Engulfing candle confirmed reversal
Volume Drop: A volume peak on the gap day, followed by a decline, confirms the exhaustion.
Pre-Trade Checklist
Key Points
- Gap Climax: A sharp gap after a long trend boosts reliability - small gaps dilute its signal.
- Time Frame: Most effective on daily or weekly charts after prolonged trends.
- Combine with Indicators: Use EMA or RSI to confirm the reversal direction.
- Breakout Confirmation: A decisive close through the gap’s edge signals the turn.
- Bearish: a close below the gap’s low confirms reversal down.
- Bullish: a close above the gap’s high confirms reversal up.
- Price Target: Use the gap height or nearby support/resistance levels to project reversal targets.
- Risk Management: Place a stop-loss beyond the extreme of the gap (above the high in bearish cases, below the low in bullish cases) to limit losses if it fails.
Wait for Confirmation: Acting before the reversal confirms risks entering a false signal — let the move prove itself first.
Conclusion
The Exhaustion Gap pattern is a powerful tool for spotting potential trend reversals. Its climactic gap, when paired with volume, RSI, and EMA, can highlight the fading strength of the prevailing move. Whether in crypto, stocks, or forex, this pattern sharpens your edge. Stay alert, manage your risk, and let the market confirm the exhaustion — that final burst could set the stage for a profitable reversal, upward or downward.
Frequently Asked Questions
Quick answers based on this page's topic.
An Exhaustion Gap occurs at the end of a long, parabolic move and is characterized by a massive volume spike. Unlike other gaps, it is quickly 'filled' within a few candles. This rapid filling is the technical signal that the trend has run out of participants and a reversal is imminent.
Climactic volume represents a total transfer of ownership from 'strong hands' to late-entering 'weak hands.' When this surge occurs alongside a gap at the end of a trend, it signals a final burst of greed or fear that exhausts the available supply or demand.
The distinction lies in follow-through. A Runaway Gap leads to immediate price acceleration and stays open, confirming trend strength. An Exhaustion Gap sees price stall immediately after the jump and fills the gap quickly, signaling that the trend has reached its terminal point.