Stochastic Oscillator: Timing Reversals Before the Crowd
Imagine you’re at a lively dance party, and everyone around you is grooving to the music. Some dancers are moving in sync with the beat, while others are a bit out of step. This is similar to how the Stochastic Oscillator helps traders interpret the market’s rhythm and make informed trading decisions.
Overbought and oversold are not absolutes - they are invitations to question the market's next move.
- Anonymous
How to Use the Stochastic Oscillator?
The Stochastic Oscillator is a momentum indicator ranging from 0 to 100, represented by two lines:
- %K Line: The primary line, showing the current closing price relative to the range over a set period.
- %D Line: A smoothed moving average of the %K Line, used as a signal line.
Understand Overbought and Oversold Levels: The Stochastic Oscillator identifies overbought levels above 80 and oversold levels below 20, signaling potential reversals. Use these levels as a starting point, not a guarantee.
How to Calculate the Stochastic Oscillator?
Here is a step-by-step guide to calculating the Stochastic Oscillator:
Determine the Lookback Period
Common choices are 14, 9, or 5 periods, but this can vary based on the trader’s strategy.
Identify the Highest High and Lowest Low
For the chosen lookback period, find the highest high and the lowest low.
Calculate %K Line
Subtract the Lowest Low from the Current Close:
Subtract the Lowest Low from the Highest High:
Divide the result from step 1 by step 2 and multiply by 100 to get %K:
Calculate %D Line
Compute the SMA of the %K values over the chosen smoothing period (usually 3 periods).
Importance of the Stochastic Oscillator in Trading
The stochastic oscillator is a important momentum indicator that helps traders identify overbought and oversold conditions in the market by comparing a security’s closing price to its price range over a specific period. It aids in spotting potential trend reversals and provides actionable signals when combined with other indicators, enhancing decision-making in both trending and range-bound markets.
Avoid Using It in Isolation: While powerful, the Stochastic Oscillator should be part of a broader strategy. Pair it with support/resistance levels, price action, or other indicators.
Stochastic Oscillator in a Trending Market
In this section, we will analyze the BTC/USDT pair over a period from August 31, 2020, to March 14, 2022, using the weekly candlestick chart. This period covers significant movements in Bitcoin’s price, where the Stochastic Oscillator, specifically the Stochastic RSI (StochRSI), provided valuable signals for traders in a trending market.
Analysis
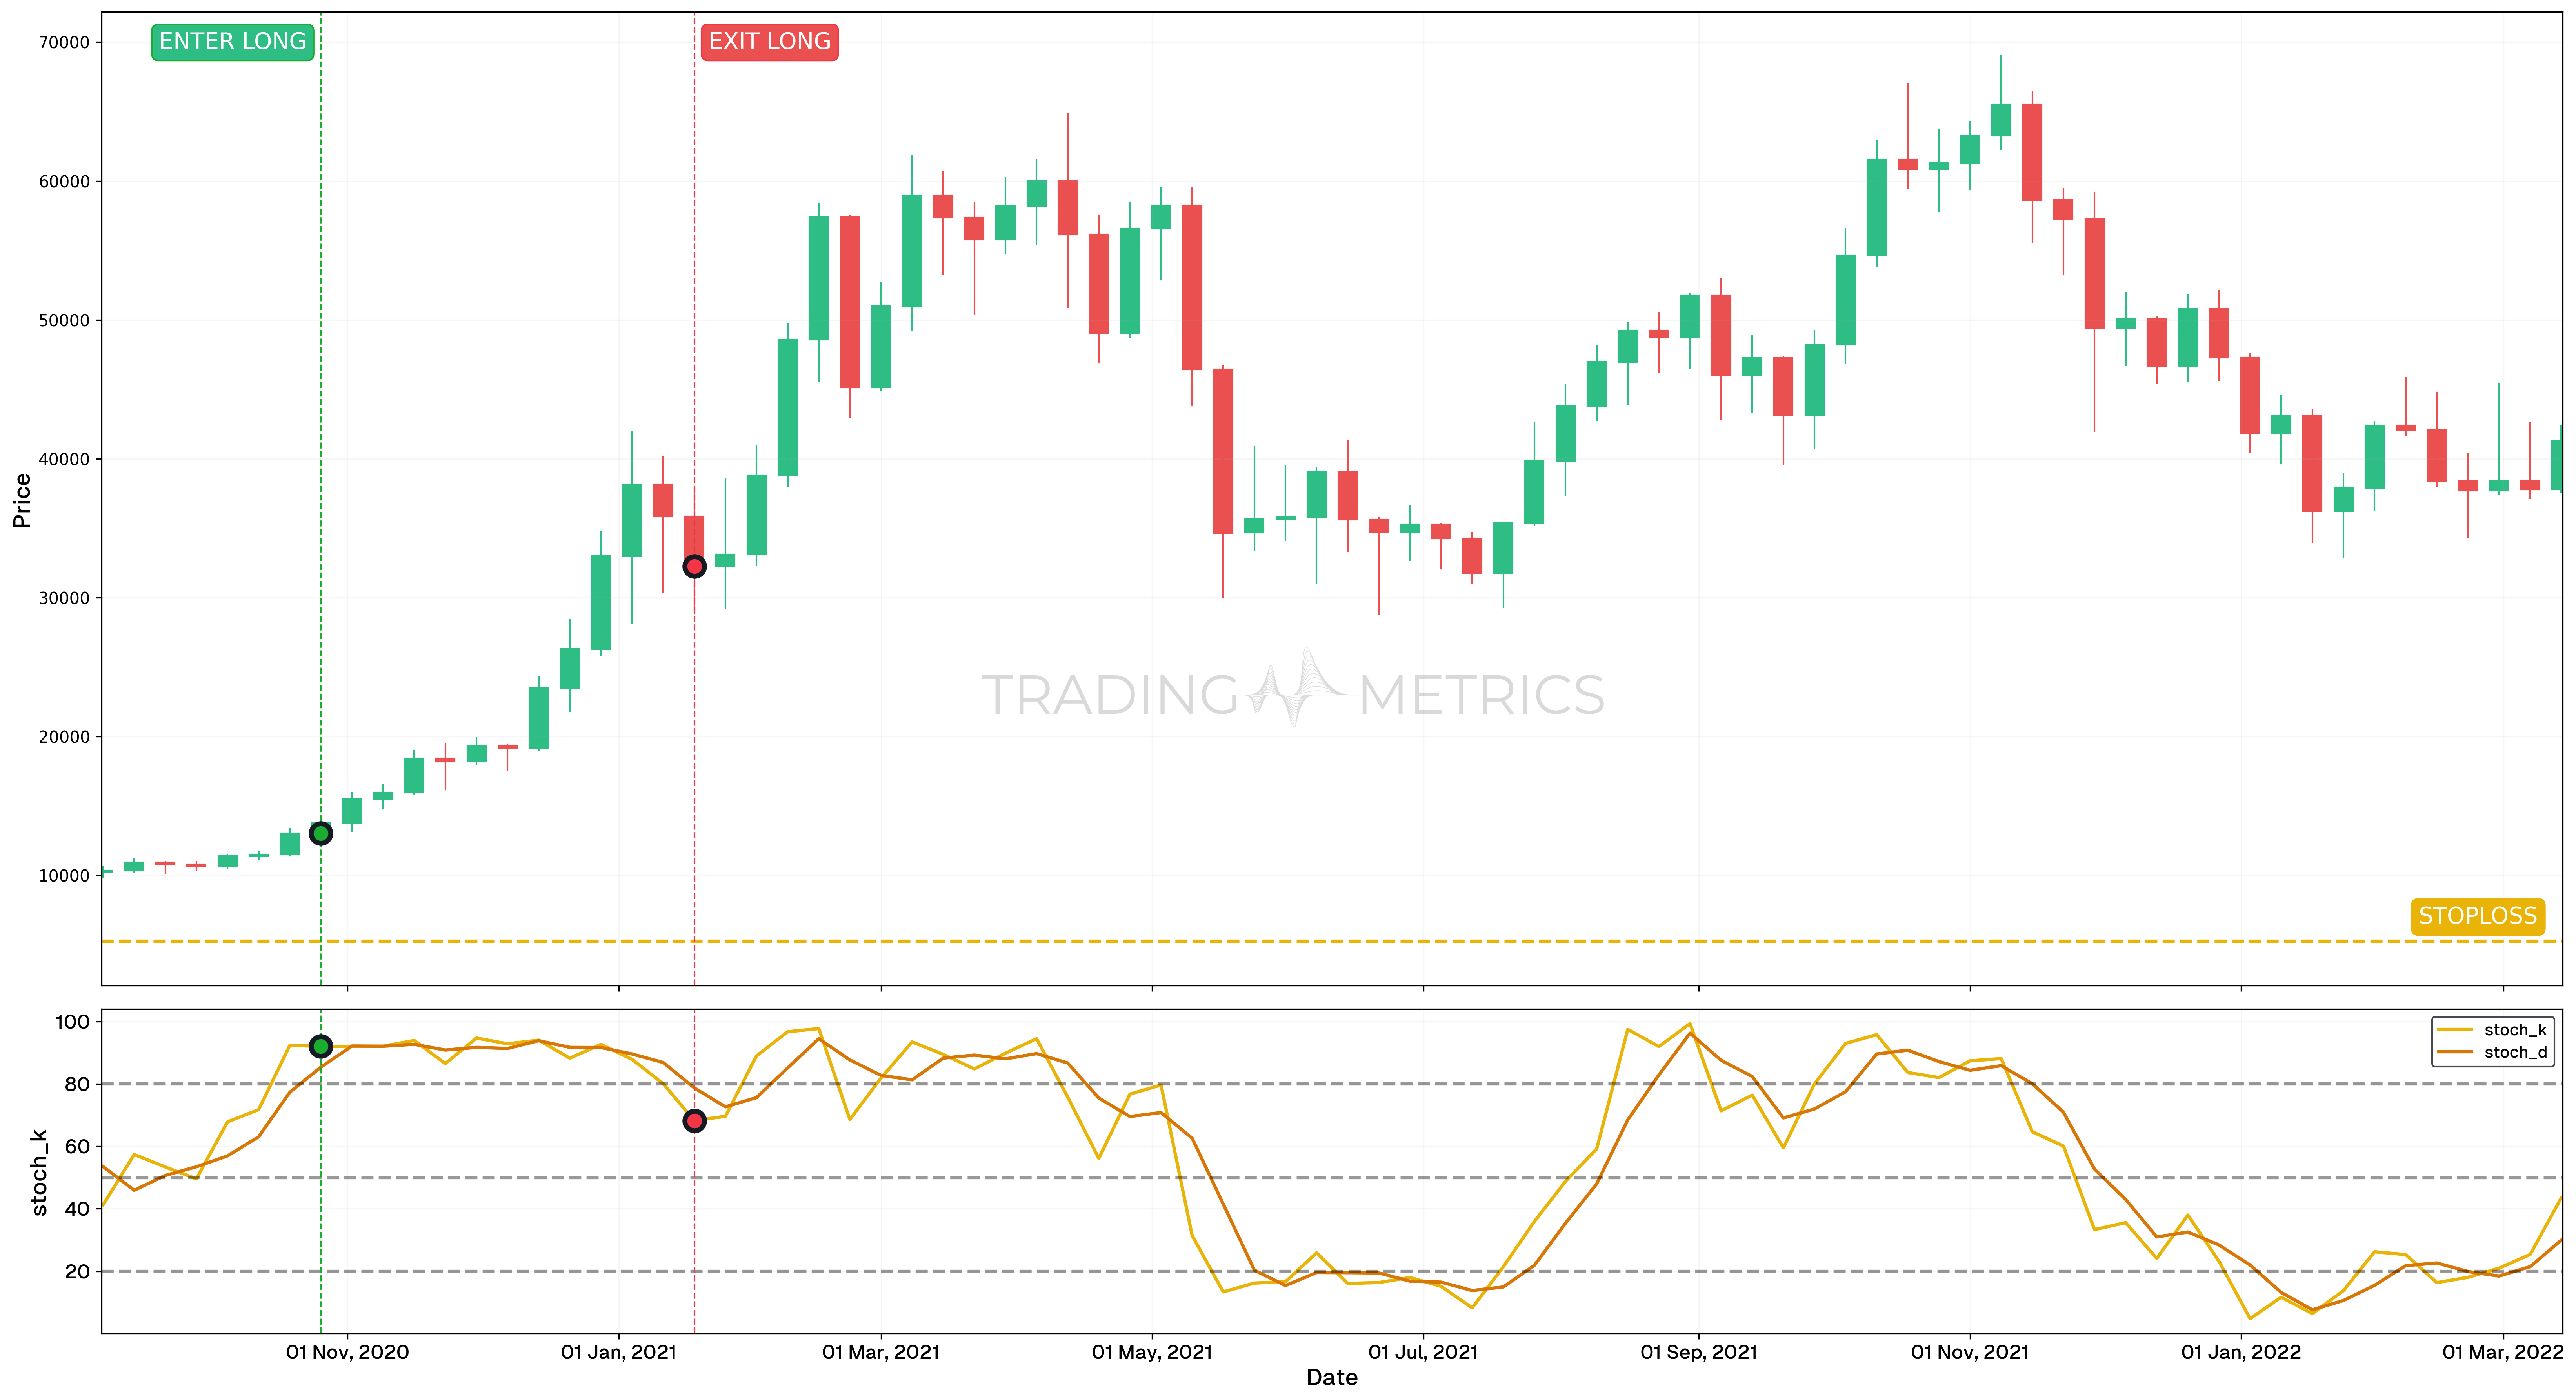
- The BTC/USDT pair was analyzed over a period from August 31, 2020, to March 14, 2022, using the weekly candlestick chart. This timeframe captured significant price movements in Bitcoin, during which the Stochastic Oscillator provided critical trading signals in a trending market.
- On October 19, 2020, the Stochastic Oscillator %K line crossed above 80, signaling an entry into overbought territory. However, in a strong uptrend, overbought conditions often persist, indicating continued bullish momentum.
- From October 19, 2020, to January 18, 2021, the Stochastic Oscillator remained above 80, highlighting the strength of the uptrend. During this period, Bitcoin experienced a remarkable price increase of approximately 182.78%.
- On January 18, 2021, the Stochastic Oscillator %K line crossed back below 80, signaling the end of the extreme overbought condition. This provided traders with an opportunity to lock in profits or prepare for potential retracement or consolidation.
- Despite moving out of the overbought zone, Bitcoin continued to exhibit strength, supported by volatility and maintaining an upward bias.
Trade Setup
- Entry: On October 26, 2020, traders could have entered a long position as the Stochastic Oscillator %K line crossed above 80, signaling strong bullish momentum in a trending market.
- Exit: A potential exit could have been placed on January 18, 2021, when the Stochastic Oscillator %K line crossed back below 80, indicating a loss of extreme momentum. Conservative traders may have chosen to secure profits here, while those with higher risk tolerance might have held positions longer, anticipating further gains amid a strong uptrend.
- Outcome: A hypothetical trade following these signals could have captured a 182.78% gain, reflecting the strength of technical analysis and the importance of aligning trades with market conditions. This example highlights the value of understanding how the Stochastic Oscillator behaves in a trending market, as it can remain in extreme zones (overbought or oversold) for extended periods.
Risk Management
- Stop-Loss Placement: The stop-loss was strategically set at $5,250, below a key support level to mitigate the risk of a potential retracement while maintaining a controlled risk profile.
- Position sizing: Position size was calculated to ensure a maximum risk exposure of 2% of trading capital, aligning with the overall risk management strategy and account size.
- Risk-Reward Analysis: The trade setup provided a Risk-Reward Ratio of 1:2.5, balancing the potential upside with the defined risk, ensuring consistency with risk management principles.
- Managing Volatility: Given the potential for sharp market movements, the stop-loss was actively monitored and adjusted to secure profits while protecting against sudden reversals.
- Exit Strategy: As the price approached key resistance levels, a partial exit strategy was considered to lock in gains while allowing for further price action development in the direction of the prevailing trend.
Bearish Divergence
In this analysis, we observe a bearish divergence that occurred between January 29, 2021, and March 8, 2021. A bearish divergence is identified when the price action on a candlestick chart forms higher highs, while an indicator, such as the Stochastic Oscillator, forms lower highs. This divergence often signals a potential reversal in the price trend.
Analysis
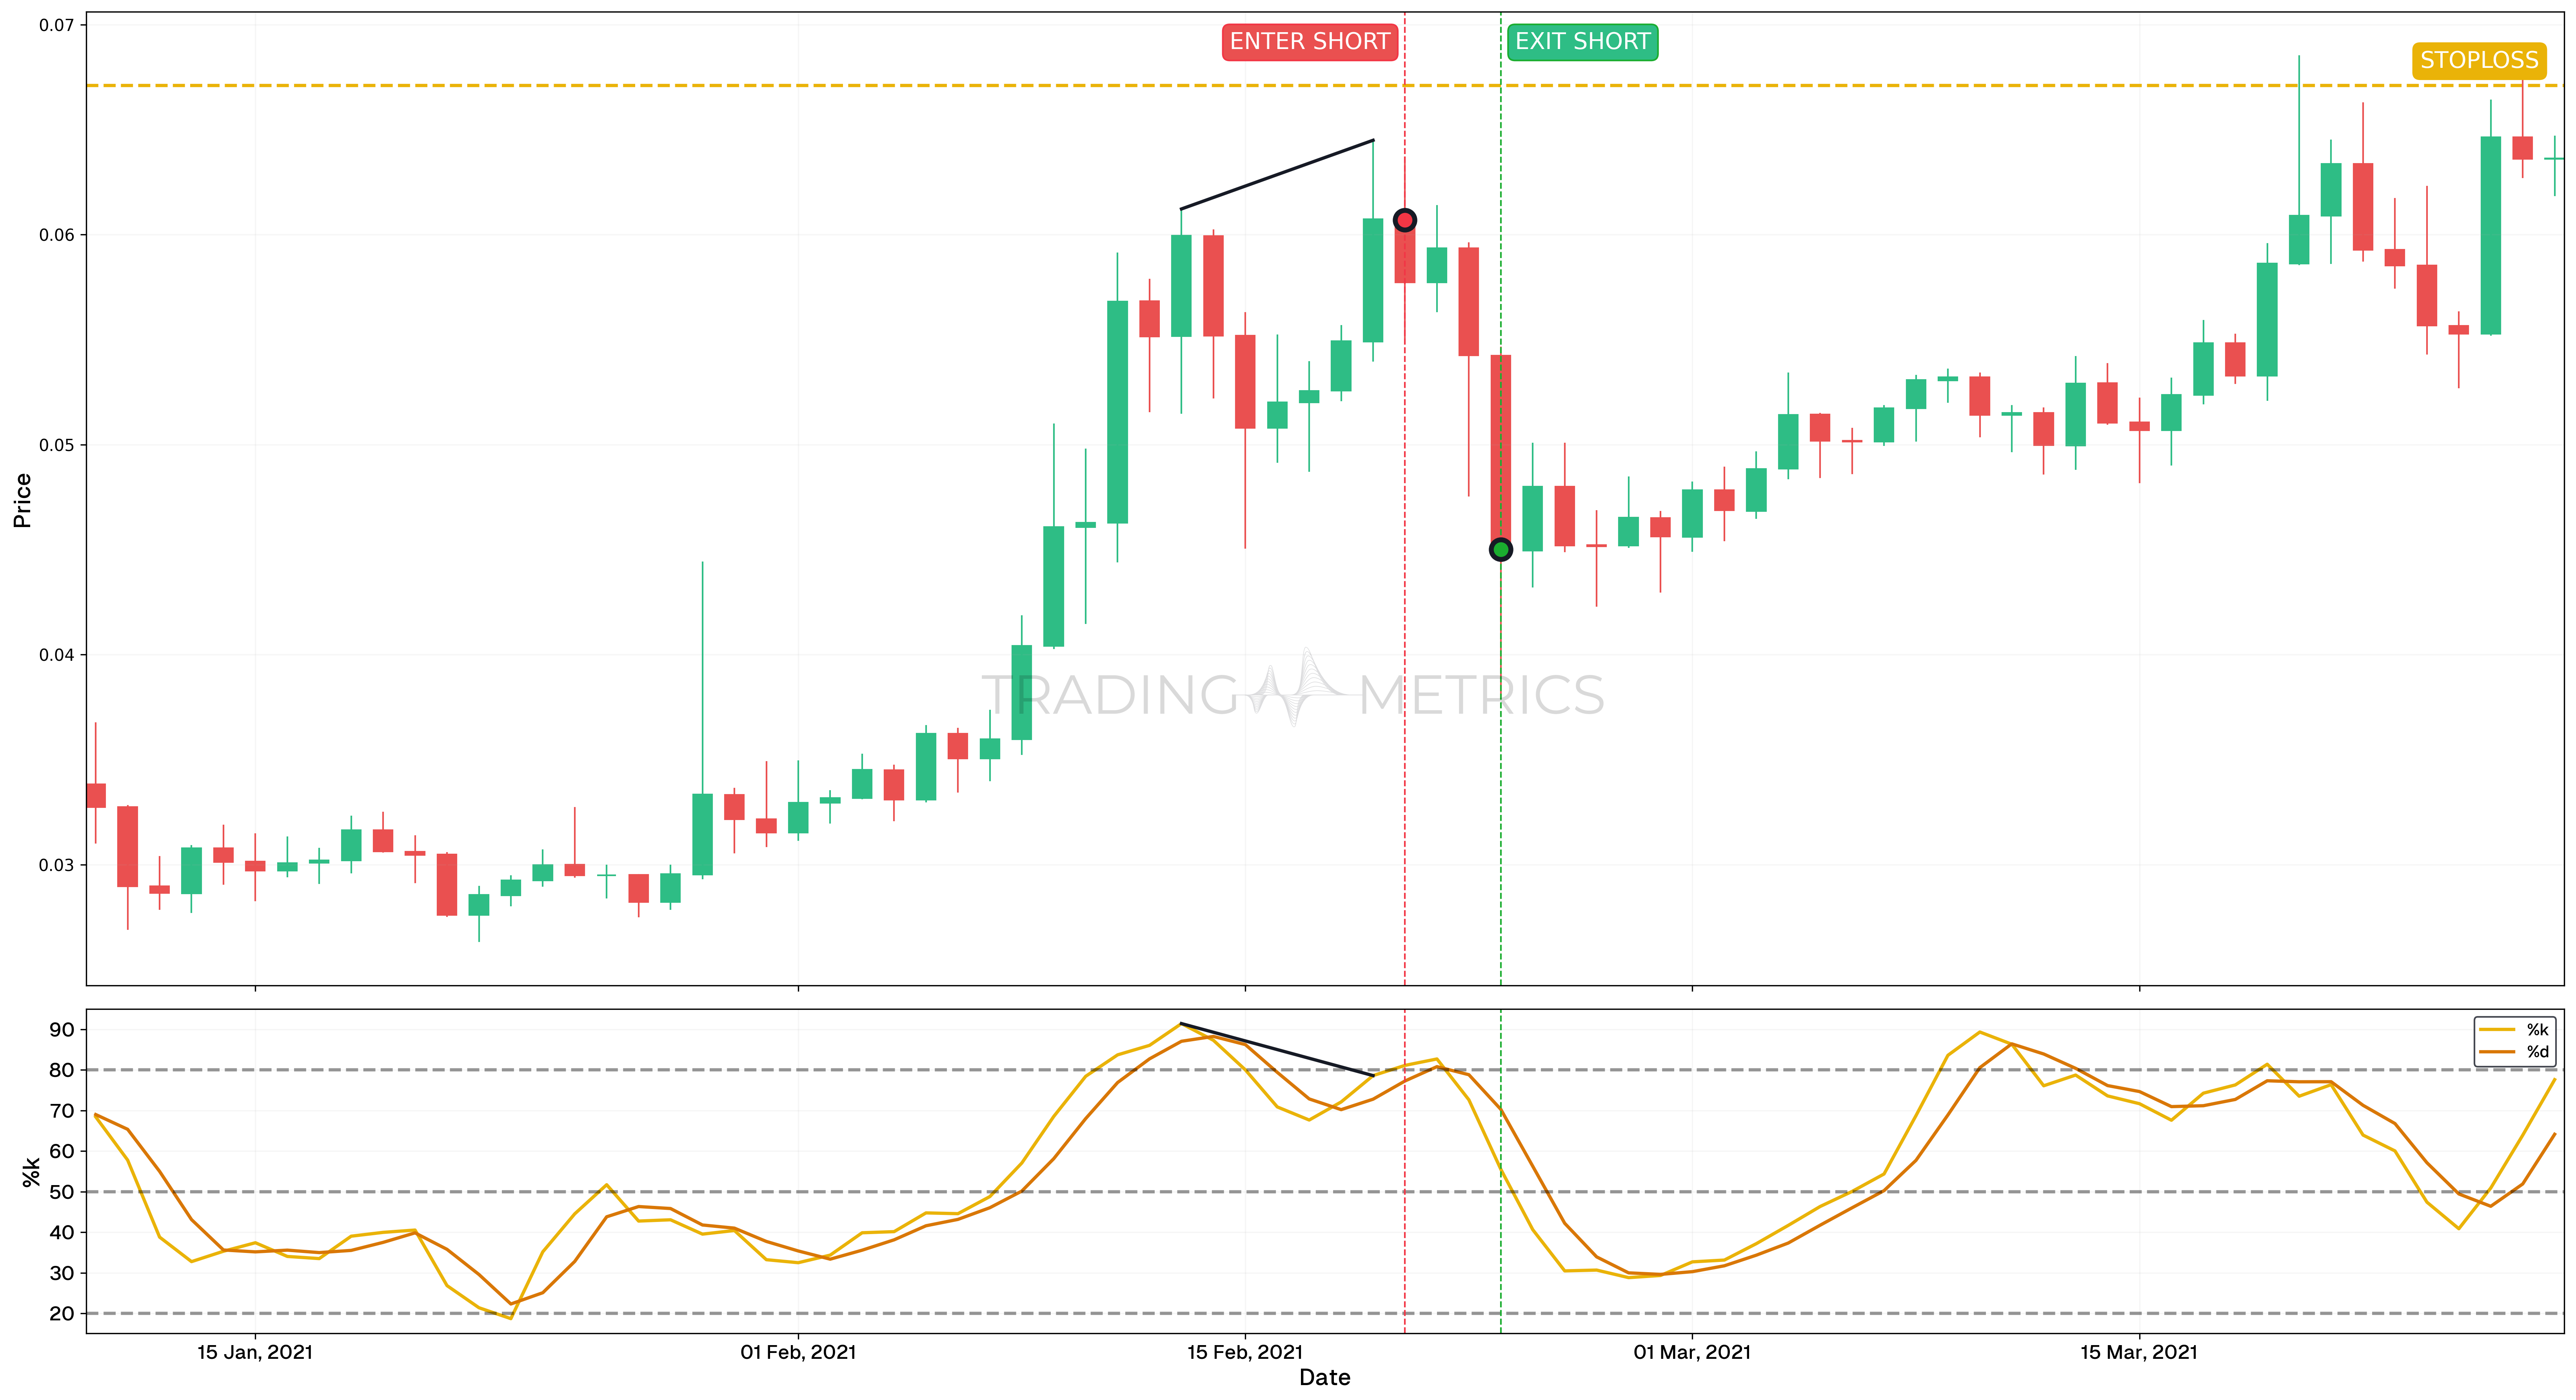
- The TRX/USDT pair was analyzed over a period from January 29, 2021, to March 8, 2021, focusing on a bearish divergence observed during this timeframe. This divergence is a critical signal indicating potential trend reversals.
- Between February 13, 2021, and February 19, 2021, the price chart formed higher highs, while the Stochastic Oscillator %K line displayed lower highs. This mismatch highlighted weakening momentum, a classic hallmark of bearish divergence.
- The confirmation of the bearish divergence on February 19, 2021, signaled an opportunity for a short trade, aligning with the expected downward price movement.
Trade Setup
- Entry: A short position was initiated on February 20, 2021, when the bearish divergence was confirmed. The entry was based on the closing price of the candlestick on that date.
- Exit: The position was closed on February 23, 2021, after the price experienced a significant drop, capturing the downward movement as indicated by the Stochastic Oscillator.
- Outcome: The trade resulted in a 41.08% price drop, validating the reliability of the bearish divergence as a trading signal.
Risk Management
- Stop-Loss Placement: The stop-loss was strategically set at $0.0671, aligning with the -61.8% Fibonacci Retracement level, providing a buffer against potential reversals while maintaining a controlled risk profile.
- Position sizing: Position size was calculated to ensure a maximum risk exposure of 2% of trading capital, aligning with the overall risk management strategy and account size.
- Risk-Reward Analysis: The trade setup provided a Risk-Reward Ratio of 1:2.44, balancing the potential upside with the defined risk, ensuring consistency with risk management principles.
- Managing Volatility: Given the potential for sharp market movements, the stop-loss was actively monitored and adjusted to secure profits while protecting against sudden reversals.
- Exit Strategy: As the price approached key support levels, a partial exit strategy was considered to lock in gains while allowing for further price action development in the direction of the prevailing trend.
Conclusion
This example demonstrates the effectiveness of identifying momentum divergences and utilizing tools like the Stochastic Oscillator to capitalize on potential trend reversals in trading.
Bullish Divergence
In this analysis, we observed a bullish divergence on the BTC/USDT chart for the period from 18 November 2019 to 09 March 2020.
Analysis
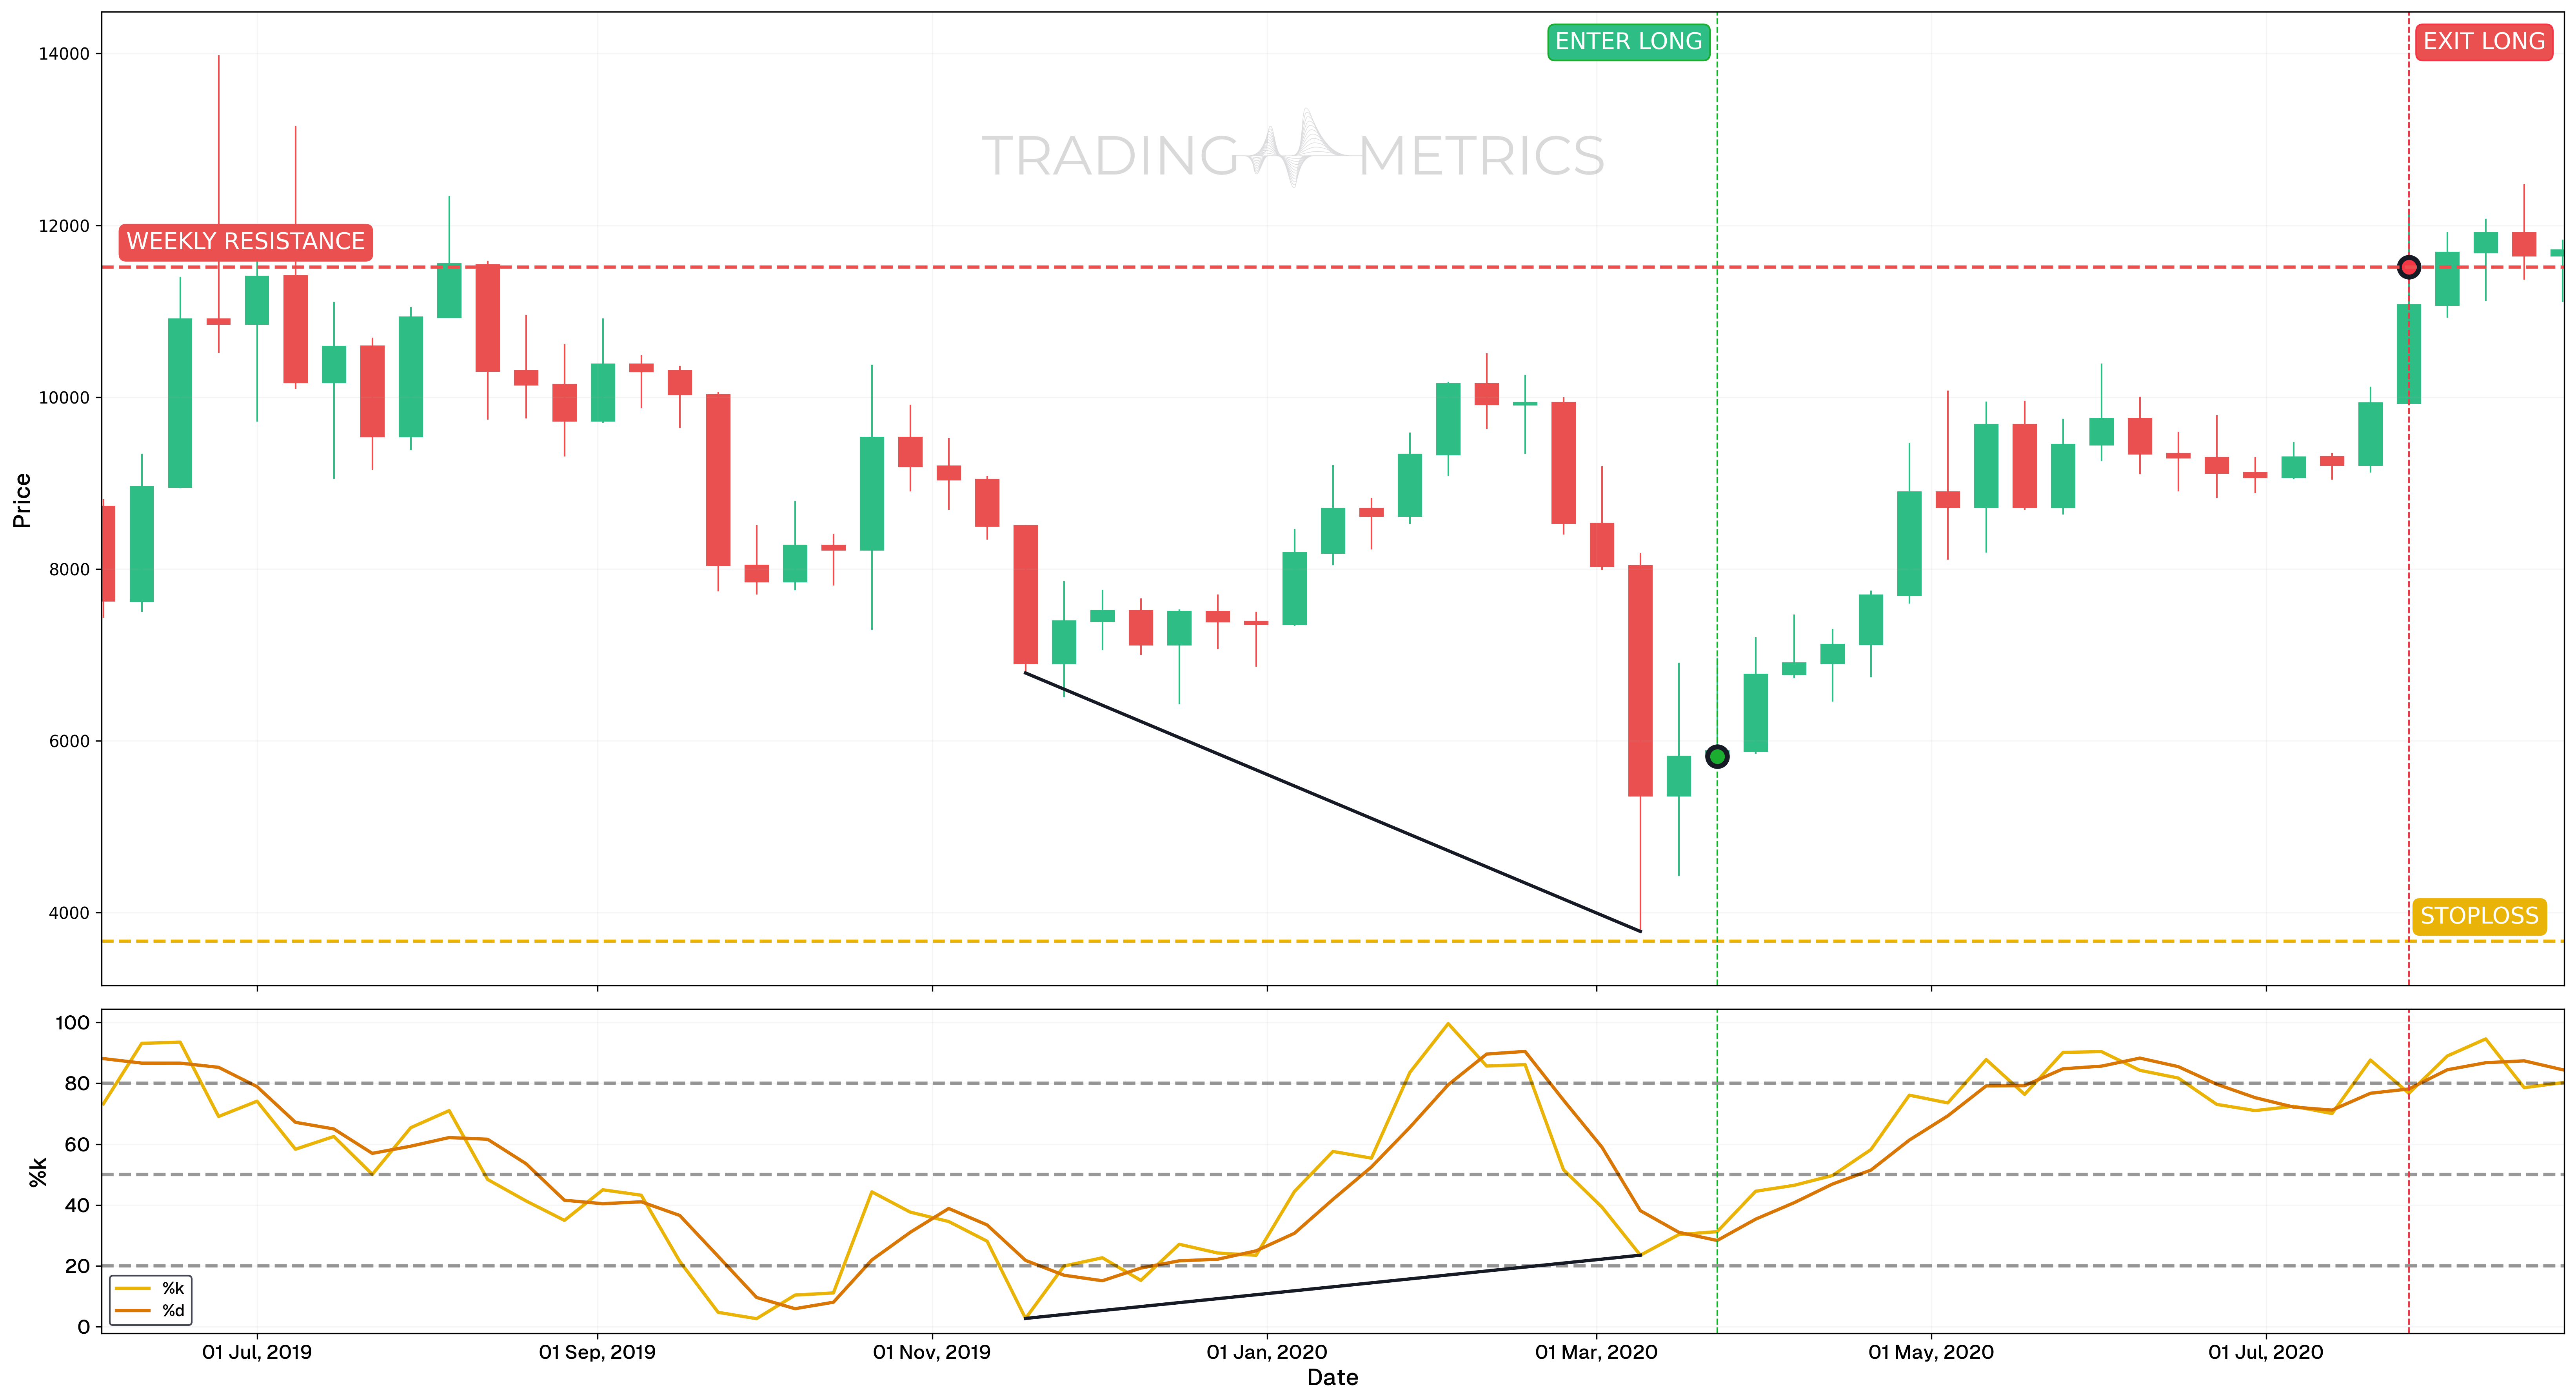
- A bullish divergence was identified on the BTC/USDT chart between 18 November 2019 and 09 March 2020, signaling a potential trend reversal.
- On the candlestick chart, price printed a lower low by 09 March 2020, confirming bearish exhaustion and downward momentum weakening.
- The Stochastic Oscillator %K line showed a higher low between the same dates, signaling strengthening momentum despite falling prices.
- A Spinning Top candle formed on 16 March 2020, showing market indecision and a potential shift in sentiment before the confirmed entry.
- This confluence of bullish divergence and a reversal candlestick pattern highlighted a strong opportunity for a long trade, aligning with expectations of an upward price movement.
Trade Setup
- Entry: Long position on 23 March 2020 at $5,816.05 (weekly close confirmation of divergence and Spinning Top candle).
- Exit: 27 July 2020 at $11,515.00.
- Exit reason: Price reached a significant weekly resistance level.
- Outcome: The trade captured a +97.99% price increase (from $5,816.05 to $11,515.00), reinforcing the power of bullish divergence signals.
Risk Management
- Stop-Loss Placement: The stop-loss was set at $3,668.27, a key support level, to minimize downside risk while giving the trade sufficient room to develop.
- Position sizing: Position sizing was calculated to maintain a maximum risk exposure of 2% of account capital.
- Risk-Reward Analysis: The trade setup provided a Risk-Reward Ratio of 1:2.65, balancing upside potential with defined risk.
- Managing Volatility: The stop-loss was actively monitored and trailed upward as price advanced, locking in gains while guarding against reversals.
Combining the Stochastic Oscillator with Other Tools
To enhance the effectiveness of the Stochastic Oscillator, traders often combine it with other technical analysis tools such as:
- Moving Averages: To confirm trends.
- Bollinger Bands: To identify volatility and potential breakout points.
- Relative Strength Index (RSI): For additional confirmation of overbought or oversold conditions.
- Support and Resistance Levels: To validate signals generated by the Stochastic Oscillator.
Combine Multiple Timeframes: Validate signals on your trading timeframe by checking higher timeframes for confirmation of the trend or key levels.
Key Points
- Momentum Indicator: The Stochastic Oscillator measures the position of a security’s closing price relative to its price range over a specified period, helping identify overbought and oversold conditions.
- Range Interpretation: Values above 80 indicate overbought conditions, signaling a potential price correction or reversal. Values below 20 indicate oversold conditions, suggesting potential buying opportunities.
- Fast and Slow Variants: The Stochastic Oscillator has two lines: %K (The faster line) - showing the current price position and %D (smoothed version of %K), often used for generating signals.
- Crossover Signals: A bullish signal occurs when %K crosses above %D in the oversold region. A bearish signal occurs when %K crosses below %D in the overbought region.
- Divergence Signals: Bullish divergence (price makes lower lows, oscillator makes higher lows) and bearish divergence (price makes higher highs, oscillator makes lower highs) can indicate potential reversals.
- Effective in Range-Bound Markets: The Stochastic Oscillator performs well in sideways or consolidating markets but may give false signals in strong trending conditions.
- Customizable Settings: The default setting uses 14 periods, but traders can adjust this to increase sensitivity for shorter periods or reduce noise with longer periods.
- Use with Trend Indicators: Combine the Stochastic Oscillator with trend-following tools like moving averages or ADX to confirm signals and avoid false readings.
- Dynamic Support and Resistance: The oscillator often reacts near key levels, helping refine entry and exit points.
- Backtesting and Monitoring: Test the Stochastic Oscillator on historical data and monitor its performance in live markets to adapt it to specific strategies or asset classes.
Conclusion
The Stochastic Oscillator is a versatile and powerful tool for traders. By highlighting overbought and oversold conditions, signaling potential reversals, and providing momentum insights, it plays a vital role in crafting effective trading strategies. Remember, its true strength lies in being part of a broader toolkit, combined with other indicators and sound risk management practices. Embrace the dance of the market with the Stochastic Oscillator, and you’ll find yourself better equipped to navigate its rhythm.
Frequently Asked Questions
Quick answers based on this page's topic.
While RSI measures the speed of price changes, the Stochastic Oscillator compares a specific closing price to its price range over a certain period. It is generally more sensitive than RSI and is better at identifying turning points in sideways or range-bound markets.
The %K line (the 'fast' line) represents the actual value of the oscillator, while the %D line (the 'slow' line) is a 3-day moving average of %K. A crossover—where %K moves above or below %D—is often used as a tactical entry or exit signal.
In a strong trend, Stochastics can give false signals by reaching extreme levels quickly. To increase accuracy, only take 'oversold' buy signals during an uptrend and 'overbought' sell signals during a downtrend, aligning your oscillator trades with the dominant market direction.