Symmetrical Triangle Pattern: Reading the Compression Before a Move
The Symmetrical Triangle pattern is a balanced continuation signal in technical analysis, often forming during a trend as price consolidates. Imagine it as a narrowing coil - price squeezing between converging trendlines - before breaking out to resume the trend. When this pattern takes shape, it’s a poised hint that momentum is tightening, offering traders a chance to ride the breakout, whether bullish or bearish, depending on the prior trend’s direction.
How to Identify the Symmetrical Triangle Pattern in Trading
The Symmetrical Triangle is a continuation formation. It develops when price consolidates between converging trendlines, creating a tightening range before breaking out. The setup confirms when price breaks above resistance or below support. Here’s how to spot it:
Start with the Big Picture
This pattern appears during an ongoing trend. Price compresses as highs get lower and lows get higher, signaling indecision that resolves with a breakout in the trend’s direction.
Trace the Triangle Shape
The Symmetrical Triangle is formed by two converging lines. Spotting both confirms the structure.
- Upper Trendline: A descending line connecting lower highs.
- Lower Trendline: An ascending line connecting higher lows.
- Triangle Formation: Price swings contract as the lines converge, building pressure.
Zero in on the Key Levels
The upper trendline acts as resistance, while the lower trendline serves as support. A breakout through either level completes the pattern.
Watch the Breakout
The trigger depends on the breakout direction.
- Bullish Breakout: Price closes above the upper trendline, confirming continuation of the uptrend.
- Bearish Breakout: Price closes below the lower trendline, confirming continuation of the downtrend.
Both provide clear entry points aligned with the breakout.
Check Volume for Additional Confirmation
Volume typically contracts as the triangle narrows.
- Declines during consolidation.
- Spikes on the breakout, validating momentum and conviction.
Set the Move: Measure the height of the triangle at its widest point (base) and project it from the breakout point - upward for bullish, downward for bearish - for a realistic price target.
How to Trade the Symmetrical Triangle Pattern (Trading Example)
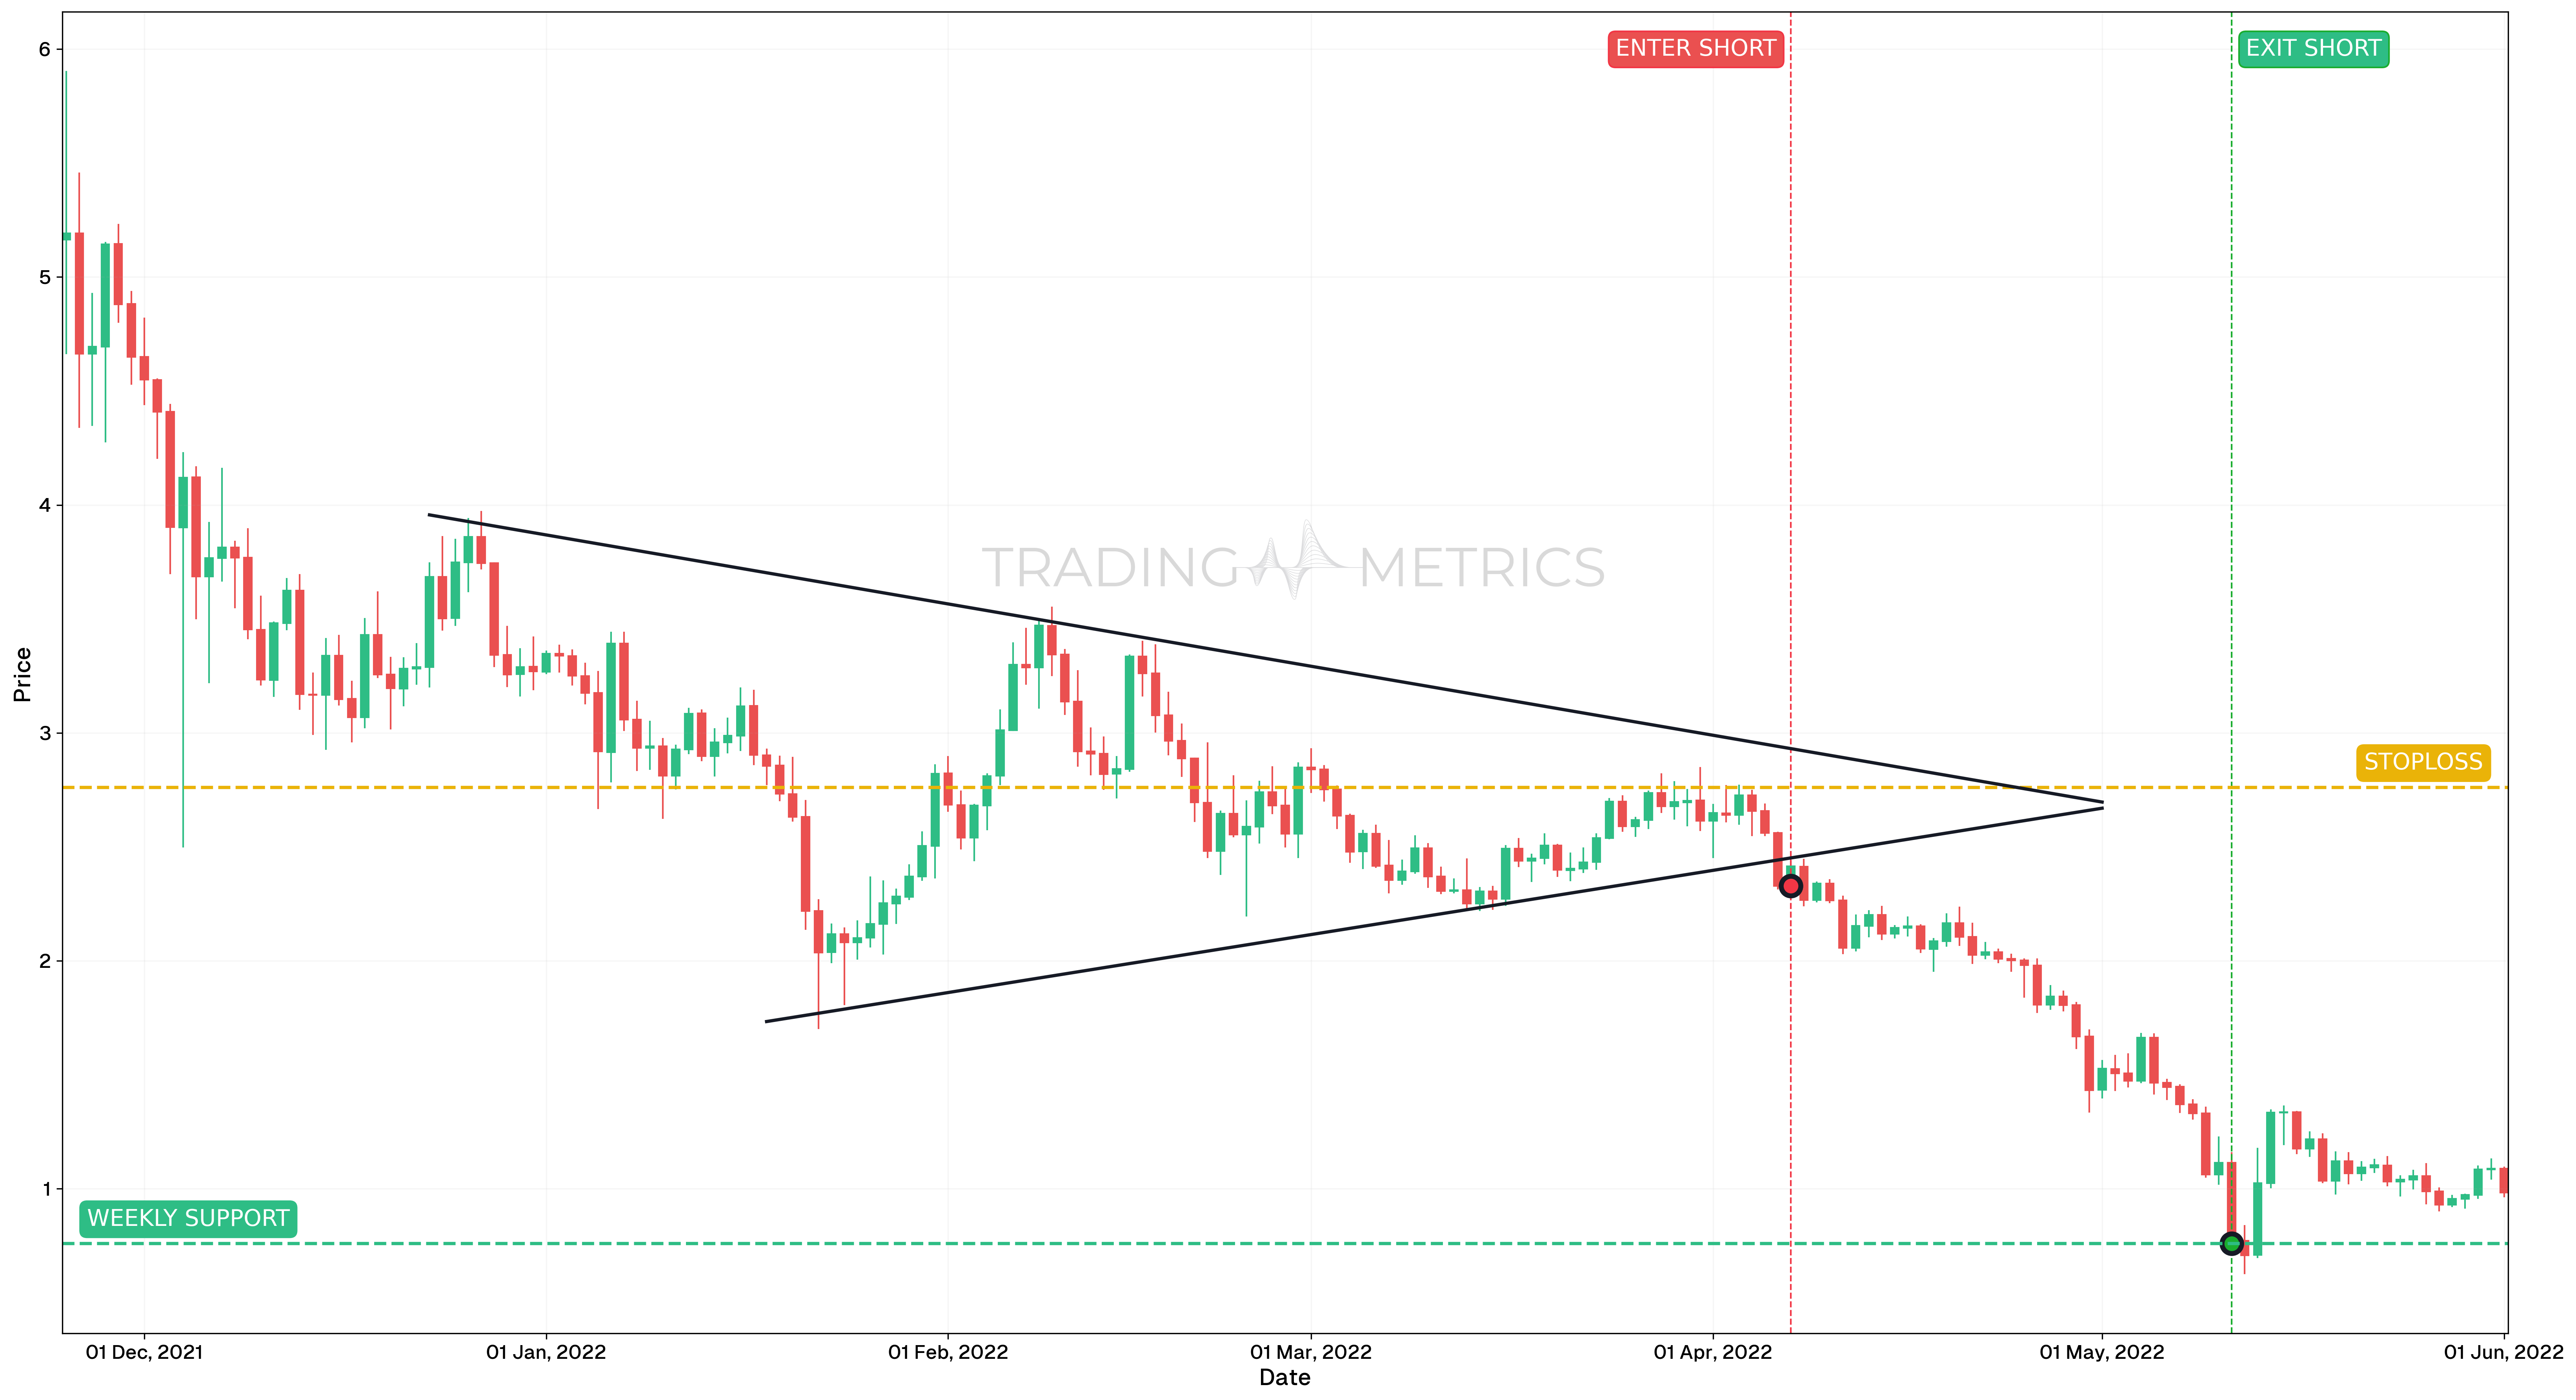
To illustrate how the Symmetrical Triangle pattern can be used to enter a trade, we will choose the MANAUSDT pair. This altcoin printed a bearish continuation setup on the daily chart, signaling the resumption of downside momentum after a period of consolidation.
Analysis
Between late November 2021 and early April 2022, MANAUSDT formed a tight Symmetrical Triangle. The price coiled between converging trendlines with no clear directional bias during the build-up phase. However, by April 7, price decisively broke to the downside, confirming the bearish continuation.
Trade Setup
-
Entry: The short position was entered on April 7, 2022, at $2.3289, as price broke below the triangle’s lower boundary. Technical signals reinforced the breakdown:
-
Exit: The position was closed on May 11, 2022, at $0.7598, at a key previous support/resistance level from earlier price history. This area was targeted to secure gains after the breakdown fully unfolded.
-
Outcome: The Symmetrical Triangle setup led to a 67.4% drop from entry to exit, delivering an effective bearish continuation pattern with clean structure and confirmation.
Risk Management
- Stop-Loss placement: The stop-loss was set at $2.761, just above the upper boundary of the triangle and the last swing high, invalidating the trade if breached.
- Position sizing: A 2% capital risk model was used, with sizing based on the distance from entry to stop-loss.
- Risk-Reward Ratio: The trade produced a Risk-Reward Ratio of 1:3.63, offering strong risk efficiency and capital preservation.
- Volatility Consideration: Volatility contracted during the triangle’s formation and expanded sharply on breakdown, helping confirm directional bias and improving risk-adjusted timing.
- Adaptive Exit Strategy: A more aggressive strategy could have held for continuation to the $0.50 level, but exiting near major structure offered a disciplined closure point.
Volume Coil: A volume spike on the breakout - up or down - unwinds the triangle into a trend continuation.
Pre-Trade Checklist
Coil the Proof: Pair the pattern with volume spikes and indicators like RSI to dodge fakes and boost your odds.
Key Points
- Line Convergence: Symmetrical, converging trendlines boost reliability - uneven slopes dilute it.
- Time Frame: Works best on daily or weekly charts in defined trends.
- Combine with Indicators: Use moving averages or RSI to confirm direction.
- Breakout Confirmation: The breakout direction - above upper trendline or below lower trendline - sets the trend; wait for it.
- Price Target: Measure the triangle’s base height, project from the break (up for bullish, down for bearish) for your goal.
- Risk Management: For bullish, set a stop-loss below lower trendline; for bearish, above upper trendline to limit losses if it fails.
Wait for the Break: Acting before the breakout risks a coiled trap - let the direction unwind.
Conclusion
The Symmetrical Triangle pattern is a trader’s poised tool for riding trend continuations, whether bullish or bearish. Its tightening coil, paired with volume, RSI, and moving averages, can spark big moves. Whether in crypto, stocks, or forex, this pattern hones your play. Stay patient, manage your risk, and let the triangle tighten - that coiled range could unwind into a winning trade.
Frequently Asked Questions
Quick answers based on this page's topic.
A Symmetrical Triangle represents a period of price compression where both buyers and sellers are reaching a temporary stalemate. It signals contracting volatility and a building of energy, typically resulting in an explosive breakout that continues the direction of the trend preceding the triangle.
The most common method is the 'Base Height' technique. Measure the vertical distance between the upper and lower trendlines at the widest part (the base) and project that same distance in the direction of the breakout from the point where price exits the formation.
Fundamentally, the Symmetrical Triangle is directionally neutral. While it statistically favors continuation of the prior trend, traders should wait for a decisive candle close outside the trendlines to confirm the breakout direction before committing to a long or short position.