Inverse Head and Shoulders: The Classic Bottom Reversal
The Inverse Head and Shoulders pattern is a classic bullish reversal signal in technical analysis, often appearing after a downtrend. Picture it as a mirror image of its bearish cousin - forming a dip (the head) flanked by two shallower dips (the shoulders) - before price rockets upward. When this pattern emerges, it’s a strong nudge that bearish momentum is fading, giving traders a cue to buy or go long as an uptrend takes shape.
How to Identify the Inverse Head and Shoulders Pattern in Trading
The Inverse Head and Shoulders is a bullish reversal formation. It develops when price forms three troughs: two shallower “shoulders” on either side of a deeper “head.” The setup confirms when price breaks above the neckline. Here’s how to spot it:
Start with the Big Picture
This pattern appears after a downtrend. Sellers keep pressing lower, but the structure shows their momentum fading as buyers prepare to take control.
Trace the Three Troughs
The pattern unfolds in three distinct stages. Recognizing these confirms the setup.
- Left Shoulder: Price dips to a low, then rebounds.
- Head: Price falls deeper, forming the lowest trough before bouncing.
- Right Shoulder: Price dips again, but holds above the head, then rises.
Zero in on the Neckline
The neckline connects the swing highs between the troughs. It is usually horizontal, though slight downward slopes can occur. This is the key resistance level to watch.
Watch the Breakout
The bullish trigger comes when price closes above the neckline.
- A decisive break over resistance or
- A strong bullish candle
Both confirm the reversal and set up the entry.
Check Volume for Additional Confirmation
Volume behavior strengthens the pattern’s reliability.
- Spikes on the head as sellers overextend.
- Lightens on the right shoulder as pressure eases.
- Surges on the breakout, confirming buyers are in control.
Set Your Sights: Measure the height from the head to the neckline and project it upward from the break for a realistic price target.
How to Trade the Inverse Head and Shoulders Pattern (Trading Example)
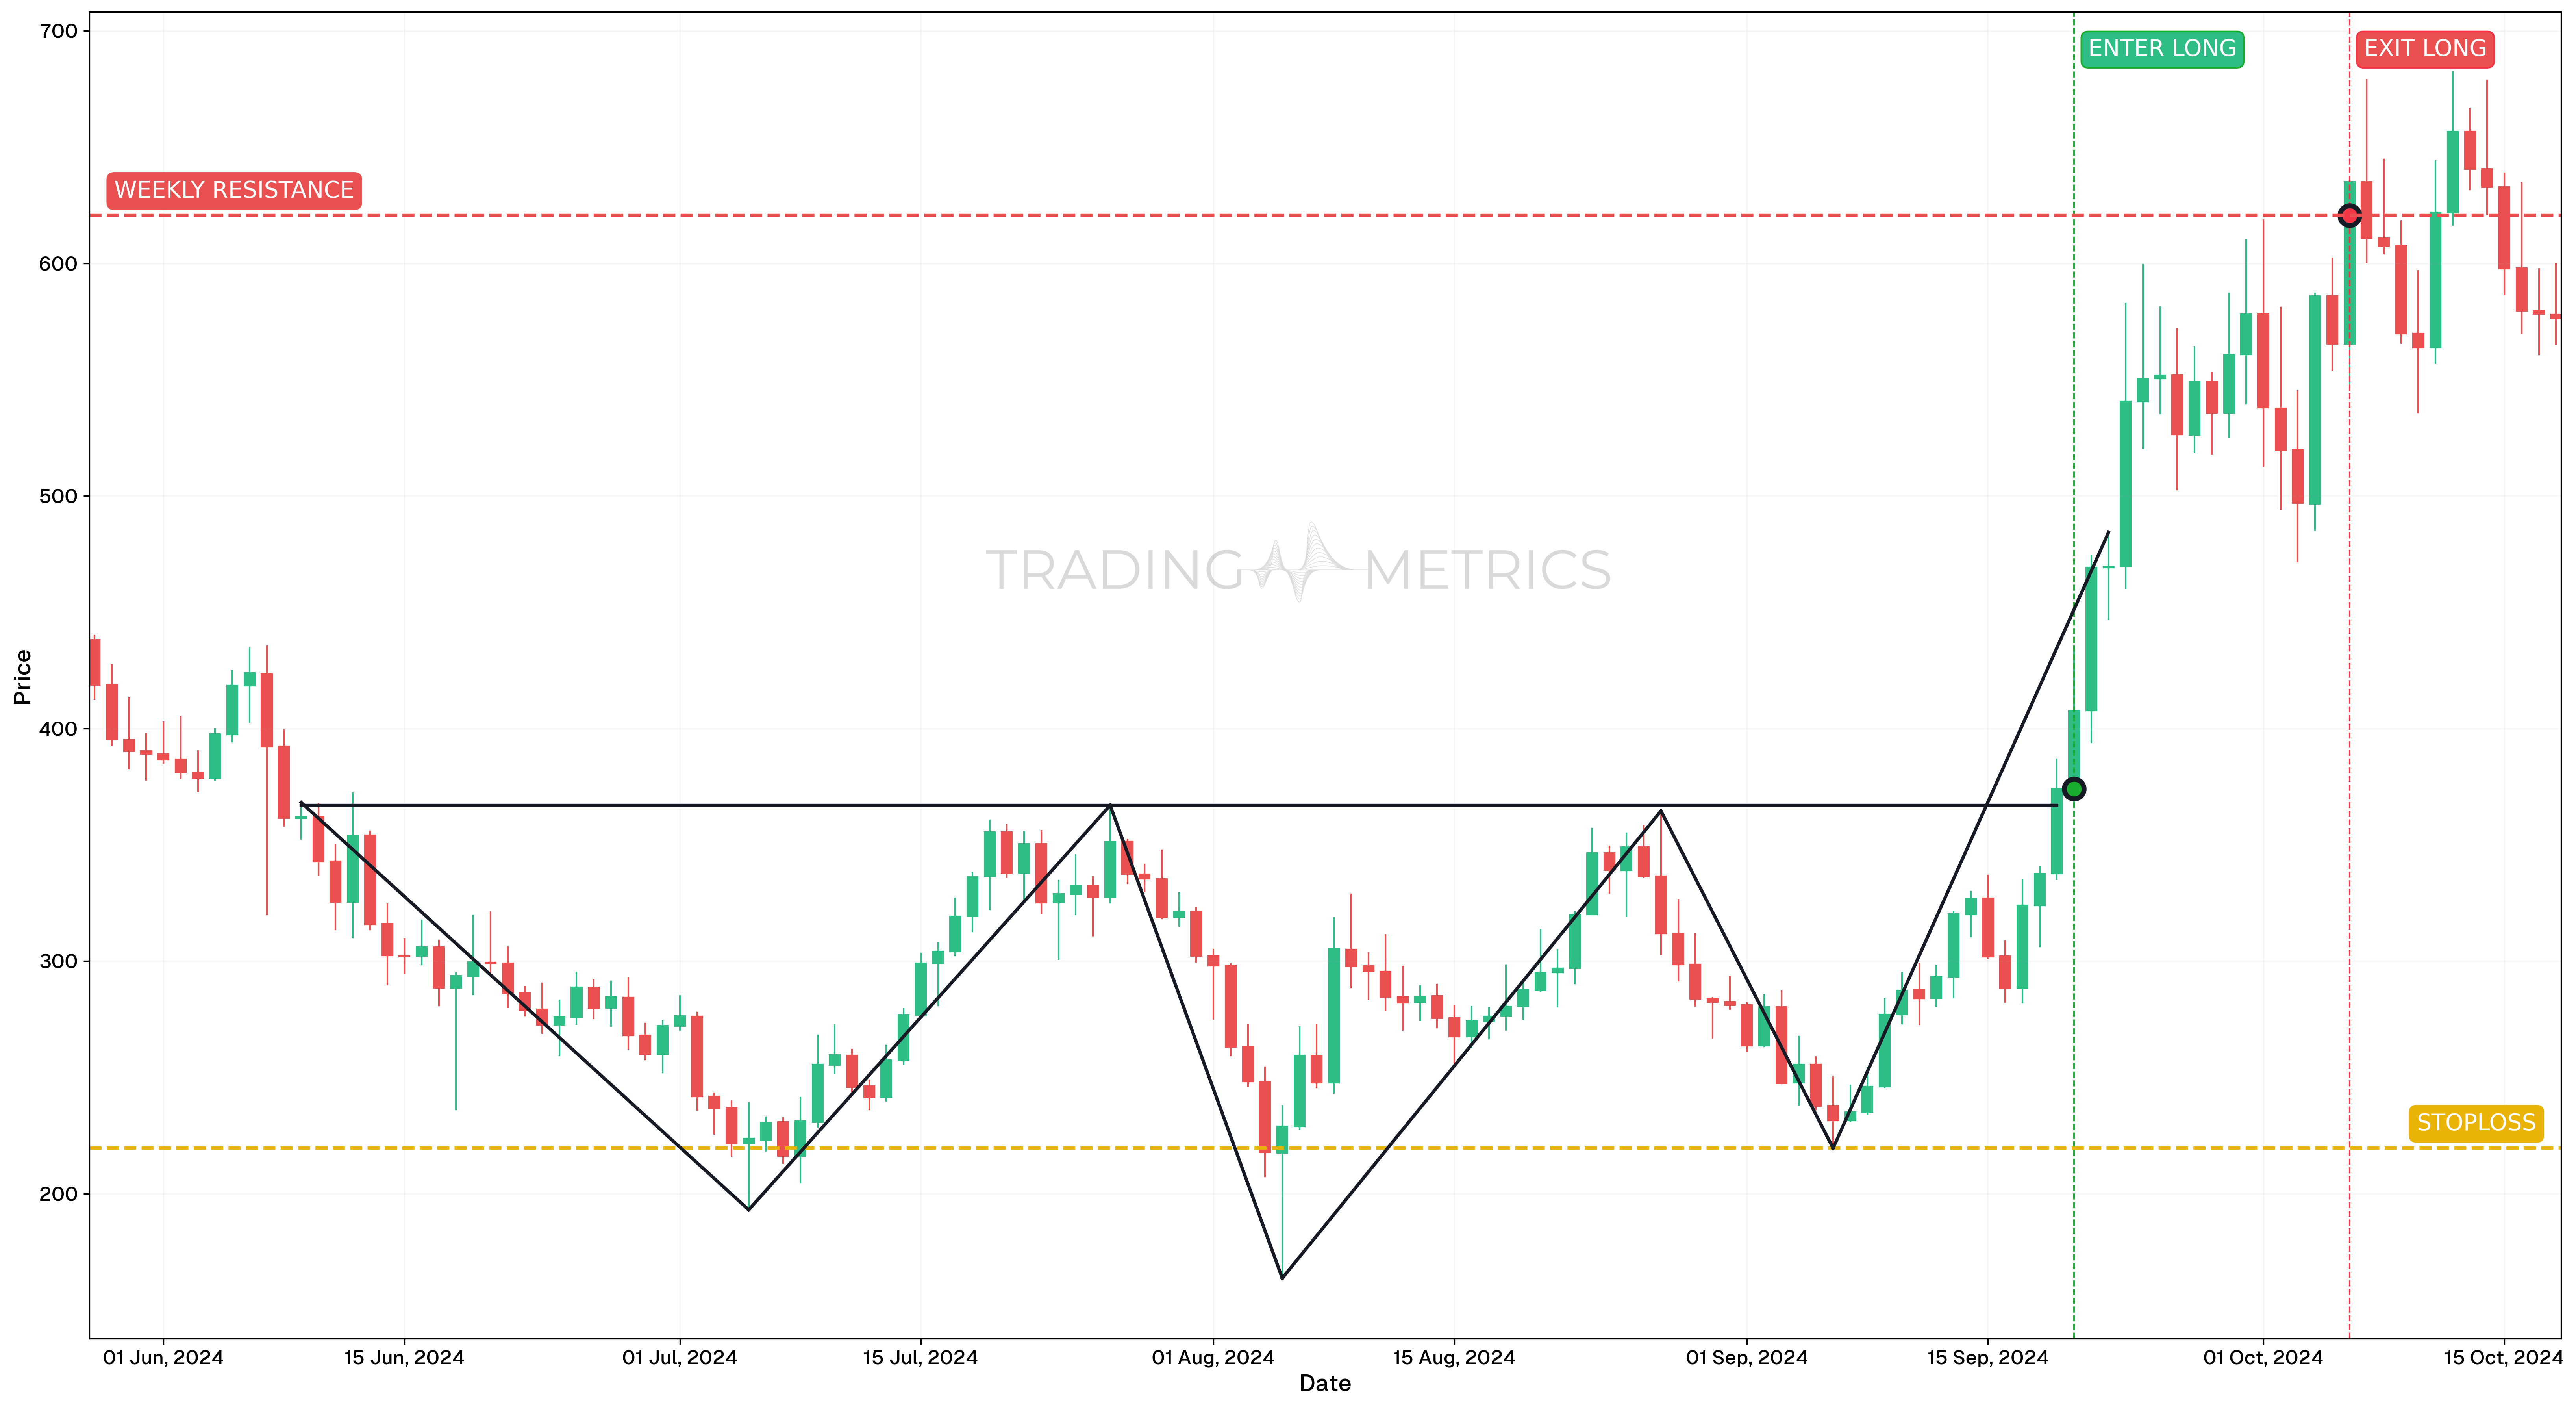
To illustrate how the Inverse Head and Shoulders pattern can be used to enter a trade, we will choose the TAOUSDT pair. This newly listed asset formed a textbook reversal structure on the daily chart, offering a clean trend reversal signal after a prolonged downtrend.
Analysis
Between late May and mid-September 2024, TAOUSDT formed an Inverse Head and Shoulders pattern. Price action created a clear left shoulder, a lower low (the head), and a higher low (the right shoulder), indicating accumulation and loss of bearish strength. A neckline breakout occurred in late September, completing the pattern and confirming bullish intent.
Trade Setup
- Entry: The long position was entered on September 20, 2024, at $374.10, after a breakout above the neckline of the Inverse Head and Shoulders. Momentum confluence supported the entry: RSI crossed above 50 and was rising, while StochRSI had already crossed bullish a few candles earlier and remained above 80.
- Exit: The trade was closed on October 6, 2024, at $620.60, using a structural price reference. On the first day the pair previously reached that level, the candle closed at approximately that same price, making it a clear technical reference point for exit.
- Outcome: The Inverse Head and Shoulders reversal delivered a 65.9% gain from entry to exit. The trade played out cleanly, respecting both the pattern structure and momentum alignment.
Risk Management
- Stop-Loss placement: The stop-loss was set at $219.60, below the head of the formation. This protected the position in case of pattern failure while respecting the structural invalidation zone.
- Position sizing: The trade used a 2% capital risk model, sized based on the distance between the entry and stop-loss level to maintain proper risk control.
- Risk-Reward Ratio: The setup produced a Risk-Reward Ratio of 1:1.60 - a solid and balanced return for a high-conviction reversal pattern.
- Volatility Consideration: As TAOUSDT was a relatively new listing, Volatility was high. Confirmation from both RSI and StochRSI helped validate the breakout, reducing the risk of false signals.
- Adaptive Exit Strategy: While the candle-based structural target worked well for this setup, a trailing stop could have been applied after such a strong breakout. However, respecting historical price closure zones provided a disciplined and technically sound exit.
Volume Surge: A volume spike on the neckline break lifts the pattern into a bullish soar.
Pre-Trade Checklist
Solidify the Signal: Pair the pattern with volume pops and indicators like RSI to dodge fakes and amp your odds.
Key Points
- Symmetry Matters: Shoulders don’t need to match perfectly, but closer symmetry boosts reliability.
- Time Frame: Shines on daily or weekly charts for clearer signals.
- Combine with Indicators: Use moving averages or RSI to refine your entry.
- Breakout Confirmation: The neckline break flips the script - don’t move too soon.
- Price Target: Measure from head to neckline, project up from the break for your target.
- Risk Management: Set a stop-loss below the head to limit losses if it fails.
Patience Pays: Acting before the neckline break risks a head fake - wait for the lift.
Conclusion
The Inverse Head and Shoulders pattern is a trader’s gem for catching bullish reversals. Its three-trough setup, paired with volume, RSI, and moving averages, can spark big gains. Whether in crypto, stocks, or forex, mastering this pattern sharpens your edge. Stay steady, manage your risk, and let the shoulders rise - that deep dip could launch a profitable climb.
Frequently Asked Questions
Quick answers based on this page's topic.
Its reliability comes from its clear depiction of failing market structure. The lower 'head' shows a final panic low, but the higher 'right shoulder' proves that sellers are no longer strong enough to reach previous lows, signaling a permanent shift in dominance.
A breakout is confirmed when price closes decisively above the neckline—the resistance level connecting the two shoulder peaks. A surge in volume during this close provides a critical signal that buyers are aggressively accumulating positions.
The most technical stop-loss placement is just below the low of the right shoulder. Since the pattern depends on the bulls' ability to keep price above that higher low, a move below the shoulder invalidates the reversal thesis.