Head and Shoulders Pattern: Diagnosing Trend Exhaustion
The Head and Shoulders pattern is one of the most well-known and reliable technical analysis patterns, often signaling a bearish reversal in the market. Imagine it as a visual metaphor where the market’s sentiment forms a peak (the head) with two smaller peaks (the shoulders) on either side. When this pattern appears, it suggests that a trend reversal is likely, offering traders a cue to consider selling or shorting the asset.
How to Identify the Head and Shoulders Pattern in Trading
The Head and Shoulders is a bearish reversal formation. It develops after an uptrend when price forms three peaks: two smaller “shoulders” on either side of a higher “head.” The pattern completes with a breakdown below the neckline. Here’s how to spot it:
Start with the Big Picture
This pattern forms after a clear uptrend. Buyers push higher but struggle to maintain momentum, creating a distinctive three-peak structure that signals potential reversal.
Trace the Three Peaks
The Head and Shoulders is built from three distinct parts. Recognizing each step confirms the setup.
- Left Shoulder: Price rallies, then pulls back to form the first peak.
- Head: Price surges higher, creating a peak above the shoulders, then declines.
- Right Shoulder: Price rallies again but fails to exceed the head, forming a lower peak similar to the left shoulder.
Zero in on the Neckline
The neckline connects the two troughs between the peaks. It can slope upward or run horizontal, but it serves as the critical support level for the pattern.
Watch the Breakdown
The bearish trigger comes when price closes below the neckline.
- A decisive break under support or
- A strong bearish candle
Both confirm the reversal and set up the entry point.
Check Volume for Additional Confirmation
Volume behavior adds confidence to the setup.
- Tends to decline through each peak, showing buyer fatigue.
- Spikes on the neckline break, confirming sellers have taken control.
Set Realistic Targets: Use the height of the head to the neckline to project your price target, and set stop losses wisely.
How to Trade the Head and Shoulders Pattern (Trading Example)
To illustrate how the Head and Shoulders pattern can be used to enter a trade, we will choose the BTCUSDT pair. This is a popular trading pair in the cryptocurrency market, where technical analysis can be effectively applied.
Analysis
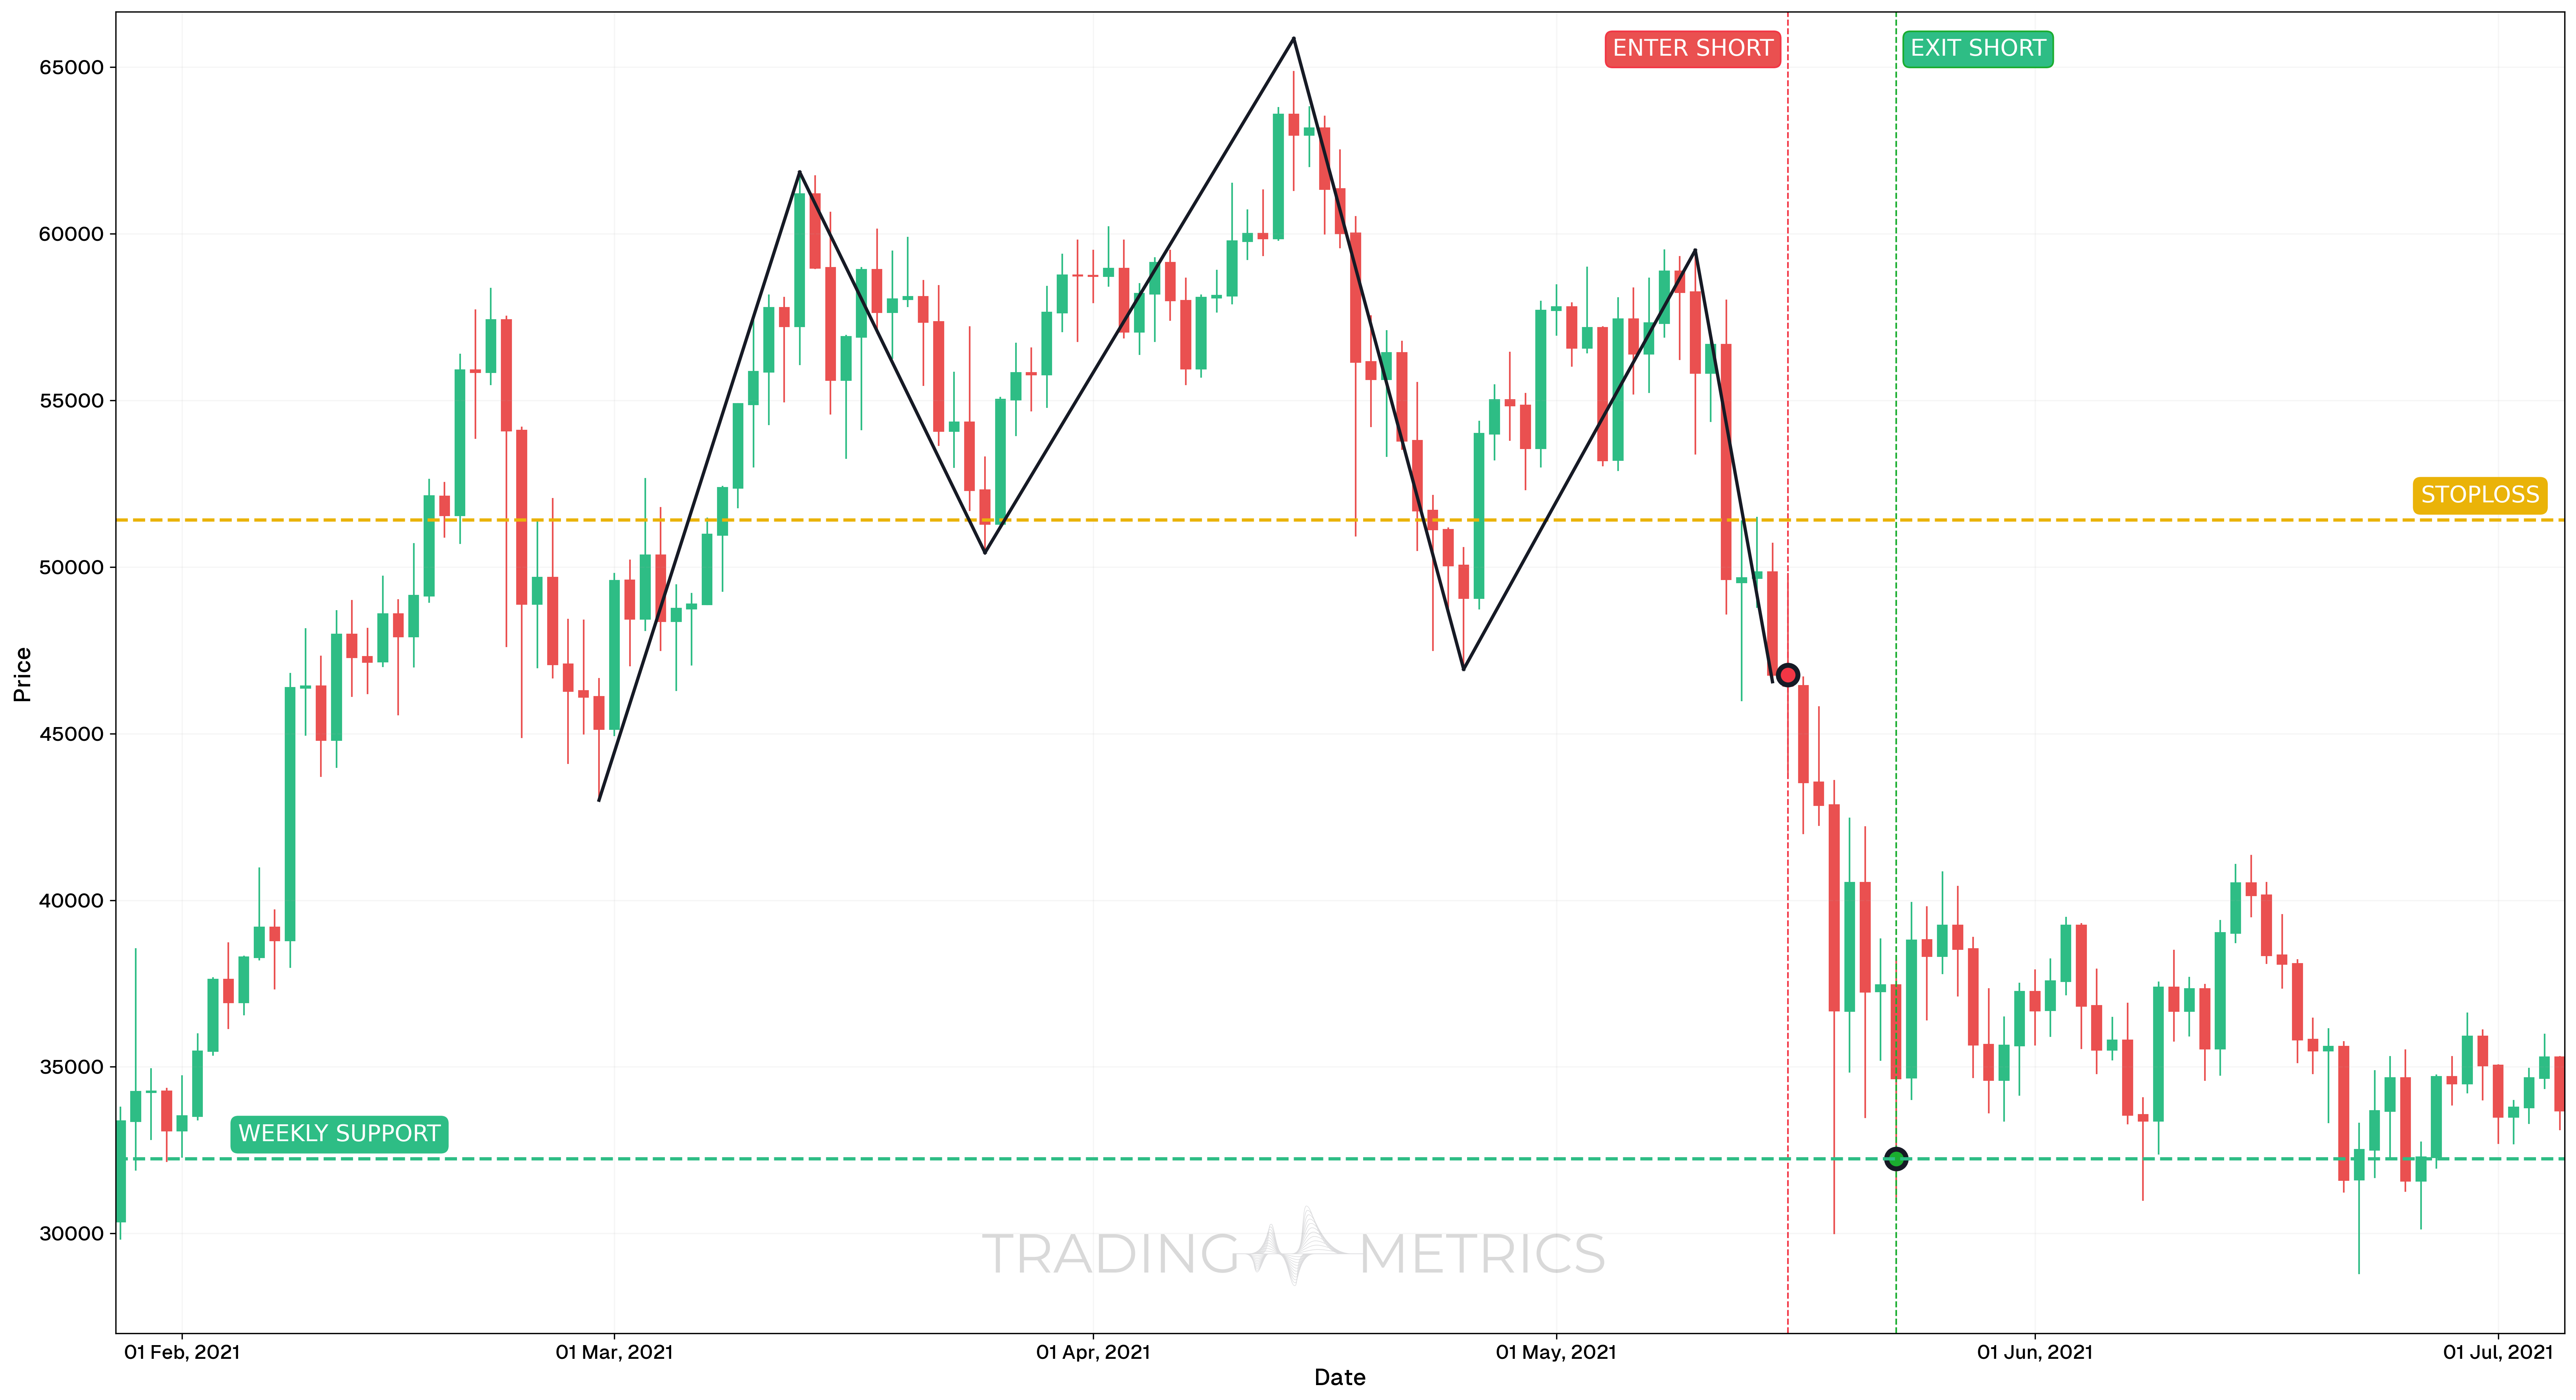
During the first half of 2021, BTCUSDT formed a recognizable Head and Shoulders pattern on the daily chart. The structure emerged gradually, with a clear peak (the head) standing above two lower highs (the left and right shoulders), forming within the broader timeframe from January 28 to early May. By mid-May, a breakdown occurred, confirming the pattern and offering a potential trend reversal signal.
Trade Setup
- Entry: The short position was initiated on May 16, 2021, at $46,762.99. This entry was based on multiple technical confirmations: a StochRSI bearish cross, RSI dropping below 50, and a clean break below the neckline of the pattern - signaling a shift in trend and breakdown momentum.
- Exit: The trade was closed on May 23, 2021, at $32,238.68, near a major support-turned-resistance zone. This level had acted as support during earlier price consolidations, making it a conservative and technically justified exit point.
- Outcome: The trade yielded a strong 31.06% move, respecting the pattern’s breakdown structure. This was a textbook example of how confirmation-based entry and disciplined exit planning can result in a high-probability, high-reward setup.
Risk Management
- Stop-Loss placement: The stop was placed at $51,405.45, just above the most recent swing high prior to breakdown. This level served as a technical invalidation point; if price reclaimed it, the bearish setup would be considered failed. This allowed enough breathing room to avoid getting stopped out by normal Volatility.
- Position sizing: The position was sized using a 2% capital risk model, based on the difference between entry and stop. This kept risk exposure consistent and controlled.
- Risk-Reward Ratio: The trade offered a Risk-Reward Ratio of 1:3.13 - well above the minimum 1:2 threshold often used by technical traders. The setup allowed for significant downside potential relative to the defined risk.
- Volatility Consideration: BTC’s high Volatility was accounted for by confirming multiple signals (StochRSI, RSI, neckline break) before entry. This reduced the likelihood of entering on a false move.
- Adaptive Exit Strategy: Traders with higher risk tolerance might have targeted lower support levels near $28,000, based on the measured move from the pattern’s height. However, the conservative target captured most of the move with lower exposure to reversal risk.
Volume Matters: A significant increase in volume during the breakdown strengthens the reliability of the pattern.
Pre-Trade Checklist
Confirmation is Key: A pattern alone isn’t enough - look for volume spikes, neckline retests, and confluence with key technical indicators to improve trade confidence and reduce false signals.
Key Points
- Pattern Symmetry: While exact symmetry is rare, patterns are more reliable when the shoulders are similar in height and width.
- Time Frame: This pattern can form on various time frames, but the longer the time frame (e.g., daily or weekly), the stronger the signal.
- Combine with Other Indicators: Use other technical indicators like moving averages or the Relative Strength Index (RSI) to confirm the pattern and improve trade entry accuracy.
- Confirmation of Trend Reversal: Traders often wait for a clear break below the neckline before taking action. This breakdown is seen as confirmation that the prior uptrend has reversed.
- Setting a Price Target: To estimate the potential price move, measure the distance from the head to the neckline. This distance is then projected downwards from the point of breakout to set a price target.
- Risk Management: Place stop-loss orders above the right shoulder to limit potential losses if the pattern fails.
Patience is Key: Wait for a clear break below the neckline before acting. Premature trades can lead to false signals.
Conclusion
The Head and Shoulders pattern is a powerful tool for identifying bearish reversals. However, it’s essential to use it in conjunction with other technical analysis tools like volume, moving averages, and RSI to confirm the signal. Also Head and Shoulders pattern offers traders a clear visual cue of a potential market reversal, making it an indispensable part of any trader’s toolkit. Whether you’re trading stocks, cryptocurrencies, or forex, understanding and effectively using this pattern can significantly enhance your trading outcomes. Just remember to combine it with other tools, manage your risk, and be patient for the right setup to unfold.
Frequently Asked Questions
Quick answers based on this page's topic.
Its reliability comes from its clear depiction of failing market structure. The higher 'head' shows a successful trend peak, but the lower 'right shoulder' proves that bulls are no longer strong enough to reach previous highs, signaling a shift in dominance.
A breakout is confirmed when price closes decisively below the neckline—the support level connecting the two shoulder troughs. A surge in volume during this close provides a critical 1:1 signal that sellers are aggressively liquidating positions.
The most technical stop-loss placement is just above the high of the right shoulder. Since the pattern depends on the bears' ability to keep price below that level, a move above the shoulder invalidates the reversal thesis.
Yes. If price breaks above the right shoulder after the neckline was tested, the pattern is invalidated. Failed Head and Shoulders setups often trigger aggressive moves in the opposite direction because traders who shorted the breakdown are forced to cover their positions, creating a short squeeze.
Daily and weekly charts produce the most reliable Head and Shoulders patterns because they reflect broader institutional positioning rather than intraday noise. Patterns on 5-minute or 15-minute charts can work for scalping but have a significantly higher failure rate and require faster execution.